Role of Delay on Planktonic Ecosystem in the Presence of a Toxic Producing Phytoplankton
Abstract
A mathematical model is proposed to study the role of distributed delay on plankton ecosystem in the presence of a toxic producing phytoplankton. The model includes three state variables, namely, nutrient concentration, phytoplankton biomass, and zooplankton biomass. The release of toxic substance by phytoplankton species reduces the growth of zooplankton and this plays an important role in plankton dynamics. In this paper, we introduce a delay (time-lag) in the digestion of nutrient by phytoplankton. The stability analysis of all the feasible equilibria are studied and the existence of Hopf-bifurcation for the interior equilibrium of the system is explored. From the above analysis, we observe that the supply rate of nutrient and delay parameter play important role in changing the dynamical behaviour of the underlying system. Further, we have derived the explicit algorithm which determines the direction and the stability of Hopf-bifurcation solution. Finally, numerical simulation is carried out to support the theoretical result.
1. Introduction
The study of plankton system is an important area of research in marine ecology. Phytoplankton perform great service for earth. They provide food for marine life, oxygen for human being and also absorb half of the carbon dioxide which may be contributing to the global warming [1]. The dynamics of rapid (massive) increase or almost equal decrease of phytoplankton population is a common feature in marine plankton ecology and known as bloom. Blooms of red tide produce chemical toxin, a type of paralytic poison which can be harmful to zooplankton, fin fish, shellfish, fish, birds, marine mammals, and humans also. Some species, such as the dinoflagellate Alexandrium tamarense and the diatom Pseudo-nitzschia australis [2] produce potent toxins which are liberated into the water before they are eaten, and they may well affect zooplankton when they are in water. It is now well established that a significant number of phytoplankton species produce toxin, such as Pseudo-nitzschia, Gambierdiscus toxicus, Prorocentrum, Ostrepsis, Coolia monotis, Thecadinium, Amphidinium carterae, Dinophysis, Gymnodinium breve, Alexandrium, Gymodinium catenatum, Pyrodinium bahamense, Pfiesteria piscicida, Chrysochromulina polylepis, Prymnesium patelliferum, and P. parvum [3, 4]. Reduction of grazing pressure due to toxin is an important phenomena in plankton ecology [5, 6]. In aquatic system, toxin-producing phytoplankton may act as controlling factor in the phytoplankton-zooplankton interaction dynamics. Efforts have been made to study the role of toxin producing phytoplankton on the phytoplankton-zooplankton dynamics [7–9]. Toxicity may be the strong mediator of zooplankton feeding rate as shown by field studies [4, 10] and laboratory study [11].
Many researchers have been showing keen interest to investigate the direction and stability of Hopf-bifurcation of the system as refer their in [12, 13].
Our current study is motivated by [7, 8, 14], who have considered nutrient interaction with phytoplankton, phytoplankton interaction with zooplankton. The study of interacting species system with nutrient cycling which contributes to the growth of nutrient is carried out in [9, 14, 15]. A model can be more realistic if a delay effect (or time-lag) is being considered in the conversion from one species to another species [15–17]. The prey-predator systems with time delay are deeply considered by [18, 19] and many researchers have used distributed delay in their models [15, 16].
2. Mathematical Model Formulation
3. Boundedness and Equilibria of the System
In this section, we will establish that the system (2.6) is bounded. We begin with the following lemma.
Lemma 3.1. The system (2.6) is uniformly bounded in Ω1, where
Proof. Let us consider a time dependent function:
- (i)
boundary equilibrium: E1 ≡ (α, 0,0, α),
- (ii)
boundary equilibrium: E2 ≡ (γ/β1, (αβ1 − γ)/(β − kβ1)γ, 0, γ/β1). The boundary equilibrium E2 exists if either γ/α < β1 < β/k or β/k < β1 < γ/α is satisfied, that is, growth rate of phytoplankton biomass lies between the fraction of natural death rate of phytoplankton biomass to constant supply rate of nutrient and the fraction of nutrient uptake by phytoplankton biomass to fraction of dead phytoplankton biomass,
- (iii)
positive interior equilibrium: , where
()The positive interior equilibrium E3 exists if μ1 > ξ + ξ1, that is, the growth rate of zooplankton biomass is greater than the sum of natural death rate and death due to harmful phytoplankton, and also if means that concentration of nutrient at equilibrium is greater than the fraction of natural death rate of phytoplankton biomass to the depletion rate of nutrient uptake by phytoplankton biomass.
4. Dynamic Behaviour and Hopf-Bifurcation
In the previous section we observed that the system of (2.6) have three equilibria, namely, E1(α, 0,0, α), E2(γ/β, (αβ1 − γ)/(β − kβ1)γ, 0, γ/β), and . We will now examine the dynamical behaviour of the system about all the feasible equilibria.
The eigenvalues of the characteristic equation of V1 are λ1 = −1, λ2 = (αβ1 − γ), λ3 = −ξ, and λ4 = −α1. It is seen from these eigenvalues that the equilibrium E1 is locally asymptotically stable if β1 < γ/α, which means that the growth rate of phytoplankton due to the availability of nutrient is less than the fraction of natural death rate of phytoplankton biomass to the constant input rate of nutrient.
Clearly, λ1, λ2, and λ3 have negative real parts if (αβ − kγ)(β − kβ1) > 0, β1 > γ/α, that is, growth rate of phytoplankton biomass is greater then the fraction of natural death rate of phytoplankton biomass to constant supply rate of nutrient and are satisfied, the eigenvalue λ4 is negative when . Thus, we can state the following theorem.
Theorem 4.1. The second boundary equilibrium E2 is linearly asymptotically stable if
For the sake of convenience, the equilibrium points of the system is shifted to new points (n1, n2, n3, n4) through transformations , , , n4 = R − R*.
Thus, we can state the following theorem.
Theorem 4.2. The interior equilibrium E3 if it exists is linearly asymptotically stable when
Theorem 4.3. The system (2.6) has a Hopf-bifurcation at α* > 0 such that
To achieve the normal form of (4.6), we make another change of variable, that is, X = PY, where .
Theorem 4.4. The parameter μ2 determines the direction of the Hopf-bifurcation if μ2 > 0 (μ2 < 0), then the Hopf-bifurcation is supercritical (subcritical) and the bifurcation periodic solutions exist for α > α*(α > α*); β2 determines the stability of bifurcating periodic solution; the bifurcation periodic solutions are orbitally asymptotically stable (unstable) if β2 < 0 (β2 > 0); τ2 determines the periodic of the bifurcating periodic solution; the period increases (decreases) if τ2 > 0 (τ2 < 0).
5. Numerical Example
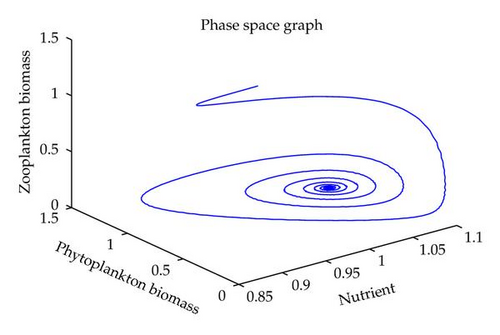
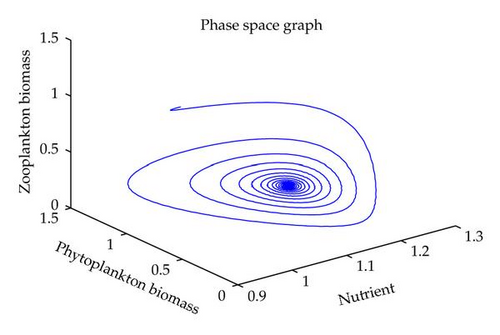
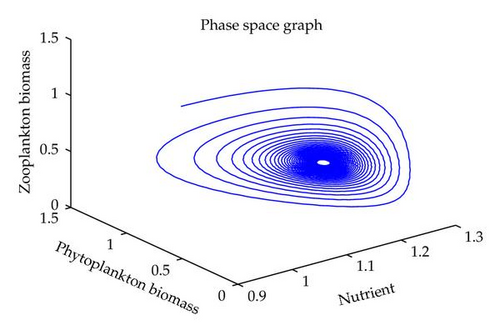
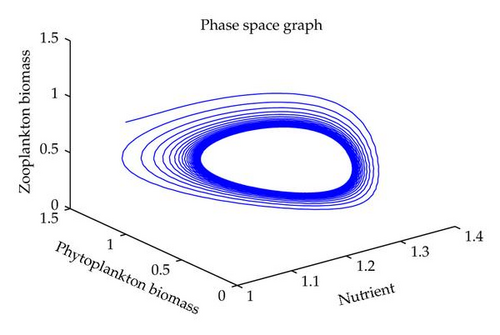
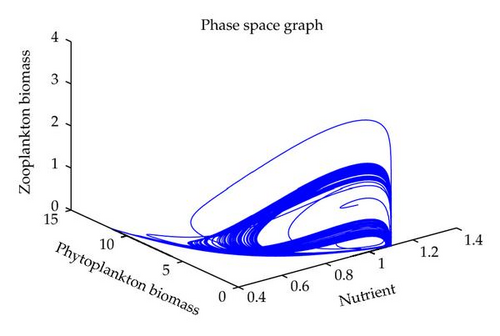
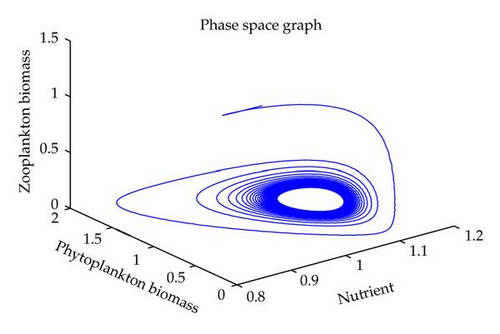
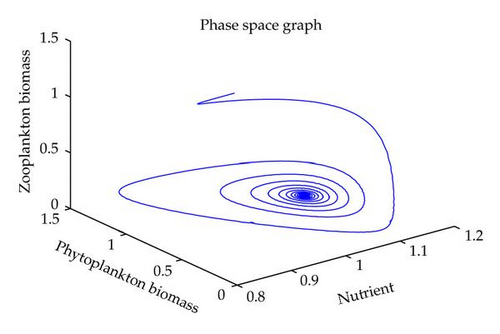
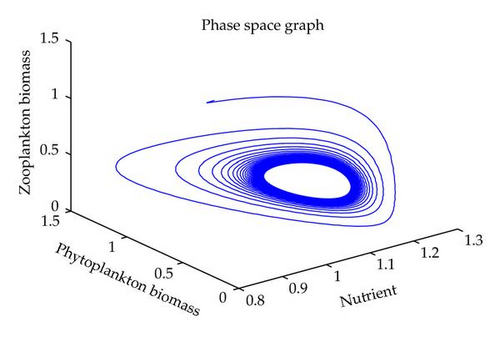
In this section, we have performed numerical simulation for both systems (2.2) as well as (2.6) using MATLAB. We are taking parametric values β = 0.3, γ = 0.2, k = 0.3, β1 = 0.25, μ = 0.2, μ1 = 0.19, ξ = 0.05, ξ1 = 0.01 for both systems. The behavior of the system (2.2) with different values of α. From Figures 1, 2, 3, 4, it is observed that as α increases, the stable system starts oscillating. Again, with these set of values and α1 = 0.12, we get a positive root of (4.12) is α = α* = 1.1680. Therefore, one pair of eigenvalues of the characteristic equation (4.8) at α = α* = 1.1680 are of the form λ1,2 = ±iv, where v is positive real number. Here the positive interior equilibrium is E3(1.06505,0.3967,0.462745). It follows from Section 4, Theorem 4.3, that α* = 1.1680, the positive equilibrium E3 is stable when α < α* (see Figure 7) and the system (2.6) undergoes a Hopf-bifurcation at α > α* (see Figure 8). Now keeping α = 1.1, further reduction of α1 at 0.01 and 0.07 are shown on Figures 5-6. Moreover, we can determine the stability and direction of periodic bifurcation from the positive equilibrium at the critical point α*. For instance, when α = α* = 1.1680, g11 = −0.0000105695 − 0.0000200596i, g20 = 0.0000362402 − 5.6110710−6i, g02 = −0.0000151012 + 0.0000457302i, g21 = −6.90210−8 − 4.0204810−8i, C1(0) = −4.0826910−8 + 1.6292810−9i, u′(α*) = 0.00115975. It follows from (4.30) that μ2 > 0 and β2 < 0. Therefore, the bifurcation takes place when α crosses α* to the right (α > α*), and the corresponding periodic orbits are orbitally asymptotically stable, as depicted in Figure 8.
6. Conclusion
In this paper, we have studied the role of delay on plankton ecosystem in the presence of a toxic producing phytoplankton. In this system, it has been assumed that the toxic phytoplankton reduces the growth of zooplankton and studied the effect of delay in the digestion of nutrient by phytoplankton biomass. The local stability conditions of all the feasible equilibria of the system are established. The interior equilibrium are locally asymptotically stable under certain conditions. We have shown numerically with the set of parameters that at α1 = 0.01, the system exhibits the chaotic behavior (see Figure 5). Figure 6 exhibits the oscillatory behavior of the system and further it is observed that the increase in α1 makes the system stable (see Figure 7). For the comparison of the system (2.6), without delay in the system, a numerical simulation of the system (2.2) is shown in Figures 1, 2, 3, 4. By applying the normal form theory and the center manifold theorem, we define the explicit formulae that determine the stability and direction of the bifurcating periodic solutions. For numerical experiment, it is observed that when the input rate of nutrient, α, exceeds the critical value α*(1.1680), the system (2.6) leads to oscillatory behaviour shown in Figure 8. Thus, the quantitative level of abundance of system populations depends crucially on the input rate of nutrient. Further from Theorem 4.4, we can determine the direction and stability of Hopf-bifurcation. For these chosen set of parametric values, the Hopf-bifurcation is supercritical and stable. Hence, we conclude that the supply rate (α) of nutrient and delay parameter (α1) play an important role in changing the dynamical behaviour of the system.


