Studies on the ns-IR-Laser-Induced Plasma Parameters in the Vanadium Oxide
Abstract
We report spectroscopic studies of laser-induced plasma (LIP) produced by ns-IR-Nd:YAG laser light pulses of different energies onto four different oxides of vanadium (VO, V2O3, VO2, and V2O5) in air under atmospheric pressure. For each oxide with a different oxidation state of vanadium, both electron density and plasma temperature were calculated for different time delays and laser pulse energies. The plasma temperature was determined from Boltzmann plot method, whereas the electron number density was estimated from the Saha equation. The decay rates for plasma temperature as well as electron density were observed to follow power law and were independent of the nature of vanadium oxide. These investigations provide an insight to optimize various parameters during LIBS analysis of vanadium-based matrices.
1. Introduction
Laser-induced breakdown spectroscopy (LIBS) is an elemental analysis technique based on the excitation of atoms present on the sample surface, by focusing a pulsed laser beam. Material amounts ranging from ng to μg are ablated in this process producing a microplasma which can be characterized by several of parameters. After the creation of the plasma, electromagnetic radiation is emitted as a consequence of several processes, namely, bremsstrahlung, recombination and de-excitation of atoms and ions occurring inside the plume [1]. De-excitation of atoms and ions leads to emission of light of characteristic frequency which can be used for both qualitative and quantitative determinations. LIBS has several attractive features like the ability to analyze nonconducting and conducting material in any phase (solids, gases, and liquids) as well as refractory materials which are difficult to digest or dissolve (ceramics, superconductors, etc.). The rapidness of analysis and multielemental analyzing capability make LIBS a highly useful technique for trace elemental determination.
Several experimental parameters are reported to affect the LIBS analysis. These include the effect of laser wavelength [2], pulse energy [3], pulse duration and shape [4, 5], and the acquisition time delay. Cabalin and Laserna studied the effect of thermal property of material on threshold laser fluence variation [6]. The different phases of iron oxide were found to have different plasma characteristics [7]. To the best of our knowledge, the effect of different oxidation states of an element present in the sample on the plasma characteristics has not been reported.
Theoretically, the information regarding laser-induced plasma (LIP) can be obtained by solving a complex system of equations describing all the reactions, for example, ionization, dissociation, recombination, elastic and inelastic collisions, radiative emission, photon reabsorption, bremstrahlung that occur in the plasma, and the respective reactions’ rates. The solution for such an equation is computationally tedious, and many times, all the relevant data needed for such computation cannot be obtained during experiments. Therefore, thermodynamical approach is usually preferred. The principle for characterization of LIP by this approach was described by Adrain and Watson [8] and is based on quantification of main physical parameters like the plasma temperature (Te), the electron density (Ne), and the number densities of the ionic and the atomic species present in the plasma. These measurements allow improving the various applications of these parameters (namely, optimizing the experimental parameters) and are also useful for a better understanding of the complex ablation mechanism. Analyses of the spectral lines can give information about the physical state of the emitting species without, in any way, interfering with the plasma. The use of laser-based optical techniques in recent years has replaced spectroscopy as a diagnostic tool to some extent. Nevertheless, spectroscopy still plays a major role in studying the physical processes occurring in the plasma.
Ne can be measured using optical emission plasma spectroscopy [9], Langmuir probe [10, 11], microwave and laser interferometry [12], and Thomson scattering [13]. Thomson scattering is the most direct method for such measurement, while the optical emission spectroscopy (using either Stark broadening of spectral lines or the Saha–Boltzmann equation) is the simplest as far as the instrumentation is concerned.
The most widely used method for determination of plasma temperature in LTE plasma is based on the fact that the number densities in various excited states follow Boltzmann distribution, and hence, the plasma temperature of the line emissions can be measured from a single species. The Boltzmann plot method provides a single value of the plasma temperature of the plasma.
The aim of the present work was to study the LIP parameters of vanadium in four different vanadium oxides (VOs). The VOs plasma were generated by the fundamental (1064 nm) wavelength of a Q-switched Nd : YAG laser. The plasma temperature and the electron density were determined from the Boltzmann plot and the Saha-Boltzmann equation, respectively. The variation of LIP parameters with acquisition time delay was also estimated using the temporal analysis of the emission lines. In addition, the effect of laser energy on the LIP parameters of vanadium mono-oxide (VO) and vanadium trioxide (V2O3) was also studied. The studies reported in this work will help to optimize different experimental parameters, for example, laser energy, acquisition delay, and so forth, for LIBS analysis of high purity vanadium based materials like crystals, glasses, or nanocomposites, and so forth.
2. Experimental
2.1. Instrumentation
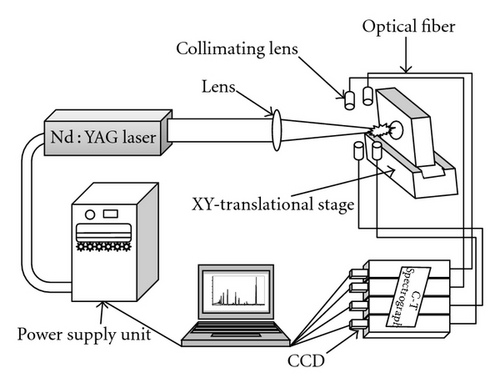
Spectrolaser 1000 M, from Laser Analysis Technologies (now known as XRF scientific), Victoria, Australia, was used. A schematic diagram of the experimental setup was shown in Figure 1. The LIBS instrument was an integrated analysis system comprising an excitation laser, optical fibers, optical spectrograph, and charge-coupled-device (CCD) array camera and is fully software controlled through a PC. The laser beam from a Q-switched Nd : YAG laser of 7 ns pulse width was capable of delivering maximum laser energy of 200 mJ at 1064 nm wavelength at a repetition rate of 10 Hz. For the present study, laser pulses at a repetition rate of 1 Hz were used for the ablation of the target. The laser was focused on to the sample by a plano-convex lens of 5 cm focal length. The laser spot area is estimated to be 8 × 10⁻⁹ m2. The sample was located on a fast XY-translational stage, which moves the sample between two successive laser pulses, exposing a new and fresh region of the sample for each laser pulse. The emission is focused to an end of a fiber optic fiber (core diameter 200 μm) having a collimating lens (0–45° field of view) placed at an angle of 45° to the direction of the plasma expansion and was transmitted to the entrance slit of spectrographs in Czerny-Turner (C-T) configuration. Four separate optical cables connected to four spectrographs were present which are individually calibrated for specific wavelength range, giving a total spectral range of 180–850 nm at a spectral resolution of 0.6 nm at 300 nm. Each spectrograph was equipped with 2048 element linear CCD array detector. The output from each of the four CCDs was digitized by an analog to digital convertor (ADC) circuit. The plasma light in the entire spectral range is thus recorded simultaneously for each laser pulse. The acquisition of the spectrum can be done at any fixed time delay between plasma ignition and recording of the emission spectrum. The average spectra resulting from the accumulation of 30 laser shots were used for analysis in the present work.
2.2. Sample Preparation and Analysis
Four vanadium oxide samples, namely, VO, V2O3, VO2, and V2O5 (99.9% pure) were procured from Alfa Aeser, India. The oxide samples were homogeneously mixed with high purity of 99.5% boric acid powder (S.D. Fine-Chem. Ltd., India) used as a binder, for 15 min by blending and grinding thoroughly to obtain homogeneous mixture. Mixed powder samples were then pelletized to 3 cm diameter pellets by applying a pressure of 2 × 10⁹ Pa for 3 min. The amount of oxide in each sample was adjusted in such a way that the amount of elemental vanadium remained constant (±0.15%) in each sample pellet. Table 1 gives the compositional data of the samples prepared and used in this work.
| Sample | Oxide taken | Amount taken (gm) | Total amount (gm) | % of V | |
|---|---|---|---|---|---|
| Oxide | H3BO3 | ||||
| 1 | VO | 0.6543 | 1.0065 | 1.661 | 49.79 |
| 2 | V2O3 | 0.7356 | 0.9995 | 1.735 | 50.00 |
| 3 | VO2 | 0.8134 | 1.0037 | 1.817 | 49.96 |
| 4 | V2O5 | 0.8913 | 1.0027 | 1.894 | 49.93 |
3. Results and Discussion
3.1. The Intensity Profile
Emission spectra of the different VOs were recorded at different acquisition delay times (0–8 μs) and different laser energies (50, 70, and 95 mJ). Typical emission spectra at delay times of 500 ns and 5 μs at a laser energy of 70 mJ are shown in Figure 2. It is seen that at the early stages of the plasma evolution; that is, at short acquisition delay times, the continuum emission is high, due to mechanisms involving free-free transition of electrons and radiative recombination, and therefore, the spectral information about atomic and ionic species will be inaccurate at short delay times.
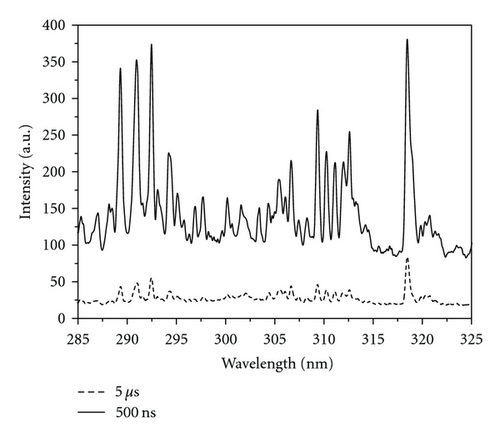
Figure 3 shows the temporal emission behavior, that is, the normalized intensity monitored against acquisition delay observed for different vanadium oxides at V(I) 318.54 nm and V(II) 292.464 nm at 70 mJ. Normalization was done with respect to the total integrated intensity of the particular spectrograph used to monitor that particular emission line. For example, V(I) 318.54 nm and V(II) 292.464 nm emission lines were normalized with the total integrated intensity of the spectrograph-I, since this was used for monitoring of emission lines from 180–330 nm. The existence of a number of humps is attributed to the possible different effects of the various physical processes governing the plasma behavior. It is seen that for V2O3, VO2, and V2O5, the atomic line ((V(I) 318.54 nm) shows a sharp decrease of emission intensity after the gate delay of 4-5 μs, in sharp contrast of ~1.5 μs for VO. Ionic line shows more or less similar decay patterns of intensities from different oxides with faster decay than that of atomic line due to the recombination processes of electrons and ions. The analysis carried out at 50 and 95 mJ also exhibited the similar temporal profile except for differences in intensities magnitude which showed the order 95 mJ > 70 mJ > 50 mJ. In case of ionic line, there was no difference in the line intensity at the different laser energies for delay times >5 μs in view of their faster decay.
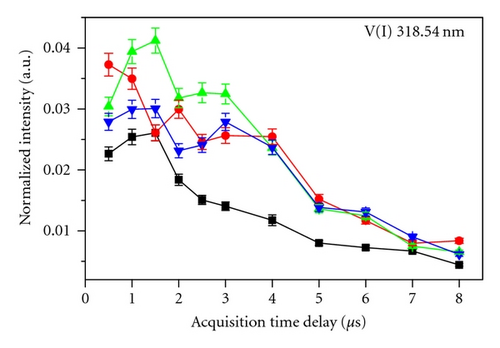
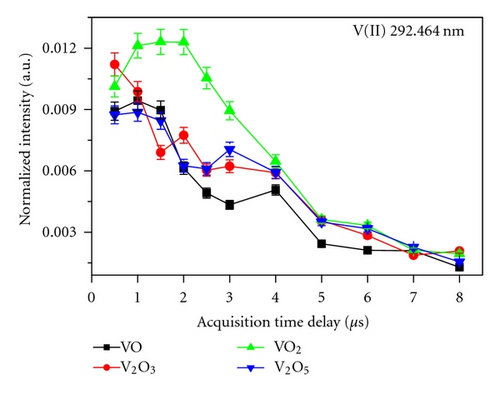
Nasrazadani and Namduri [7] reported that Fe present in a different matrix having similar composition but different phase will show different temporal decay pattern. The four VOs selected for this study also have different phases, that is, cubic for VO, rhombohedral for V2O3, tetrahedral for VO2, and orthorhombic for V2O5. The different patterns observed in the emission lines in different VOs used in the present study also indicate the effect of phase difference among the samples. The ionic and atomic temporal decay profiles were also found to be different for different VOs. In addition, the photo-induced nonlinear optical effects [16], which are particularly sensitive to the oxides, could also be responsible for these differences.
3.2. Plasma Temperature
By plotting the left side of (5) against the upper level energy (Boltzmann plot), a straight line is expected, whose slope yields the Te. For high accuracy, the range of upper level energies of the so-called Boltzmann plot should be as large as possible [17]. The emission intensities of nine emission lines of vanadium from VOs LIP were used for constructing the Boltzmann plot. Table 2 lists the spectral lines used and their respective spectroscopic constants. The plasma temperatures are estimated within 10% uncertainty mainly due to uncertainties in the transition probabilities for the lines and the measurement of the integrated line intensities used.
| Species | Wavelength (nm) | Transition coefficient (Aij) (108 s−1) | Energy level | gj | gi | |
|---|---|---|---|---|---|---|
| Lower (Ej)(cm−1) | Upper (Ei)(cm−1) | |||||
| V(II) | 292.464 | 1.2 | 2968.22 | 37150.51 | 9 | 9 |
| V(I) | 305.633 | 1.3 | 0 | 32738.13 | 4 | 4 |
| V(I) | 306.638 | 2.1 | 552.96 | 33155.30 | 10 | 10 |
| V(I) | 318.540 | 2.7 | 552.96 | 31937.27 | 10 | 12 |
| V(II) | 366.940 | 0.13 | 20363.23 | 47607.79 | 13 | 13 |
| V(I) | 370.358 | 0.92 | 2424.78 | 29418.07 | 10 | 8 |
| V(I) | 384.075 | 0.55 | 323.46 | 26352.65 | 8 | 6 |
| V(II) | 395.197 | 0.11 | 11908.27 | 37204.98 | 5 | 7 |
| V(I) | 440.764 | 0.44 | 2311.36 | 24992.88 | 8 | 8 |
- (i)
There is no significant difference in Te values obtained for different VOs at constant td within the uncertainty of the calculation methodology.
- (ii)
For all the four VOs, the rate of decay in plasma temperature (i.e., dTe/dtd) is almost constant and hence can be assumed to be independent of matrix.
- (iii)
At a particular delay, with the increase of laser energy, Te increases. This is due to the fact that kinetic energy gained by the electrons increases as the deposited laser energy increases.
- (iv)
The temporal profile of Te also shows faster decay with increasing laser energy. This is expected, as higher Te means faster expansion of plasma leading to faster decrease of plasma temperature.
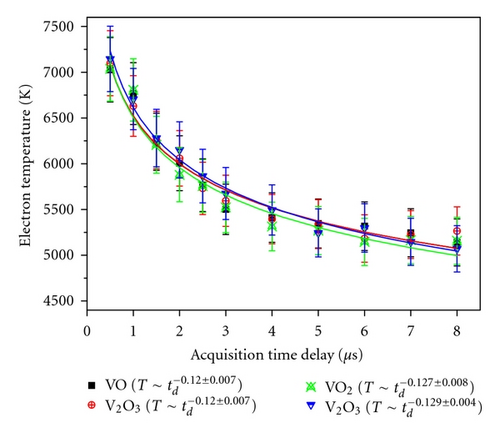
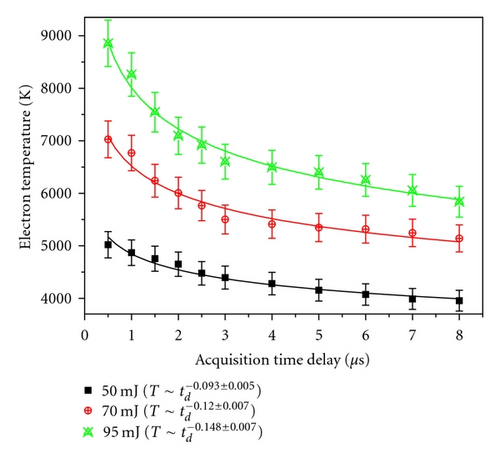
It may be noted that the space uniformity of the laser beam is not very crucial parameter in the present studies, since these plasma profiles (decay of Te and Ne) of different vanadium oxides have been recorded under the identical conditions.
3.3. Electron Density
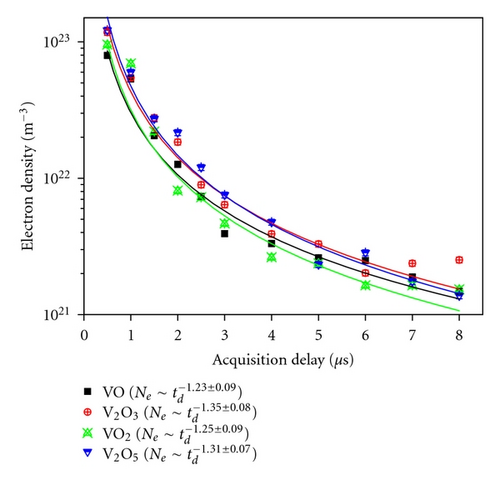
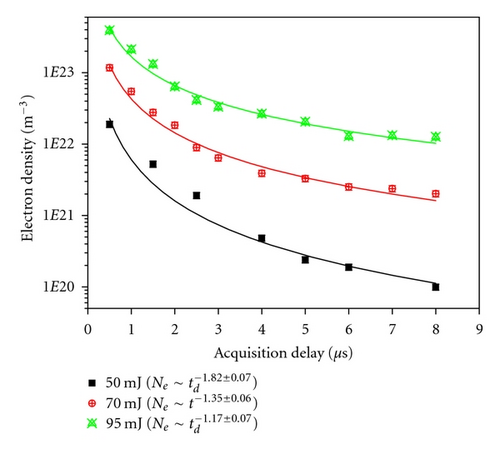
The Ne as a function of td was found to have the same trend of temporal profile in all the VOs, that is, Ne decreasing with the increase of td following a power law. Figure 6 shows a typical temporal profile of Ne with td at 70 mJ for all the VOs. Ne decreases fast in the early stage of plasma formation, but after ~3 μs, there is no appreciable decrease. Ne for V2O3 decreased from ~1 × 10²³ m−3 to ~6 × 10²¹ m−3 during of 0.5 to 3 μs, and this value further reduced to ~1 × 10²¹ m−3 at 8 μs. There is no noticeable difference in the Ne among the samples. Similar temporal profiles were also obtained at 50 mJ and 95 mJ laser energies except for different magnitudes of Ne. Ne as a function of td was fitted with the power law similar to that for Te. The power law fittings for a laser energy of 70 mJ for VO , V2O3 , VO2 , and V2O5 are also shown in Figure 6. It can be seen that similar to Te, at a particular td, the rate of decay of Ne is independent of type of oxide similar to the Te temporal followup. The dependency of rate of decay with laser energy was examined for V2O3 and was found to be faster with reduction in laser energy incident (Figure 7). This is the reverse of that observed for Te. With increase of laser energy, the amount of material ablated increases. The Ne can be sustained for a longer time; hence, the rate of decay of Ne decreases with increasing ablation. It is interesting to note that the rate of decay of Ne is much faster than that of Te for all the vanadium oxides. This clearly emphasizes the fact that initially, the Ne is very high, and radiative emission will be a dominating emitting source. Therefore, to obtain good elemental signal, suitable acquisition delay must be employed in LIBS.
4. Conclusion
Using fundamental Nd : YAG laser, LIPs of four different vanadium oxides were investigated. The temporal profiles of ionic or atomic lines have different patterns for different oxides but main LIP parameters, that is, Te and Ne, do not show any appreciable differences in their temporal profiles. Te and Ne were measured at different acquisition time delays for all the four VOs. It was found that in all VOs, the rate of decay of both Te and Ne follows a power law and is constant at a particular plasma temperature. The rate of decay of Ne is much faster than that of Te in the initial period, that is, 0–3 μs region. With the increase of laser energy, rate of decay of Te increases for all the VOs, but for Ne, the reverse trend is observed. The studies reported in this work are useful to optimize different parameters, for example, laser energy, acquisition delay, and so forth, for LIBS analysis of high-purity vanadium-based materials.
Acknowledgment
The authors are thankful to Dr. V. Venugopal, Director, Radiochemistry and Isotope Group, B.A.R.C., for his constant support and encouragement in LIBS work.


