Using Individual Spectra Simulation for the Study of Pole Figures Errors
Abstract
Crystallographic texture is described by pole figures. In this paper, we continue to study experimental pole figure errors. In other words it can be named pole figure measurement errors. These errors are connected with the experimental procedure and do not depend on any further computations. In our previous works it was shown that the qualitative behaviour of pole figure measurement errors is similar to peak width determination errors. To check this conclusion a set of diffraction spectra were measured for Mg + 4.5%Al + 1%Zn sample on the spectrometer for quantitative texture analysis (SKAT) at FLNP, JINR, Dubna. Then we simulated the individual spectra and used these spectra for the pole figure extraction and the pole figure error determination. Such simulation enabled to confirm conclusions concerning the main role of the peak width determination error in the pole figure error. Additionally, we simulated individual spectra using model pole figures and extracted pole figures and pole figures errors from those spectra. For this case we also confirmed the same qualitative behaviour of pole figure measurement errors and peak width determination errors. The model pole figures were calculated on the basis of normal distributions.
1. Introduction
The neutron diffraction experiment is one of the methods for obtaining information about crystallographic texture. The spectrometer for quantitative texture analysis (SKAT) has been successfully operated at the 7A channel of IBR-2 reactor (FLNP, JINR, Dubna) since 1997 [1]. Measurements of spectra are provided using time-of-flight technique at pulsed reactor. The aim of texture neutron diffraction experiment is to determine the orientations of crystallites in a polycrystal. Neutron spectra are measured at SKAT to be used for pole figures extraction. We are interested in the integral intensity of individual peaks for the pole figure determination. 1368 spectra have to be processed simultaneously for complete pole figure. That corresponds to a 5-degree grid for the polar angle and azimuth as well (19 × 72).
Pole figures (PFs) contain experimental information about crystallographic texture. The requirements for the accuracy of PFs are growing in correlation with the complication of the investigated problems. Besides, it is necessary to take accurately the experimental errors into account for developing new instruments for quantitative texture analysis. Thus it is very important to study sources of the PF’s measurement errors to look after their minimization. A set of papers [2–5] are devoted to this theme. In these works the main types of PF’s measurement errors are analyzed. They are approximation errors connected to the instrument resolution and statistical errors connected to finite intensity of neutron sources and finite number of grains in measured textured samples. The study how counting statistics and exposure time influence the pole figure errors is described in [3], the influence of grain statistics is studied in [5] as well. It is necessary to underline that pole figures measurement errors have an integral character, that is, they include all factors like experimental layout, neutron statistics, grain statistics, external noise, and so forth. The local peak fit approach gives us a tool for pole figure intensity and pole figure measurement errors determination. This approach is described in our previous works [6, 7]. Pole figures measurement errors do not depend on ODF reconstruction methods and are not connected with any further computations with pole figures, so they are of “pure" experimental kind. In our previous investigations [6, 7] it was established that the qualitative distribution of PF measurement errors is similar to the distribution of peak width determination errors. Thus, the errors of determination of the peak width play a determining role in the PF measurement errors. This statement is the starting point for the present work. To check this conclusion spectra simulations have been done. The purpose of such simulations is to be convinced that such behaviour of pole figure errors is a property not only of the spectrometer SKAT. It can be checked up by means of spectra simulations because the errors entered into the spectra at the simulations are not connected with a special measurement process.
2. Fundamentals
Denoting by dV volume of all crystallites in a sample which possesses an orientation g within orientation region dg, and by V the total sample volume, then the orientation distribution function (ODF) f(g) is defined by [8]
All rotations form the rotation group SO(3). The ODF is defined on the rotation group SO(3). As can be seen from definition the ODF is a normalized function:
Let be the unit vector of a direction in the “sample coordinate system," the unit vector of a direction described in the “crystal coordinate system" of a single crystal, then d is the volume fraction of the sample for which the crystallographic direction coincides with in . Thus, the pole figure is a function conformed to condition [8]:
Equation (5) is the mathematical formulation of the main problem of quantitative texture analysis [10]. The notation means that a rotation g has corresponding Euler angles as two spherical ones of vector and the third Euler angle is 0. (It is assumed that the first angle of rotation is about Z axis, the second one is about the new position of Y′ and the last is about newer position of Z′′.) Vector can be considered as a properly rotated vector (001) and vector could be considered as well as properly rotated vector (001). So the rotation g that connects vectors and could be expressed from the equation or . Equation (5) utilizes the fact that pole figure describes the relative volume with and ODF describes the relative volume of grains having orientation g. So, to obtain the relative volume for which one needs to integrate ODF over φ, which is exactly expressed in (5).
The main problem of quantitative texture analysis is to reconstruct the ODF f(g) from a finite number of measured PFs . In [9, 10] it was shown that this is an ill-posed problem because it has no unique solution. To overcome this problem several methods were developed [11–18]. The texture component method approximates the ODF by components of standard distributions [15–18]. In [19, 20] it was shown that (5) is the totally geodesic Radon transform on SO(3) and how this mathematical transform can be used in texture analysis.
In what follows for simulations we used circular normal distributions satisfying the central limit theorem on the rotation group SO(3) [18]. These distributions can also be obtained using approach of the Brownian motion on the rotation group SO(3) and sphere S2 [21]. In case of axial texture the expressions for ODF components and PF components are given by the formulas [22]:
If the material has the crystal symmetry described by the point group and a sample symmetry of the point group , where , are their sub-groups of the rotation group SO(3) then the PFs and the ODFs are conformed to the symmetry conditions:
The procedure used for peak processing can be called local peak fit in our case. We approximate each individual peak in contrast to the Rietveld texture analysis (RITA) concept widely used for neutron time-of-flight data treatment [25–27]. The RITA procedure is used, for example, to extract texture information from time-of-flight neutron spectra obtained by the diffractometer HIPPO (Los Alamos Neutron Science Centre) [27, 28]. In this case up to 240 spectra are simultaneously processed. The RITA concept was applied for processing data from the NSHR Dubna spectrometer too [29, 30]. In this case the spectrometer recorded 601 spectra, and in [29] only the half of the measured spectra (301) was used for processing including overlapped peaks and regions with heavy overlapping. In our case the local peak fit can be a reasonable procedure for data processing namely because of the huge number of data sets (1368 spectra).
It should be underlined that the local peak fit concept can be used for processing overlapped peaks typical for low crystal symmetries.
Texture measurements were carried out on the SKAT spectrometer for a set of Mg+4.5%Al+1%Zn samples. The PFs measurement errors were determined by the proposed method. It turned out that the qualitative behaviour of the pole figure measurement errors is similar to that of peak width parameter. To check this conclusion we simulated the individual spectra and used these spectra for the pole figure extraction and the pole figure measurement errors determination. Additionally, we simulated the individual spectra on the basis of model PFs.
3. Spectra Simulation
For our measurements the local part of the spectrum could successfully be approximated by a linear background and a bell-shaped function of the form [31]:
Here A0 describes the peak amplitude, t0 is for the peak position and σ1, σ2 describe the peak half-width from the left and right side of the peak maximum A0, respectively. It is necessary to notice that the exact relationship between half-width at half maximum (HWHM) and the standard deviation of the normal distribution is the following: . We consider the standard deviations σ1, σ2 as “peak half-width" from the left and right side of the peak maximum respectively. Such assumption will not influence on the main conclusions drawn on the basis of simulation. For shortness we name σ1, σ2 as peak half-width.
The input values for the spectra simulation were the experimental pole figure intensity , the peak position and the peak widths , where i the peaks numbers. The peak amplitude was obtained by the expression [6, 7]:
The values for , were taken as the average over the half-width values determined from the j = 1, N = 1368 experimental spectra: , . So we can consider , as “unknown" input values.
Then our simulation was done in accordance to (12). The PFs are measured on the SKAT spectrometer using 19 detectors that register the neutron flux simultaneously for one sample position. Then the sample is rotated by 5-degree steps. 19*72 = 1368 spectra are measured in total that corresponds to a 5 by 5 degree grid on the complete PF. That is why 1368 individual spectra were simulated for the Mg sample. Such a procedure was carried out for the several PFs that correspond to non-overlapped peaks. The background of the simulated spectra was approximated by the linear function:
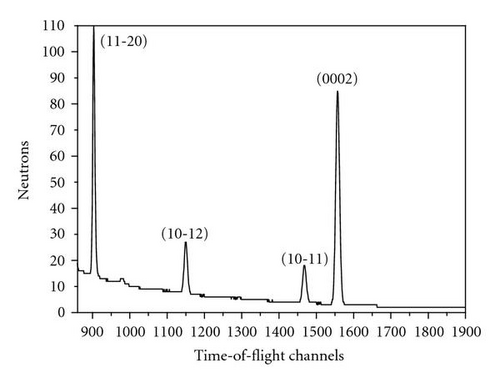
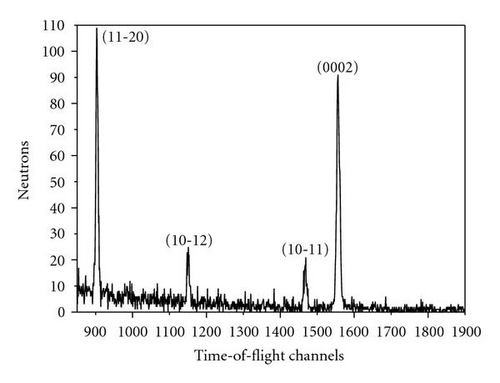
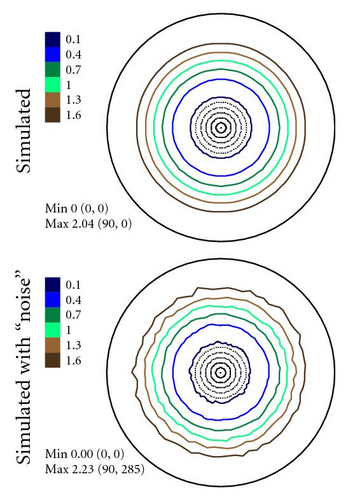
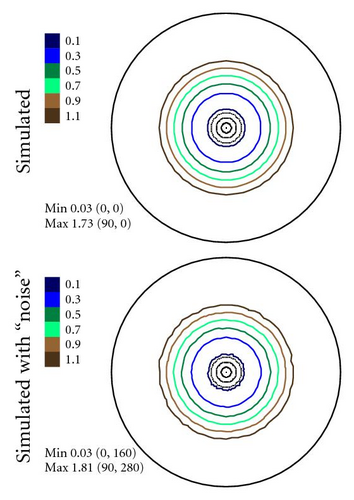
Then we repeated the afore-described procedure to simulate a set of spectra on the basis of model PFs. The model PFs were calculated using circular normal distributions. As far as our sample has an axial texture with the symmetry axis [001] we used (7) to simulate PFs. The simulated PFs are presented in Figure 7. They were derived for one texture component with g0 = {0°, 0°, 0°}, D = 0.0823 and no random background (phon). The width parameter D corresponds to the real half width at half maximum HWHM ≈ 27.19° of the texture component. The HWHM-value for the Gaussian texture component with a normal distribution (6) was obtained numerically. Table 1 presents the connection between parameter D and HWHM of a normal texture component for some practical cases. The parameter l up to L = 50 was used to simulate pole figures according to (7). For the Mg sample we took hexagonal crystal symmetry into account in (7) supposing triclinic sample symmetry. It is needed to underline once more here that we consider only the pole figure measurement errors connected with the experimental procedure. That is why we do not investigate the influence of series truncation errors neglible for L = 50 in our case.
| HWHM | 0.5° | 1° | 3° | 5° | 10° | 15° | 20° | 27.19° |
|---|---|---|---|---|---|---|---|---|
| D | 3 × 10⁻⁵ | 1 × 10⁻⁴ | 9 × 10⁻⁴ | 0.0027 | 0.0110 | 0.0248 | 0.0443 | 0.0823 |
| HWHM | 30° | 40° | 50° | 60° | 65° | 70° | 80° | 90° |
| D | 0.1005 | 0.1811 | 0.2879 | 0.4237 | 0.5034 | 0.5922 | 0.7983 | 1.0488 |
4. Results and Discussion
The simulated set of 1368 spectra for the Mg sample was processed using a spectra fit procedure described in what follows taking into account the peak shape given by (12). On the given part of the spectrum we found the best approximation of the experimental data (intensity values in time-of-flight channels) by the calculated function which is the sum of the model peak components and linear background. We use the following approach for determining pole figure values and their errors in case of small peaks. If less than 16 points (y-coordinate of each point is counts of neutrons in a time channel) in a spectrum within the region of a specific peak not lying above background value, we assume that no peak is present and assign zero to pole intensity and 100% to a corresponding relative error. The typical (for a powder sample) number of points lying in the peak region above the background value is 30.
The fitting procedure was done by minimization of the module of the difference between the experimental data I and values of the approximating function I(P) (12):
During the spectra processing for each of the 1368 = 19*72 spectra and for each specific peak four parameters with uncertainties were determined. So the pole figures themselves, the measurement errors of PFs and the peak half-width errors on the pole spheres were obtained. At this we used the formulas:
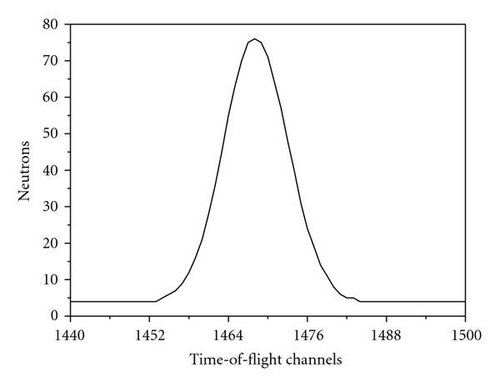
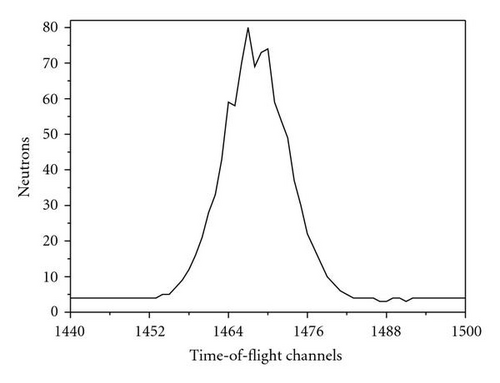
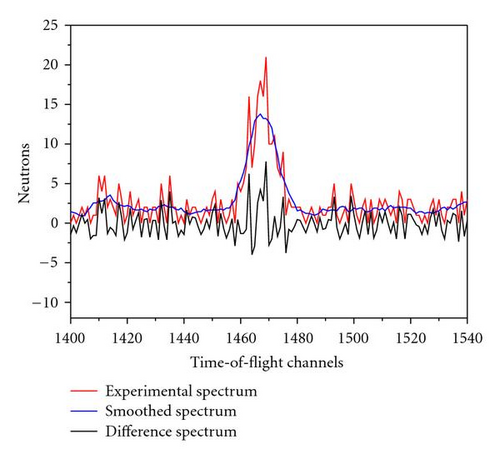
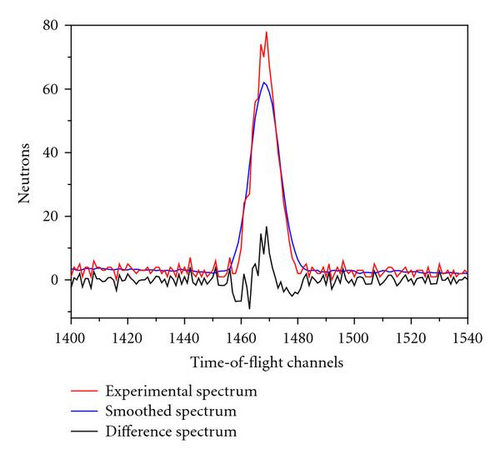
The Pfs were obtained using a preliminary spectra smoothing, that is, the spectra were smoothed by the Savitzky-Golay procedure [35] before the fit procedure described earlier. The smoothing was done by the specific moving average over six values. Details of the smoothing procedure are given in [35, Section 14.8]. Figure 3 illustrates the application of the smoothing procedure for a “good” and a “bad” peak. We consider a peak as a good one if the signal-to-background ratio is about or larger than 10.
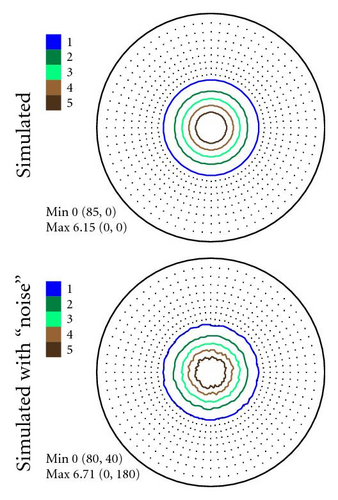
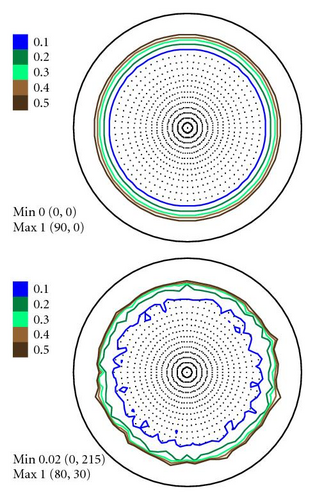
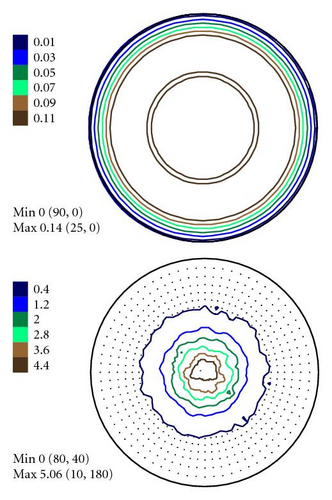
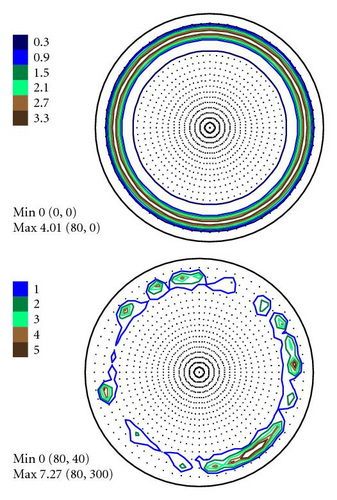
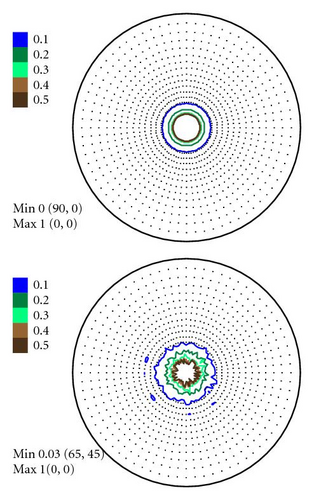
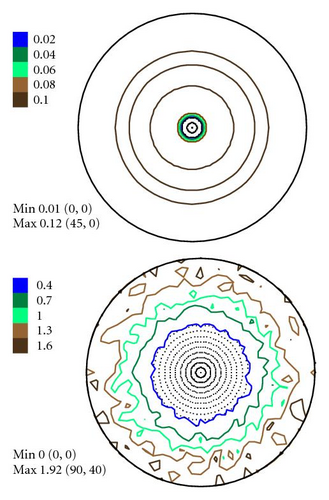
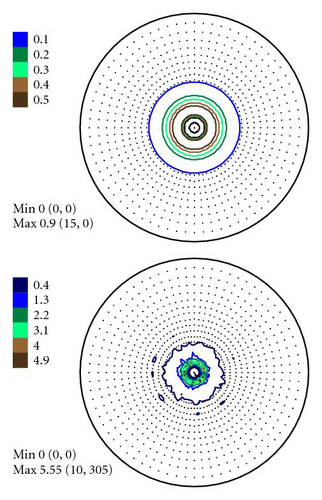
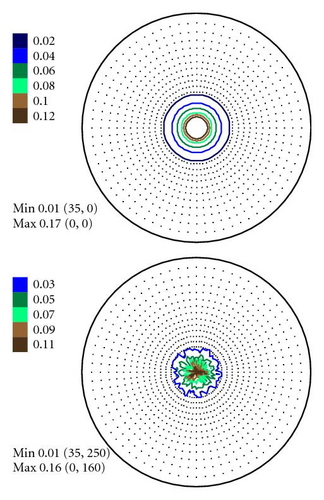
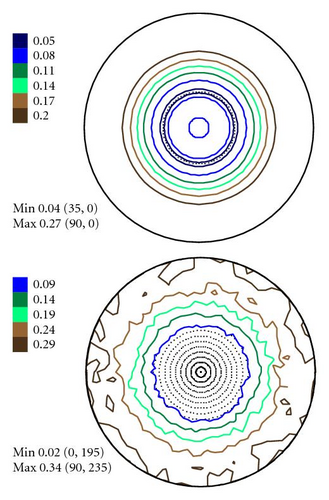
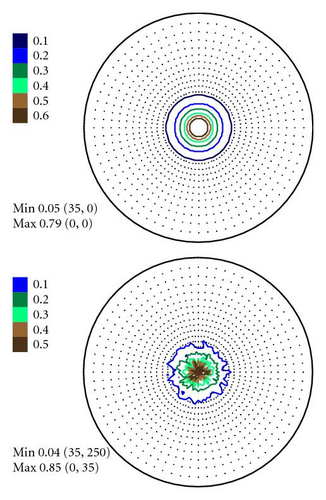
In Figures 4–6 the experimental PFs are compared with those extracted from spectra simulated without and with simulated errors. The experimental pole figures errors were determined according to (18). The peak amplitude errors ΔA0 and the peak half-width determination errors are compared with those obtained from simulated spectra.
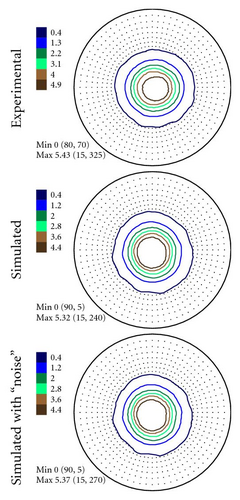
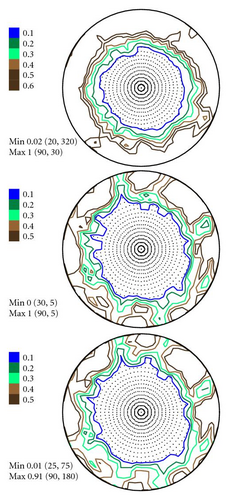
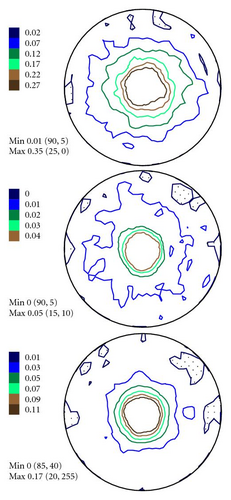
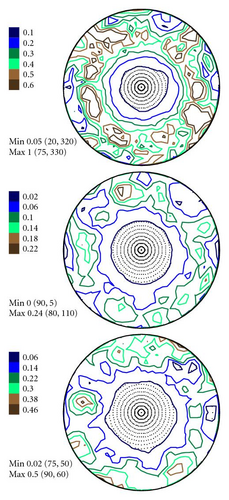
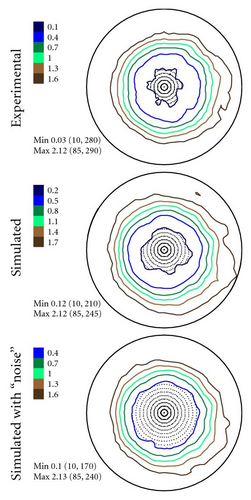
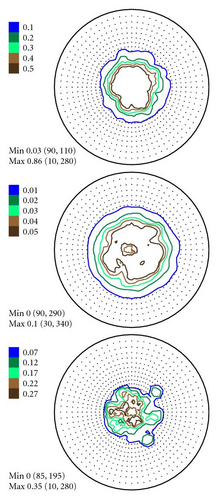
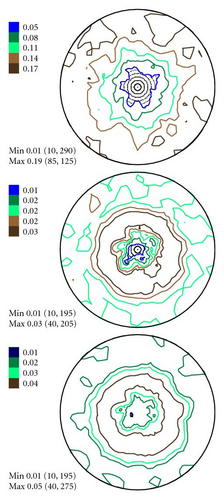
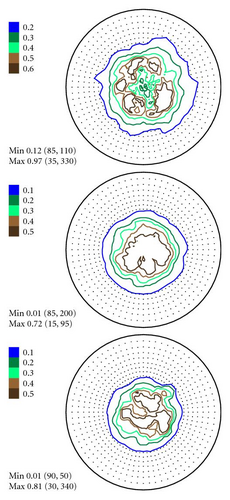
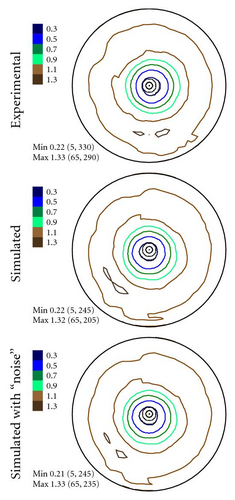
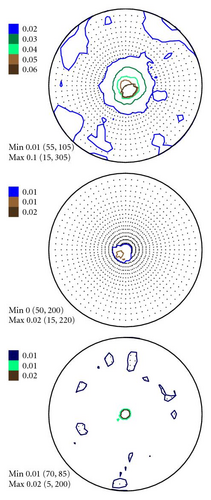
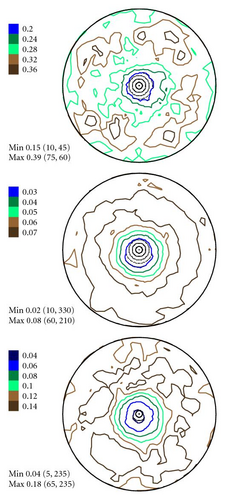
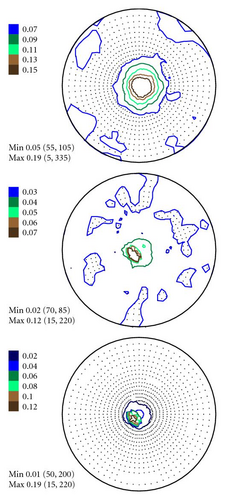
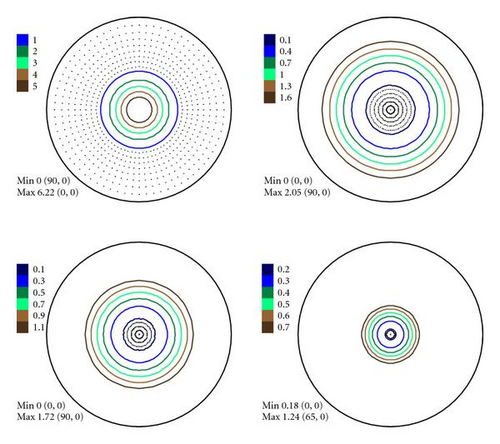
The experimental PFs presented in Figures 4(a)–6(a) were extracted from smoothed by the Savitzky-Golay procedure spectra. The presented pole figures and the errors have been smoothed according to the smoothing algorithm [36]. The smoothing of pole figures leads to an increase of the width-parameter D which describes the dispersion around the maximum of the normal distribution (7). Such smoothing allows paying more attention to the general behaviour of pole figures or functions on a sphere instead of fine details. It is appeared to be that the higher PF values the smaller error and on the contrary the smaller PF values the lager errors. This is in accordance with the knowledge of common spectrum analysis determining the parameters of peak-like distribution [37]. One can see from Figures 4–6 that the qualitative distributions of pole figures errors are very similar to the distributions of peak half-width determination errors. The character of the peak amplitude error distributions is different from the distributions of pole figure errors. That is true for the experimental PFs and for PFs simulated without “noise” or with “noise” as well. Such results we obtained for the (0002), (), () PFs. The statement is also confirmed by the spectra simulation carried out on the basis of simulated PFs (see Figures 8–10). So the conclusion about the main role of peak half-width determination error is drawn on the basis of the comparison of the errors distributions. At a first sight it seems that the conclusion concerning the dependence of the pole figure errors on the peak width errors directly follows from (17), (18) and in this case our conclusion is trivial and does not need experimental/empirical verification. However, (17), (18) are true only if (12) describing the peak form is adequate for our spectra. If a peak needs to be described using another form, then (17) and (18) are not necessary to be valid or vice versa. If after the treatment of our experimental and simulated spectra we were able to confirm our general conclusion then this is also a confirmation that the formula for the peak shape is appropriate.
5. Summary
The analysis of simulated spectra allowed us to confirm the main influence of the peak width determination error on the pole figure error. This conclusion is drawn on the basis of comparison of errors distributions. So we can state that a decrease of the pole figure errors can be reached by reducing of the peak width errors. One way to decrease the peak width error is to enlarge the peak width, but in this case the experimental resolution may be deteriorated. However, it can be done if the resolution in the diffraction spectrum is not so important (e.g., for texture investigations of samples with a sufficient number of isolated diffraction peaks). The deterioration of the resolution may increase the PF approximation error. However, in case of poorer collimation the statistical errors connected with the finite number of grains in a sample and with the finite number of counted neutrons will decrease. This will happen because the lower the collimation of the neutron beam the more intensity of scattered neutrons (neutron statistics) and the greater the number of grains in reflecting position (orientation statistics) we will get. So the question about the behaviour of the total PF error with deterioration of collimation is under consideration at present. Similar results can be expected for data collected with X-ray measurements using position sensitive detectors.
Acknowledgments
The present work is supported by INTAS Grant no. 03-51-6092 and RFBR (Russian Foundation for Basic Research) Grant no. 06-08-01193. The authors thank the anonymous referee, as well as Prof. S. Matthies and Prof. H. Schaeben for important remarks helping us to improve the manuscript.


