Historical Fragmentation in Atlantic Forest Explains the Diversification of a Clade of Mountaintop Bromeligenous Frogs (Leptodactylidae: Crossodactylodes)
Funding: This work was supported by Conselho Nacional de Desenvolvimento Científico e Tecnológico (CNPq PROTAX #441497/2020-9) and Fundação de Amparo à Pesquisa do Estado de Minas Gerais (FAPEMIG #APQ-03369-21). M.T.T.S. was supported by postdoctoral fellowships from CNPq (PROTAX #151193/2021-5) and the São Paulo Research Foundation (FAPESP #2021/06575-1, #2024/03528-0). C.B.O. thanks Coordenação de Aperfeiçoamento de Pessoal de Nível Superior for a postdoctoral fellowship (#88887.808115/2023-00). R.B.F. was supported by a postdoctoral fellowship from CNPq (#101860/2024-2). F.R.S. thanks CNPq (#406864/2022-5) and FAPEMIG (#APQ-04006-24) for research funding. P.C.A.G. thanks CNPq (PROTAX #441497/2020-9 and research fellowship #310901/2022-7). C.F.B.H. thanks CNPq for a research fellowship (#304713/2023-6) and FAPESP (#2021/10639-5) for financial support. R.F.M. thanks FAPEMIG (#APQ-00325-21) for research funding and CNPq for a research fellowship (#307488/2025-0).
ABSTRACT
The Atlantic Forest domain is a biodiversity hotspot with remarkable amphibian diversity, including over 700 species, 70% of which are endemic. Most of these endemic species have restricted geographic ranges, often confined to mountainous areas, as exemplified by the leptodactylid genus Crossodactylodes. These frogs are characterised by small body sizes, a bromeligenous habit and limited dispersal abilities, with species often restricted to their type localities. Previous studies have revealed geographically structured lineages within the genus, even when separated by short distances. Here, we focused on a clade of Crossodactylodes comprising three lineages from southeastern Brazil, inhabiting montane forest ‘islands’ distinct from surrounding lowland areas regarding vegetation structure and microclimate. We integrated genetic, geographic, morphometric and qualitative morphological data to assess species boundaries through species delimitation analyses and validation procedures. This integrative approach provided evidence supporting the recognition of one lineage as a distinct taxonomic entity, which we formally describe herein as Crossodactylodes alairi sp. nov. Additionally, we applied coalescent simulations and supervised machine-learning approaches to evaluate alternative diversification hypotheses. Our results provide strong support for fragmentation models, suggesting that divergences within the focal lineages were driven by climate-related habitat fragmentation during the Plio-Pleistocene. Given that these lineages inhabit a non-macrorefugium region of the Atlantic Forest, their evolutionary trajectories were likely shaped by survival in isolated microrefugia that offered stable and suitable microclimatic conditions amidst broader environmental changes.
1 Introduction
The Atlantic Forest (AF) domain hosts remarkable biodiversity and exceptionally high levels of endemism, establishing it as one of the world's richest biodiversity hotspots (Fonseca et al. 2004; Huais et al. 2025; Myers et al. 2000). Species richness and endemism are particularly pronounced across various taxonomic groups of plants and animals, with the highest levels occurring in topographically complex areas within the domain (Brown et al. 2020; Lima et al. 2020; Marques and Grelle 2021; Peres et al. 2020). Amphibians in the AF are particularly diverse, with over 700 species, approximately 70% of which are endemic. These endemic species represent roughly 6.6% of the world's amphibian richness (Figueiredo et al. 2021). A considerable proportion of these species exhibit restricted geographic ranges, often confined to mountainous areas within the AF (Haddad et al. 2013; Toledo et al. 2014; Villalobos et al. 2013).
Several factors have been proposed as potential explanations for the high species richness and endemism in the AF. These include the domain's environmental and landscape heterogeneity. Such variation is driven by differences in temperature, precipitation and topography across its extensive latitudinal, longitudinal and elevational range (Câmara 2003; Ribeiro et al. 2011; Rodríguez et al. 2015). Another key factor is the AF's dynamic evolutionary history. Cyclical connections and isolations with other South American forests (Ledo and Colli 2017; Sobral-Souza et al. 2015) and forest fragmentation during the Pleistocene (Carnaval and Moritz 2008; Carnaval et al. 2009; Martins 2011) likely promoted diversification. Pleistocene sea level drops possibly exposed the continental shelf, expanding surface area and enabling forest expansion, with potential effects on biotic distributions (Leite et al. 2016). Geological processes, including neotectonic activity and changes in river systems, likely generated physical barriers and contributed to lineage divergence (Amaro et al. 2012; DaSilva et al. 2015; Thomé et al. 2010). Moreover, species-specific life history traits, such as limited dispersal capacity and narrow thermal tolerance, likely play a role in promoting reproductive isolation and facilitating speciation (Polato et al. 2018; Wollenberg et al. 2011).
Amphibians are well-suited models for investigating patterns of diversification and endemism due to their generally limited dispersal abilities (Smith and Green 2005). Taxa with restricted geographic ranges, small body sizes and high habitat specialisation are particularly valuable for such studies because they tend to exhibit high levels of genetic structure and microendemism (Fusinatto et al. 2013; Thomé et al. 2020; Wollenberg et al. 2011). The leptodactylid anuran genus Crossodactylodes Cochran 1938, endemic to mountaintops within the AF and the campo rupestre (i.e., rupestrian grasslands; Miola et al. 2021) at elevations ranging from 770 to 2000 m above sea level (a.s.l.), exemplifies these traits. Species of Crossodactylodes are disjunctly distributed, often restricted to their type localities and surrounding areas. The genus is further characterised by small body sizes (snout-vent length < 20 mm) and a high degree of habitat specialisation, as its entire life cycle depends on bromeliads—e.g., for shelter, foraging, breeding and egg and tadpole development (Santos, Magalhães, Ferreira, et al. 2020; Santos, Magalhães, Lyra, et al. 2020). Adult movement between bromeliads is also limited, as observed in natural history studies (Barata et al. 2018; Ferreira et al. 2019). Additionally, molecular phylogenetic studies revealed geographically structured lineages within the genus, with even neighbouring populations forming deeply divergent clades (Santos, Magalhães, Ferreira, et al. 2020; Santos, Magalhães, Lyra, et al. 2020). These findings suggest underestimated species diversity, which was subsequently corroborated by recent species discoveries and descriptions (Ferreira et al. 2023; Santos et al. 2023).
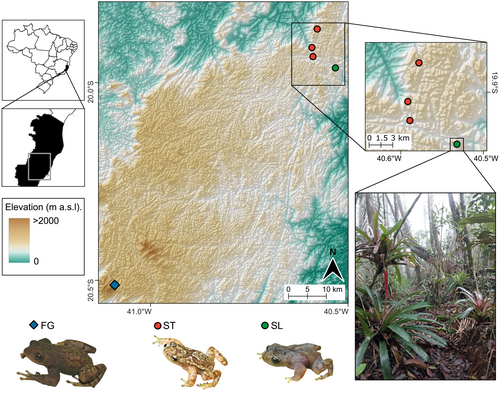
In this study, we investigate species boundaries and the potential processes underlying diversification within a clade of Crossodactylodes from the montane AF in the state of Espírito Santo, southeastern Brazil. This clade comprises three lineages: (1) Crossodactylodes izecksohni from the type locality in the municipality of Santa Teresa (hereafter referred to as ST), corresponding to C. izecksohni Lineage A of Santos, Magalhães, Ferreira, et al. (2020); (2) a lineage from the Estação Biológica de Santa Lúcia, also in Santa Teresa but located approximately 5 km from the type locality (hereafter referred to as SL), corresponding to C. izecksohni Lineage B of Santos, Magalhães, Ferreira, et al. (2020); and (3) a lineage from Parque Estadual do Forno Grande in the municipality of Castelo, approximately 85 km from Santa Teresa (hereafter referred to as FG; Figure 1). This latter lineage was previously identified as a putative new species, referred to as Crossodactylodes sp. 1 in Santos, Magalhães, Lyra, et al. (2020). While molecular phylogenetic analyses distinguished two deeply divergent lineages (SL and FG) relative to C. izecksohni from the type locality (Santos, Magalhães, Lyra, et al. 2020), these lineages have not yet been subjected to species validation methods (sensu Carstens et al. 2013) to confirm their taxonomic status. Validation is critical to establish robust species hypotheses and formalise species descriptions where applicable (Pante et al. 2015).
In addition to species delimitation, understanding the biogeographic processes driving speciation sheds light on the evolutionary history of regional biota. In the AF, diversification has been linked to several hypotheses (Peres et al. 2020), with the “river-barrier” (Ramos et al. 2019; Thomé et al. 2010, 2014) and “refugium” (Carnaval and Moritz 2008; Carnaval et al. 2009; Martins 2011) hypotheses receiving the strongest support for amphibians. In summary, the river-barrier hypothesis posits that the primary genetic breaks in the AF biota coincide with geographic barriers, such as river valleys (Thomé et al. 2014). Alternatively, the refugium hypothesis, supported by historical climate modelling and fossil pollen data (Carnaval and Moritz 2008), proposes that biota diversification is better explained by cyclical climatic fluctuations, with forest-adapted taxa persisting over time mainly in historically stable areas (macrorefuges). In this study, the focal lineages are distributed entirely south of the Doce River (Santos, Magalhães, Lyra, et al. 2020), a major geographic and climatic barrier within the domain (Carnaval and Moritz 2008; Carnaval et al. 2014; Thomé et al. 2014). Moreover, the absence of other major geographic features, such as river valleys or distinct mountain ranges, across their distributions makes the river-barrier hypothesis unlikely to explain the observed genetic structure. Nonetheless, the complex geological landscapes inhabited by the three lineages may conceal subtle geographic features (i.e., hidden barriers; Thomé et al. 2014) that could influence diversification.
The three lineages of Crossodactylodes occur in a region of the AF identified in previous studies as a non-macrorefugium, suggesting they were affected by cyclical climate fluctuations and fragmentation during the Plio-Pleistocene (Carnaval and Moritz 2008; Haffer 1997). Such fluctuations may have left genetic signatures temporally consistent with periods of forest expansion and contraction (Carnaval and Moritz 2008; Martins 2011). Current climatic constraints could further restrict the geographic ranges of species with narrow physiological tolerances in higher-elevation habitats (Navas 2002). Although the physiological tolerances of Crossodactylodes remain unknown, their limited geographic ranges (Santos, Magalhães, Ferreira, et al. 2020; Santos, Magalhães, Lyra, et al. 2020) suggest that the species and/or the bromeliads they depend on may have narrow climatic tolerances. Montane, cold-associated taxa in the AF, such as Crossodactylodes, may have persisted in microrefugia, retaining aspects of their diversity over time, although overall diversity was probably reduced due to drift and fragmentation (Carnaval et al. 2014). These microrefugia are small, favourable habitat patches where some species can persist outside their main distribution area in microenvironments buffered from adverse regional conditions, often with limited opportunities for genetic exchange among fragmented populations (Hampe and Jump 2011; Rull 2009). Consequently, microrefugia are typically characterised by strong isolation from migration and are heavily influenced by genetic drift, leading to high genetic structuring (Bai and Zhang 2015). Although microrefugia are often associated with the presence of a macrorefugium, they can also occur independently of a core area when the distribution of a taxonomic group contracts exclusively to these small patches (Hylander et al. 2015; Keppel et al. 2012).
This scenario appears to align with the areas inhabited by FG, SL and ST, which comprise small, isolated montane forest ‘islands’ situated far from the major AF macrorefugia (Carnaval and Moritz 2008; Carnaval et al. 2014). Although these lineages are not separated by large-scale features like mountain ranges or river valleys, they inhabit small, elevated patches that are geographically close but topographically isolated. These environments differ markedly from lowland forests in several ways, including lower temperatures, shorter canopies and a high density of epiphytic plants such as bromeliads, orchids and ferns (Figure 1), rendering them microclimatically and structurally distinct (Bruijnzeel 2005; Carlucci et al. 2021; Marcilio-Silva et al. 2017). Such characteristics are consistent with the hypothesis that the current allopatric distribution of these lineages stems from historical fragmentation processes.
Here, we test this historical fragmentation hypothesis by estimating probabilities for alternative demographic models using coalescent simulations. If the hypothesis is valid, we expect high levels of genetic structuring, no evidence of migration among lineages and divergence events linked to population size reductions potentially indicated by signatures of past bottlenecks. Additionally, we assessed species boundaries by integrating morphometric and qualitative characters, along with three mitochondrial and seven nuclear markers, into model-based taxonomy protocols. Based on combined evidence and comparative morphological analyses of all nominal species in the genus, we formally describe a new species closely related to C. izecksohni.
2 Materials and Methods
2.1 Taxon Sampling and Morphological Data Acquisition
Specimens used in the morphological and integrative analyses are housed in different Brazilian natural history collections. Institutional abbreviations follow Sabaj (2020), except for UFMG-AMP, which stands for Amphibian Collection of Centro de Coleções Taxonômicas, Universidade Federal de Minas Gerais, Belo Horizonte, Minas Gerais.
We analysed morphometric and discrete characters using a sample of 48 female specimens (37 from ST; five from SL; and six from FG) and 42 male specimens (31 from ST; six from SL; and seven from FG); Appendix S1. Morphometric characters follow Duellman (1970) for snout-vent length (SVL), head length (HL), head width (HW), eye diameter (ED), tibia length (TBL) and foot length (FL); Heyer et al. (1990) for hand length (HAL), thigh length (THL) and tarsal length (TAL); Napoli (2005) for eye-nostril distance (END), nostril to tip of snout distance (NSD), third finger disc diameter (3FD) and fourth toe disc diameter (4TD); Garcia et al. (2003) for distance between the anterior margins of eyes (AMD); Cei (1980) for internarial distance (IND); Duellman et al. (1997) for forearm length (FAL); and Greene and Funk (2009) for arm length (AL), arm width (AW) and forearm width (FAW). Specimens were photographed using a Leica M205 stereomicroscope, and high-resolution images were used to measure ED, END, NSD, IND, 3FD, 4TD and AMD using ImageTool v.3.0 (Wilcox et al. 2002). The other variables were measured with a digital calliper under a stereomicroscope. All measurements were taken by M.T.T. Santos to the nearest 0.01 mm, with bilateral variables measured on the left side of the body.
We removed the allometric effect of body size and multicollinearity from morphometric data to retain size-independent morphological traits and meet the assumption of variable independence for integrative delimitation and statistical analyses. For this, we firstly log-10 transformed the variables and applied the Lleonart et al. (2000) method, which consists of regressing all morphometric variables against the body size proxy, represented by the variable with the largest correlation with the first principal component [i.e., SVL for both males (R2 = 0.96) and females (R2 = 0.94)] of a principal component analysis (PCA). Regression residuals, representing data without the allometric size effect, were used for subsequent analyses. The PCA and linear regressions were performed using the package stats in R v.4.4.1 (R Core Team 2024). Thereafter, we conducted a variance inflation factors (VIF) analysis to remove multicollinearity between morphometric variables. For this, we used the package car v.3.1-0 (Fox and Weisberg 2019) in R, retaining only variables with a VIF < 5 (Akinwande et al. 2015). As a result, we excluded five variables from the final male dataset (TBL, THL, FAW, AW and AMD). For females, no variables were removed, as all had a VIF < 5.
Terminology for morphological discrete characters used in taxonomic description follows Duellman (1970), Heyer et al. (1990), Duellman and Lehr (2009) and Santos, Magalhães, Ferreira, et al. (2020). For qualitative and morphometric characters, only adult specimens were analysed. Sex was determined by the presence of secondary sexual characteristics in adult males (i.e., nuptial pads and forelimb hypertrophy) and mature oocytes in females, visible through the body's translucency. Description of colouration in life was based on field observations and photographs. For taxonomic comparisons, we examined type specimens of all described species of Crossodactylodes (Appendix S1).
2.2 Molecular Data Acquisition and Editing
We extracted genomic DNA from ethanol-preserved tissues using a standard phenol-chloroform protocol (Sambrook and Russel 2001). Our dataset included 21 samples (nine from ST; five from SL; and seven from FG), encompassing the known geographic ranges of the three lineages. We also incorporated sequences from congeneric species and one species of the sister genus Paratelmatobius (P. yepiranga) for analyses with a broader phylogenetic scope (see below). Our matrix included sequences of three mitochondrial DNA (mtDNA) and seven nuclear DNA (nDNA) markers. The mtDNA markers include fragments of the exonic genes cytochrome c oxidase subunit I (COI) and cytochrome b (cyt-b) and the non-coding heavy strand transcription unit 1 (H1: 12S and 16S rRNA genes, plus the intervening tRNAVal gene). The nDNA markers include exonic fragments of the proto-oncogene cellular myelocytomatosis (c-myc), proopiomelanocortin A (POMC), recombination-activating protein 1 (RAG-1), tensin 3 (TNS3), tyrosinase (TYR), plus the disulphide isomerase A6 precursor, intron 6 (DIA-6) and one anonymous fragment.
This last fragment, amplified with primers CRYB1Ls and CRYB2Ls (Dolman and Phillips 2004), typically produces a fragment of ~240 bp from the Beta-crystallin (β-cry) gene, but we instead obtained ~580 bp fragments. These sequences were homologous within our study group but not aligned with available β-cry sequences from GenBank. As the homology within our group was strong, we chose to retain these sequences, referring to them henceforward as the ‘anonymous fragment’ (AnFr). Additionally, we included sequences of the nDNA rhodopsin (Rhod) only for analyses with a broader phylogenetic scope, as this marker does not show variation within our focal group. We used sequences generated by Santos, Magalhães, Ferreira, et al. (2020) and Santos, Magalhães, Lyra, et al. (2020) and complemented them with newly acquired sequences of c-myc, DIA-6 and AnFr. GenBank accession numbers and voucher information are given in Table S1. The PCR and sequencing protocols and the employed primers are given in Table S2.
We purified PCR products using a 20% polyethylene glycol protocol (Sambrook and Russel 2001) and sequenced in both strands using fluorescent dye-labelled terminators (ABI Prism BigDye Terminators v1.1 cycle sequencing kit; Applied Biosystems) in a Sanger automated sequencer ABI 3130XL (Applied Biosystems). We checked for quality and assembled the chromatograms using SeqScape v.2.6 (Thermo Fisher Scientific Inc.).
We performed sequence alignments using the G-INS-i algorithm, except for H1, which was aligned with the E-INS-i algorithm, both implemented in MAFFT v.7.49 (Katoh and Standley 2013). We estimated haplotype phases for nDNA markers using PHASE v.2.1.1 (Stephens et al. 2001), with a threshold of posterior probability (PP) > 0.7 to accept the phases as solved. For this analysis, the inputs and outputs were interconverted using the SeqPHASE web tool (Flot 2010). Positions with unresolved phases were retained, while the most probable haplotype pair was chosen for PopART and Geneland analyses. For individuals with heterozygous indels in DIA6 and AnFr, haplotype phases were estimated using Indelligent v.1.2 (Dmitriev and Rakitov 2008).
2.3 Genetic Diversity and Species Delimitation Overview
To initially assess the sampled genetic diversity and visualise haplotype sharing among lineages, we constructed median-joining networks (Bandelt et al. 1999) for the different markers using PopART v.1.7 (Leigh and Bryant 2015) with default parameters. For the mtDNA markers, a single network was generated using the three concatenated fragments.
For species delimitation, we applied complementary approaches (Figure 2). The methods used are summarised below, and the Appendix S2 provides details on each analysis. First, we performed integrative discovery and validation methods (Carstens et al. 2013), combining different data types from the three lineages. This approach limits the parametric space in which models might incorrectly estimate the number of candidate species, mitigating the impact of assumption violations associated with the multi-species coalescent model used in the delimitation (Solís-Lemus et al. 2015). Due to sexual dimorphism in Crossodactylodes (Santos, Magalhães, Ferreira, et al. 2020), integrative analyses incorporating morphometric data were performed separately for male and female specimens.
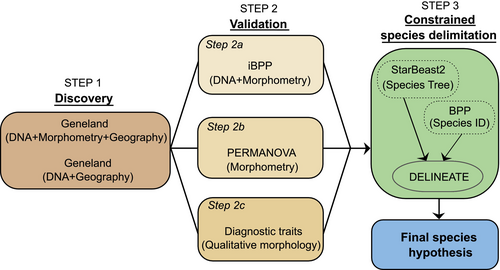
For the discovery step, we used the spatially explicit Bayesian clustering algorithm implemented in Geneland (Guillot et al. 2012) to identify the number and spatial distribution of population clusters. We performed analyses with genetic, morphometric and geographic data and ran a separate analysis without morphometric data to assess its influence on cluster estimation and admixture. For the integrative validation step, we applied the integrated Bayesian Phylogenetics and Phylogeography (iBPP) v.2.1.3 (Solís-Lemus et al. 2015), including genetic and morphometric data. This method allows for the simultaneous analysis of genetic and phenotypic data within a common Bayesian framework, improving the accuracy of species delimitation (Solís-Lemus et al. 2015). As an independent validation method, we conducted a permutational analysis of variance (PERMANOVA) to test for morphometric differences between the lineages identified by the integrative methods. Additionally, we performed a second independent validation by assessing congruence with external qualitative morphological characters (Figure 2). We considered the presence of diagnostic characters unique to each lineage as evidence of evolutionary independence (Padial et al. 2010).
However, the multi-species coalescent model often overestimates the number of candidate species, particularly in systems with high intraspecific genetic structure, because it does not differentiate between genetic variation within species and genetic differences that define species boundaries (Hillis 2019; Sukumaran and Knowles 2017; Sukumaran et al. 2021). Incorporating constraints, such as assigning known species or population identities to a subset of lineages, can address this issue by tailoring the speciation model to the specific system under study (Derkarabetian et al. 2022; Sukumaran et al. 2021). Thus, to complement the discovery and validation procedures, we employed a constrained species delimitation analysis using DELINEATE (Sukumaran et al. 2021). This method estimates a speciation dynamics parameter while incorporating prior knowledge about species boundaries in the system. The DELINEATE analysis requires an input tree and species identity assignments for a subset of lineages. We estimated the tree using StarBEAST2 v.15.13 (Ogilvie et al. 2017). To inform species assignments, we performed different analyses using Bayesian Phylogenetics and Phylogeography (BPP) v.4.8.0 (Flouri et al. 2018) and relied on current taxonomic knowledge of Crossodactylodes (Santos, Magalhães, Ferreira, et al. 2020). Further details are in Appendix S2. Our final species hypothesis reflects the congruence of all results (Figure 2).
2.4 Testing for Diversification Scenarios
To evaluate alternative diversification hypotheses, we employed coalescent simulations and supervised machine learning. Before testing putative demographic scenarios, we assessed the possibility of introgression using JML v.1.3.1 (Joly 2012) for fragments exhibiting haplotype sharing among lineages (i.e., POMC, RAG-1, TYR, c-myc and AnFr). The fragments TNS3 and DIA-6 were not used as they were entirely missing in one of the lineages (Table S1). JML conducts posterior predictive checks by utilising the posterior distribution of species tree parameters, such as population sizes and branch lengths, to simulate data and assess the goodness-of-fit of the observed data to a model that excludes migration. To generate the parameter distributions, we estimated a species tree using the *BEAST option in BEAST v.1.8.4 (Drummond et al. 2012), assuming strict clocks, relative dating, a Yule tree prior, and a piecewise constant size model, following Joly (2012, 2017). Optimal substitution models were estimated using jModelTest2 v.2.1.10 (Darriba et al. 2012). Among the models with ΔAICc < 4 (Crawley 2007), we selected the one with the highest weight that was also compatible with Seq-Gen v.1.3.4 (Rambaut and Grassly 1997; Table S3). Before running the JML analyses, we also assessed departures from neutrality using Tajima's D (Tajima 1989) as implemented in DNASP v.6.12.01 (Rozas et al. 2017) and tested for recombination with Φ-tests (Bruen et al. 2006) in SPLITSTREE v.4.14.8 (Huson and Bryant 2006). No evidence of deviation from neutrality or recombination was detected (Table S3). Analyses included three independent replicates of 5 × 10⁷ generations, 5 × 10⁴ thinning, and 10% burn-in. Species trees were combined using LogCombiner v.1.8.4 (Drummond et al. 2012), discarding 10% as burn-in. For the introgression test, JML simulated sequences for each nDNA fragment using a sample of 1.5 × 10⁵ species trees from *BEAST runs, applying a p-value threshold of 0.05.
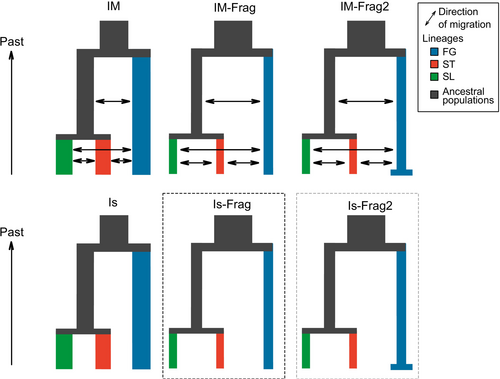
We then simulated six demographic models using the R package PipeMaster v.0.2.3 (Chan et al. 2014; Gehara et al. 2017), representing alternative scenarios based on two main hypotheses: divergence with isolation and divergence with fragmentation. Additionally, we included models with migration to provide an independent test from the JML analysis and assess whether migration plays a significant role in our study system. Under the isolation scenario, populations are expected to diverge without changes in population size. This was represented by the IM and IS models, simulating divergence with and without migration, respectively. In the fragmentation scenario, populations are expected to diverge alongside a reduction in population size due to decreased habitat availability. The IM-Frag and Is-Frag models were applied to simulate this scenario, with and without migration, respectively. Furthermore, because negative Tajima's D values were observed in the FG population, although not statistically significant, we decided to test for population expansion using our simulation-based approach. This accounts for uncertainty in sample size and the stochasticity of the coalescent process, while also incorporating the effects of other demographic parameters such as migration, ancestral population size and divergence time. To that end, we tested two additional fragmentation models that incorporated demographic change by including an additional effective population size parameter and a time parameter for the demographic shift in the FG population. These models are IM-Frag2, which includes both demographic change and migration, and Is-Frag2, which includes demographic change but does not include migration (Figure 3). In summary, the main difference between isolation and fragmentation models lies in how ancestral population sizes are treated. In the isolation models, the ancestral population size is a combination of the daughter population sizes. In contrast, the fragmentation models allow ancestral populations to vary in size, with the constraint that they must be larger than the daughter populations.
We simulated 100,000 datasets consisting of 56 summary statistics (average and variance of, per population and overall, number of segregating sites, nucleotide diversity, Watterson theta, number of haplotypes; pairwise and global Fst). We evaluated model fit using PCA to ensure that the observed data fell within the variance of the simulated data. The simulated datasets were then used to train a neural network (NN) algorithm for classification using Keras3 v.1.2.0 (Kalinowski et al. 2024). We used 80% of the data for training and 20% for testing. We built an NN including three hidden layers with 32 nodes, a Relu activation function, and an output layer with softmax activation. We used adam as the optimiser, sparse categorical crossentropy as the loss function, and accuracy as the evaluation metric. We trained the NN for 1000 epochs using batches of 1000 and a validation split of 0.1. After training, we used the NN to classify our observed data and calculate the softmax probability of the six models. We decided to use a NN instead of a standard ABC approach because it offers higher accuracy in model classification and lower error in parameter estimation (Fonseca et al. 2021; Gehara et al. 2020; Schrider and Kern 2018).
After selecting the model with the highest probability, we performed an NN regression to estimate model parameters. We trained an NN with the same architecture as above, except for an output layer with a single node and a linear activation function. For the regression we used the RMSprop optimiser, mean square error for loss and mean absolute percentage error and mean absolute error as evaluation metrics. To assess uncertainty, we ran the NN 100 times with different randomly sampled training datasets (80%). Our final results comprised a distribution of 100 regression estimates.
3 Results
3.1 Genetic Diversity and Integrative Discovery and Validation
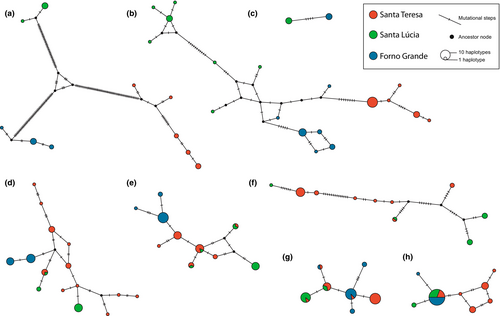
No haplotype sharing was observed among the lineages in mtDNA, AnFr and TNS3 (Figure 4A–C, respectively). Conversely, ST and SL shared haplotypes in POMC, TYR, DIA-6 and RAG-1 (Figure 4D–G, respectively). Additionally, haplotype sharing between FG and ST was detected in RAG-1 (Figure 4G). The most common haplotype of c-myc was shared by all three lineages (Figure 4H).
The Geneland analysis using the full dataset identified three clusters (k = 3) for both males and females, supported by 99.96% and 99.99% of the Markov chain Monte Carlo iterations, respectively. These clusters correspond to the lineages FG, SL and ST (Figures 5A and 6). The average membership probabilities for individuals belonging to their respective lineages were 70.19% (males) and 91.18% (females) for FG, 70.07% (males) and 91.97% (females) for SL, and 69.98% (males) and 78.70% (females) for ST. Specifically for females from ST, six individuals showed a higher probability of belonging to SL (81.88%) than to ST (11.75%). The analysis based solely on genetic and geographic data also recovered three clusters (k = 3) in 100% of sampling for all replicates (Figure 5B). The average membership probabilities for individuals belonging to their respective lineages were 100% for FG, 99.98% for SL and 97.93% for ST, indicating that the high admixture observed in the full dataset was primarily driven by morphometric data.

The iBPP analysis validated the delimitation of the three lineages as putative species, with PP = 1.0 for males and 0.999–1.0 for females, regardless of the combination of θ and τ priors used (Figure 6 and Table S4). The independent validation using PERMANOVA showed that morphometric differences among lineages were not explained by chance in either males or females (Fmale = 9.375, df = 43, p < 0.05; Ffemale = 7.345, df = 47, p < 0.05). All lineages were morphometrically distinct in both datasets (Table S5). The second independent validation based on external qualitative morphological traits supported the delimitation of ST (nominal C. izecksohni) and FG, but not SL (Figure 6). Specifically, there are diagnostic morphological characters that distinguish FG from ST and SL, but no trait supports the distinction between ST and SL (see the Section 4).
3.2 Constrained Species Delimitation
The species tree shows strong support for nearly all relationships. Divergence time estimates suggest a Pliocene origin for the clade comprising FG, SL and ST at approximately 3.41 Mya (95% HPD: 2.55–4.15). The divergence between SL and ST was estimated to have occurred in the Middle Pleistocene, around 340 thousand years ago (kya), with 95% HPD ranging from 170 to 512 kya (Figure 6).
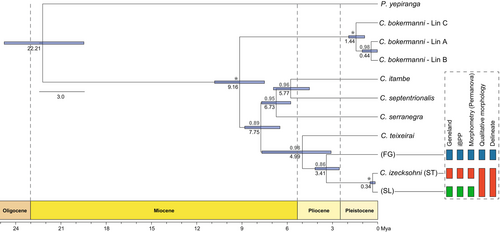
The BPP analyses using mtDNA + nDNA data validated 10 putative species within Crossodactylodes. However, there is some uncertainty regarding the divergence between lineages A and B of Crossodactylodes bokermanni (sensu Santos, Magalhães, Lyra, et al. 2020), with PP values ranging from 0.759 to 0.768, depending on the combinations of θ and τ priors (Table S6). When mtDNA data are excluded, the analyses support lineages A and B of C. bokermanni as a single putative species, with PP values ranging from 0.613 to 0.629 (Table S6). In summary, the results indicate uncertainty about the evolutionary independence of these lineages. Based on the BPP analyses with nDNA data and the absence of distinctive morphological traits separating these lineages, we classified them as conspecific. For the remaining lineages of Crossodactylodes, BPP analyses with nDNA only showed no changes in PP values.
The DELINEATE results supported FG and C. bokermanni Lin C (sensu Santos, Magalhães, Lyra, et al. 2020) as distinct species, with marginal constrained probabilities of 89.3% and 59.2%, respectively. On the other hand, SL was recovered as conspecific with respect to C. izecksohni from the type locality (ST), with a marginal constrained probability of conspecificity of 77.9% (Figure 6 and Figure S1).
3.2.1 Diversification Scenarios
Our JML analysis did not reject incomplete lineage sorting as an explanation for the haplotype sharing among FG, SL and ST (Table S3). That is, the data fit a model that excludes hybridisation or introgression.
Our simulated models show a good fit to the observed data, as indicated by the PCA analysis (Figure S2). The supervised machine-learning approach supports low softmax probabilities for both the isolation models and all models incorporating migration. Among the fragmentation models, the probabilities for Is-Frag and Is-Frag2 are relatively close, at 0.67 and 0.31, respectively, with an overall accuracy of 0.67. However, after removing the Is-Frag2 and IM-Frag2 models from consideration, the accuracy increased to 0.85, and the Is-Frag model exhibited a probability of 0.99.
We estimated model parameters for both the Is-Frag and Is-Frag2 models (Table 1 and Table S7). The results suggest divergence times of approximately 2.8 Mya for the common ancestor of SL, ST and FG and 383 kya for the divergence between SL and ST, similar to those estimated in the species tree analysis. ST shows the largest population size, followed by FG and SL (Table 1 and Table S7). Ancestral Ne estimates indicate an approximately 5-fold reduction in population size at the time of divergence (Figures S3 and S4).
| Ne ST | Ne SL | Ne FG | Ne MRCA ST + SL | Ne MRCA STSL + FG | tMRCA ST + SL (kya) | tMRCA STSL + FG (Mya) | |
|---|---|---|---|---|---|---|---|
| Min | 353,257 | 195,999 | 261,161 | 1,075,535 | 1,322,490 | 227.38 | 2.29 |
| 5% | 412,644 | 234,473 | 283,808 | 1,173,711 | 1,523,213 | 274.09 | 2.46 |
| Mean | 440,261 | 285,524 | 348,889 | 1,388,006 | 1,659,070 | 383.17 | 2.80 |
| Median | 440,406 | 281,332 | 346,940 | 1,408,528 | 1,666,788 | 372.26 | 2.78 |
| 95% | 474,241 | 349,349 | 403,775 | 1,547,110 | 1,769,647 | 522.67 | 3.24 |
| Max | 496,382 | 368,520 | 442,830 | 1,781,796 | 1,944,219 | 664.21 | 3.39 |
- Note: For the second-best supported model, see Table S7.
4 Taxonomic Account
Based on the species delimitation results, a set of diagnostic morphological traits, and following the unified species concept (de Queiroz 2007), we recognise the lineage FG as a new species and provide its name, diagnosis and comparisons with congeners below. A detailed description is provided in Appendix S1.
Crossodactylodes alairi sp. nov.
(Figures 7 and 8, Figure S5; Table S8; Appendix S1)
urn:lsid:zoobank.org:act: BED8959E-02DA-4D9E-BA06-5F9052F63CFF
Crossodactylodes bokermanni—Almeida et al. (2011, 557 [their appendix 1], in part);
Montesinos et al. (2012, 112 [their appendix 1]).
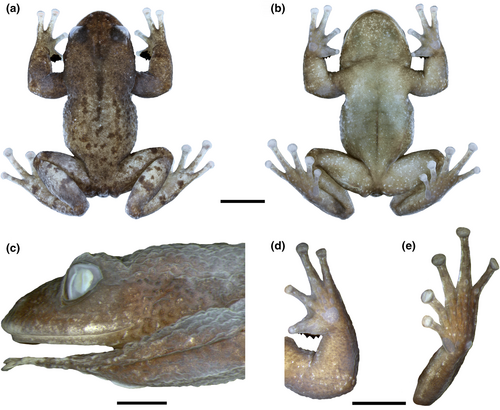
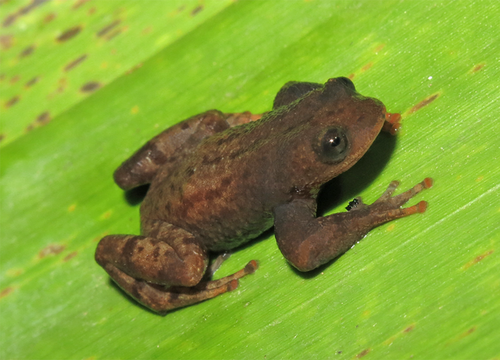
Holotype. An adult male (UFMG-AMP 14201), BRAZIL, state of Espírito Santo, municipality of Castelo, Parque Estadual do Forno Grande, “Mirante da Pedra Azul” trail, 20°30′43.15″ S, 41°5′28.33″ W, 1456 m a.s.l., 13 July 2013, M. T. T. Santos & P. H. Martins.
Paratypes. Four adult males (UFMG-AMP 14207, 14209–10, 14213), five adult females (UFMG-AMP 14202–04, 14208, 14211), and four juveniles (UFMG-AMP 14200, 14205–06, 14212), same data as the holotype. One adult male (UFMG-AMP 13768), one adult female (UFMG-AMP 13771), and two juveniles (UFMG-AMP 13772, 13775), same locality as holotype, 30–31 January 2013, M. T. T. Santos & B. H. B. Fehlberg.
Referred specimen. An adult male (MBML 16), BRAZIL, state of Espírito Santo, municipality of Castelo, “Forno Grande” (not georeferenced), 2 February 1973, unknown collector.
Etymology. The specific epithet honours Alair Tedesco, a park ranger who worked at Parque Estadual do Forno Grande for 27 years, dedicating much of his life to conserving the region. Even in retirement, he continues to collaborate with researchers and visitors, enthusiastically sharing his vast knowledge of the area. Suggested common names: Alair's bromeliad frog (English); rãzinha-de-bromélia-de-Alair (Portuguese).
Diagnosis. Crossodactylodes alairi is diagnosable from its congeners by the following combination of characters: (1) absence of vomerine odontophores; (2) adult males lacking vocal slits; (3) absence of dorsolateral fold; (4) inner metacarpal tubercle in adult males weakly widened; (5) discs of fingers II–IV slightly expanded; (6) hindlimbs lacking transverse bars; (7) skin on males dorsum coarsely granular; (8) SVL 17.2–18.6 mm (females) and 17.0–21.1 mm (males); (9) in life, iris uniformly dark brown or light brown with dark brown fine reticulations; (10) upper eyelid margin granular, with a pronounced tubercle in its medial region; (11) disc of Finger I rounded; (12) medial region of the upper lip not anteriorly projected.
Comparisons with congeners. Crossodactylodes alairi is distinguished from its congeners (characters in parentheses) by the absence of vomerine odontophores (presence in C. bokermanni, C. septentrionalis, C. serranegra and C. teixeirai); absence of vocal slits in adult males (presence in C. bokermanni and C. serranegra); absence of a dorsolateral fold (presence in C. bokermanni and C. teixeirai); and the inner metacarpal tubercle in adult males is weakly widened, that is, in ventral view it is not wider than the first finger (broadly widened, tubercle clearly wider than the first finger, in C. izecksohni and C. septentrionalis). Additionally, C. alairi can be distinguished from C. bokermanni by having discs of fingers II–IV slightly expanded (broadly expanded); absence of black transverse bars on hindlimbs (presence); and skin on male dorsum coarsely granular (shagreen). From C. izecksohni by having adults with larger size, females SVL 17.2–18.6 mm and males SVL 17.0–21.1 mm (females SVL 10.8–13.9 mm and males SVL 10.8–15.0 mm; Table S8); and iris in life uniformly dark brown or light brown with dark brown fine reticulations (yellowish with dark brown fine reticulations, interrupted by a brown horizontal bar at the pupil level). From C. pintoi, by having the upper eyelid margin granular, with a pronounced tubercle in its medial region (smooth, without a pronounced tubercle in its medial region); and females with a larger size, SVL 17.2–18.6 mm (15.9 mm). It also differs from C. septentrionalis by having the disc of Finger I rounded (acute) and from C. itambe by the absence of an anterior projection in the medial region of the upper lip (presence).
5 Discussion
Our integrative discovery and validation methods (i.e., Geneland and iBPP) support the hypothesis of three independently evolving lineages within our focal group, which would imply the need for a formal description of the lineages SL and FG, as ST corresponds to C. izecksohni from the type locality. However, the assessment of diagnostic morphological characters and the constrained species delimitation approach (i.e., DELINEATE) recovered ST + SL as a single lineage, distinct from FG (Figure 6). The application of different species delimitation methods often leads to discordant results, as each approach relies on distinct evolutionary or statistical models with varying assumptions (Carstens et al. 2013). Furthermore, delimited lineages do not necessarily correspond to valid species. In systems with pronounced genetic structure, these methods may not effectively distinguish intraspecific divergences from actual species boundaries (Firneno Jr. et al. 2021; Sukumaran and Knowles 2017). This is likely the case for the three lineages of Crossodactylodes, which are restricted to isolated montane forest ‘islands’ (Figure 1). Such isolation likely reflects historical distribution in microrefugia, resulting in pronounced genetic structuring (Bai and Zhang 2015; Keppel et al. 2012). Consequently, we adopted a conservative approach that prioritises congruence across methods and benefits from current taxonomic knowledge to define species boundaries in our study system (Carstens et al. 2013; Ferreira et al. 2023; Santos, Magalhães, Ferreira, et al. 2020; Santos et al. 2023; Sukumaran et al. 2021). This approach led to the recognition of FG as a new species, formally described here as C. alairi. Despite the absence of morphological diagnostic features distinguishing SL from ST, the high genetic divergence observed in some of the analysed markers, combined with the relatively recent divergence time (Figures 4 and 6), suggests that these lineages may fall within the “grey zone” of the speciation continuum, where distinct delimitation approaches may yield conflicting conclusions (Chan et al. 2020; de Queiroz 2007; Roux et al. 2016).
Our multilocus species tree supports a Miocene origin for Crossodactylodes (~9.2 Mya) and subsequent diversification throughout the Miocene, Pliocene and Pleistocene. Specifically, divergences within our focal group were inferred to have occurred during the Pliocene and Pleistocene (Figure 6). This time frame is consistent with molecular clock studies on other frog species endemic to the AF mountains, such as the Ischnocnema lactea—I. holti species complex (Thomé et al. 2020) and groups with some lineages restricted to high-elevation habitats, such as the genus Thoropa (Sabbag et al. 2022). The diversification of AF biota has been attributed to various factors, including isolation driven by geographic barriers or habitat fragmentation resulting from cyclical climate fluctuations, with idiosyncratic responses shaped by the traits and geographic distributions of the taxa involved (Carnaval et al. 2014; Thomé et al. 2010; Turchetto-Zolet et al. 2013). For instance, montane taxa are expected to expand their ranges during glacial periods and become more restricted during interglacials, a pattern that contrasts with the typical dynamics of lowland species (Amaro et al. 2012; Firkowski et al. 2016; Prates et al. 2020; Thomé et al. 2020). Our demographic models support divergence events followed by reductions in population sizes relative to the ancestral population (Figure 3), leading us to rule out the geographic barriers hypothesis for the studied lineages. Instead, we found strong support for the fragmentation models, indicating that divergences in our focal group were likely shaped by climate-related habitat fragmentation during the Plio-Pleistocene (Carnaval et al. 2009; Haffer 1997).
The evidence of a larger ancestor effective population size (i.e., fragmentation model) and the divergence times we found align with the hypothesis of a common ancestor of FG, ST and SL having a broader distribution during the colder and wetter climates of Plio-Pleistocene glacial periods. Two scenarios previously proposed to explain the diversification of other AF montane taxa (Firkowski et al. 2016; Prates et al. 2020) may similarly account for the current distributions of FG, ST and SL: (1) expansion into lowland regions during favourable climatic conditions, followed by independent upward migrations to suitable highland microhabitats during warmer and drier periods, resulting in populations persisting on isolated mountaintops, implying founder effects, as new populations were established by a small number of individuals; or (2) fragmentation of an initially continuous distribution, with populations becoming restricted to independent microrefugia as temperatures increased, implying bottleneck events as populations were lost across much of the ancestral range and survived only in small, favourable patches. Both scenarios predict similar demographic trends (Allendorf et al. 2022), and the current genetic and taxon sampling does not provide sufficient resolution to differentiate between them using coalescent simulations. However, the low probabilities of migration/introgression detected by our JML analysis and demographic models, even between ST and SL, which are separated by very short geographic distances (Figure 1), favour the second scenario. Additionally, natural history traits of Crossodactylodes, such as low dispersal capacity, small body size and strict dependence on bromeliads, provide indirect evidence supporting the fragmentation scenario as a more plausible explanation for our study system (Keppel et al. 2012). Whether through upward migration to favourable microhabitats or survival of isolated populations in these environments, the existence of microrefugia that provided appropriate, stable microclimates likely explains the disjunct distribution and high population structure of the three lineages of Crossodactylodes (Bai and Zhang 2015; Hampe and Jump 2011; Hylander et al. 2015).
The existence and persistence of microrefugia over time are linked to the spatial decoupling of local climates in favourable areas from the regional mean conditions (Dobrowski 2011; Keppel et al. 2012). Topographically complex regions, such as mountains, exhibit substantial variation in local climates along gradients, sometimes within just a few hundred metres, making them likely locations for microrefugia. Physiographic factors influence abiotic conditions, including temperature, precipitation, moisture, soil characteristics, vegetation structure and physiognomy (Dobrowski 2011; Hampe and Jump 2011; Hylander et al. 2015). In this context, the isolated montane forest patches occupied by the three lineages of Crossodactylodes likely provide favourable abiotic conditions, experience low environmental stochasticity and are less prone to extreme events over time, fostering their persistence. These environments lack more conspicuous water bodies, such as streams and ponds, only supporting the reproduction of direct-developing and phytotelm-breeding frogs.
Although our results support the fragmentation scenario, we cannot exclude the possibility that ecologically driven divergent selection contributed to lineage differentiation. For instance, the prevalence of larger bromeliads within the geographic range of FG may have favoured selection for larger body sizes in this lineage, in contrast to ST and SL, which occur in areas with smaller bromeliads (Table S8). Isolation in microrefugia may promote the evolution of locally adapted species interactions (Dobrowski 2011), with the persistence of Crossodactylodes in these habitats potentially leading to adaptive associations with different types of bromeliads. Habitat isolation, arising from differences in microclimate, physical habitat structure, or bromeliad architecture, could promote genetic divergence even across short distances (Rundle and Nosil 2005). Notably, the close geographic proximity between ST and SL, combined with strong genetic structuring, may reflect such selective pressures. Alternatively, divergence may have occurred in the absence of ecological selection through the gradual fixation of selectively favoured mutations in allopatric populations, particularly given their limited dispersal ability and dependence on patchily distributed bromeliads (Czekanski-Moir and Rundell 2019). Although our sampling strategy and analytical framework were not designed to directly test these alternatives, the intraspecific lineages of C. izecksohni and C. alairi constitute a model for future speciation genomics research aimed at explicitly distinguishing between ecological and non-ecological mechanisms of divergence.
The geographic distribution of C. alairi provides another example of a species in the genus with a range restricted to a single locality. Combined with existing knowledge about the distribution of congeners, this highlights the strict association of species of Crossodactylodes with bromeliads in specific, humid, often difficult-to-access mountain tops. Life history traits such as small body size and low-intensity vocalisations (Santos, Magalhães, Ferreira, et al. 2020; Santos et al. 2022) further create challenges for sampling efforts. However, enhanced understanding of the habitat characteristics where populations occur has confirmed the occurrence of the genus in fragmented patches of suitable habitat and facilitated the discovery of new populations (Barata et al. 2024; Ferreira et al. 2023; Santos, Magalhães, Lyra, et al. 2020). Reflecting this trend, five of the eight currently recognised species, including C. alairi, have only been described since 2013, and it is likely that future sampling will continue to yield new discoveries. Our study is the first to test the hypothesis that divergences among distinct lineages of Crossodactylodes align with the assumption of distribution in isolated microrefugia shaped by historical fragmentation processes, with our findings supporting this scenario. Future studies using genome-scale data from a broader representation of lineages could offer a more comprehensive understanding of how historical fragmentation and microrefugia dynamics have influenced the evolutionary history and diversification of this genus. A deeper understanding of evolutionary processes associated with survival in microrefugia may also inform conservation strategies to safeguard montane threatened species in the face of current and future climate change (Dobrowski 2011; Keppel et al. 2012).
Acknowledgements
We are indebted to D.R. Couto for identification of bromeliads and to B.H.B. Fehlberg and P.H. Martins for assisting with fieldwork. We are grateful to the managers and the staff of Parque Estadual do Forno Grande, especially G.M.F. Gomes, and Estação Biológica de Santa Lúcia for providing logistical support. We thank T.R. Carvalho (UFMG-AMP), H.Q.B. Fernandes (MBML), S.P. Carvalho-e-Silva (ZUFRJ), O.L. Peixoto (EI), T. Grant (MZUSP), J.P. Pombal, Jr. (MNRJ), V.G.D. Orrico (MZUESC) and K. de Queiroz (USNM) for the loan of specimens or providing access to the collections. We thank two anonymous reviewers for valuable comments on the manuscript. Financial support was received through a research grant from Conselho Nacional de Desenvolvimento Científico e Tecnológico (CNPq PROTAX #441497/2020-9) and Fundação de Amparo à Pesquisa do Estado de Minas Gerais (FAPEMIG #APQ-03369-21). M.T.T.S. was supported by postdoctoral fellowships from CNPq (PROTAX #151193/2021-5) and the São Paulo Research Foundation (FAPESP #2021/06575-1, #2024/03528-0). C.B.O. thanks Coordenação de Aperfeiçoamento de Pessoal de Nível Superior for a postdoctoral fellowship (#88887.808115/2023-00). R.B.F. was supported by a postdoctoral fellowship from CNPq (#101860/2024-2). F.R.S. thanks CNPq (#406864/2022-5) and FAPEMIG (#APQ-04006-24) for research funding. P.C.A.G. thanks CNPq (PROTAX #441497/2020-9 and research fellowship #310901/2022-7). C.F.B.H. thanks CNPq for a research fellowship (#304713/2023-6) and FAPESP (#2021/10639-5) for financial support. R.F.M. thanks FAPEMIG (#APQ-00325-21) for research funding and CNPq for a research fellowship (#307488/2025-0). The Article Processing Charge for the publication of this research was funded by the Coordenação de Aperfeiçoamento de Pessoal de Nível Superior - Brasil (CAPES) (ROR identifier: 00x0ma614).
The electronic edition of this article complies with the requirements of the amended International Code of Zoological Nomenclature (ICZN), and therefore the new names contained herein are available under that Code from the electronic edition of this work. This published work and the nomenclatural acts it contains have been registered in ZooBank (http://zoobank.org), the online registration system of the ICZN. The LSID for this publication is: urn:lsid:zoobank.org:pub:5B0CD5B8-BC0D-4190-996E-BA4CDEDC0B9D
Open Research
Data Availability Statement
The data that supports the findings of this study are available in the Supporting Information of this article.


