Evaluation of a point-of-care benchtop analyzer for quantitative measurement of C-reactive protein in canine serum and plasma
Abstract
Background
Canine C-reactive protein (cCRP) is an acute-phase protein that increases dramatically with inflammation and has potential utility in monitoring disease progression and response to treatment. Rapid, automated point-of-care test (POCT) formats could enhance the clinical utility of cCRP measurement.
Objectives
We aimed to evaluate the VetChroma canine-specific POCT assay for the quantitative measurement of cCRP in canine serum or plasma.
Methods
Serum and plasma from discarded canine diagnostic samples were used. Evaluation included intra- and inter-assay coefficients of variation and observed total error (TEobs), linearity and spike recovery, the effect of interfering substances and sample matrices, and a method comparison study.
Results
Intra-assay variation ranged from 2.5%–6.1%, and inter-assay variation ranged from 2.1%–5.4%. The TEobs ranged from 15.1%–19.7%. The assay was linear over the manufacturer's analytical range with no evidence of constant or proportional bias. Recovery of purified cCRP from canine serum ranged from 116.2% to 138.4%. Hemolysis, icterus, and turbidity did not interfere with the assay. The comparison of paired plasma and serum samples revealed constant and proportional bias. Comparison of the VetChroma cCRP assay to a commercial cCRP ELISA revealed significantly different results.
Conclusions
The VetChroma cCRP assay has acceptable test performance to measure serum cCRP concentration. The POCT protocol and test kit are valid for clinical use, although results obtained using other cCRP assays or plasma may not be directly compared.
1 INTRODUCTION
The acute-phase response is part of the innate immune response and results in the production of acute-phase proteins (APPs).1 C-reactive protein (CRP) is a major APP in the dog as the plasma or serum concentration of CRP rapidly increases up to 100-fold secondary to an appropriate inflammatory stimulus1 and rapidly decreases following resolution of inflammation.1-3 C-reactive protein plays a multifactorial role during inflammation through aiding in the clearance of infection and damaged tissue by binding to bacteria and damaged cells, promoting phagocytosis.1, 2 C-reactive protein also activates the complement pathway and modulates the inflammatory response by promoting the production of anti-inflammatory cytokines as well as preventing neutrophil chemotaxis and the respiratory burst.1, 2
Numerous studies of infectious, inflammatory, and surgical conditions document the clinical utility of canine CRP (cCRP). Increases in plasma or serum cCRP concentration occur in dogs with leptospirosis,4 bacterial pneumonia,5 and sepsis.6 Non-infectious inflammatory conditions also increase plasma or serum cCRP concentration, including immune-mediated diseases,7, 8 pancreatitis,9 inflammatory enteropathies,10 and neoplasia.11, 12 Perhaps the most significant clinical utility of cCRP may be as a generalized screening test for health or monitoring the response to treatment as APPs may have greater sensitivity than the CBC to detect inflammatory conditions in dogs.13 Consecutive monitoring of plasma/serum cCRP concentration could have clinical utility in dogs with acute abdomen syndrome,14 bacterial pneumonia,5 immune-mediated hemolytic anemia, and immune-mediated polyarthropathy,8 inflammatory enteropathies,10 steroid-responsive meningitis-arteritis,7 systemic inflammatory response syndrome and sepsis,6 monitoring the inflammatory response to different abdominal surgical procedures3 and identifying post-operative complications.15
Until recently, cCRP evaluation required specialized analysis techniques and equipment limited to referral test laboratories that are expensive to operate on a per-test basis, with many diagnostic laboratories not offering this testing. The need to send samples to be tested to a referral laboratory also leads to an unavoidable delay in obtaining test results. Newly developed, lower cost, quantitative point-of-care test (POCT) procedures make cCRP measurement more clinically accessible.16, 17 The ability to receive rapid cCRP results enhances the value of the test to monitor therapy and recovery of critically ill patients. We hypothesized that a new canine-specific CRP cartridge, which uses a mouse monoclonal anti-cCRP antibody and lateral flow immunofluorescence and is designed for use in the VetChroma portable benchtop analyzer (Anivet Diagnostics), would accurately measure cCRP in canine serum and plasma. The objective of our study was, therefore, to evaluate the cCRP test cartridge on the VetChroma analyzer.
2 MATERIALS AND METHODS
2.1 Source, handling, and storage of test samples
The study used discarded plasma and serum samples remaining from canine blood submitted initially for diagnostic testing to the University of Illinois Veterinary Diagnostic Laboratory. The samples, therefore, represented a clinical population of healthy and diseased dogs. As all testing was performed using discarded samples, an animal use protocol was not required. Hospital board approval for the use of the samples was not required as the hospital admission form states that all specimens collected during the care of a patient become the property of the University and can be used for applied research and test development. Blood for plasma was submitted in K+EDTA glass tubes that were refrigerated at 4°C and within 12 hours of collection. Plasma was harvested 3-6 days after sample collection by centrifugation at 1972 g for 10 minutes. Plasma could not be harvested sooner as samples are required to be retained in their whole blood form for three business days according to the lab's standard operating procedure. Blood for serum was collected in stoppered blood collection tubes of plain glass or in serum separator tubes that contained silicone gel. The blood was allowed to clot at room temperature for up to 30 minutes and then centrifuged as above, and the serum was harvested by pipette and placed in capped 5 ml polypropylene tubes. Two 150 μL aliquots of each plasma or serum sample were prepared and stored at −20°C in capped 1.5 mL polypropylene vials for up to 3 months. Aliquots kept for the method comparison portion of the study were transferred to −80°C after 3 months. The matrix comparison portion of the study used plasma samples stored at −80°C for up to 2 years. Serum samples were stored at −20°C for up to 2 weeks for interference studies and at −80°C for up to 2 years for matrix comparison, linearity, and precision studies.
2.2 Method evaluation of the VetChroma analyzer canine C-reactive protein cartridge
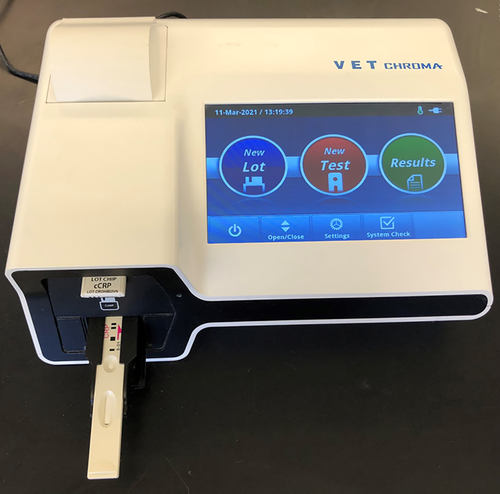
The VetChroma analyzer (Figure 1) is a small portable benchtop analyzer that uses quantitative lateral flow immunofluorescence to measure multiple analytes in serum and plasma with analyte-specific cartridges. The kit provides the batch lot chip, cCRP-specific VetChroma cartridges, the buffer system in individual premeasured containers, and individual container caps with a dispenser. Two levels of canine-specific quality control material (QCM) were provided separately in powder form in the control kit. Double distilled water is recommended for reconstitution. The cCRP-specific cartridge and buffer system uses a mouse monoclonal anti-cCRP antibody for the quantitative measurement of cCRP concentrations. The mouse monoclonal antibody without a fluorescent tag is embedded on the test cartridge. The same antibody with a fluorescent tag is found within the test buffer system. We performed all assays according to the manufacturer's directions, which required adding 10 μL of patient serum or plasma to 1000 μL of a premeasured detection buffer in a provided container. The container was capped and manually inverted 10 times to mix the sample. After mixing, the directions recommend discarding the first two drops (~75 μL) of the sample/detection buffer mixture into the removed cap and placing the next two drops into the sample well of the cartridge. The sample/detection buffer mixture then diffuses through a membrane allowing for the capture of cCRP by the embedded monoclonal antibody. The degree of fluorescence was determined, and the analyzer provided a quantitative result within 3-10 minutes after inserting the cartridge into the VetChroma device. The machine is factory calibrated, and the manufacturer provides a system check cartridge that emits a defined fluorescent signal to ensure appropriate signal detection. Factory settings ask the user to run a system check every 30 days. We performed a system check when prompted by the analyzer throughout the study period. Testing would proceed only if the system check was acceptable.
The lower and upper limits of the measurement range for the cCRP concentration in serum or plasma, as reported by the manufacturer, are 5.0 and 250.0 mg/L, respectively. Four samples that measured above 250.0 mg/L were excluded from the method evaluation and method comparison studies because the manufacturer did not provide instructions for the dilution of samples with cCRP concentrations above the measurement range. We assigned a value of 2.5 mg/L to all samples that measured below the reportable range in this study. The manufacturer reports the limit of detection to be below the reportable range of the assay at 2.5 mg/L. It was necessary to use test cartridges from different production lots over the course of the study. To decrease the possibility of error caused by potentially slight differences between cartridge production lots, a single cartridge lot was used for each validation step. Control material was also tested each day before any testing was performed to confirm cartridge quality.
2.2.1 Test imprecision and bias
We used pooled canine serum samples and manufacturer cCRP QCM to measure analytical variation, within-run and between-run, of the VetChroma assay. We compared measured coefficients of variation (%CV) to within-dog cCRP biological variation reported by others.18 In the absence of other reference materials, the measured mean cCRP concentrations of levels 1 and 2 QCM, and manufacturer-supplied mean QCM data were used to calculate the observed total error (TEobs) of the results. 19 The TEobs value was compared with the desirable total error (TEdes), as calculated by the American Society for Veterinary Clinical Pathology's (ASVCP) equipment quality assurance guidelines,19 and with the TEobs values previously reported for other cCRP POCT assays.16, 17 Two levels of QCM, high and low, from the same batch number, were tested 20 times on the same day to determine intra-assay variation. Inter-assay variation for the control material was determined over 6 days, again using QCM material from the same batch number. Each QCM was run in duplicate each day and stored at 4°C between days. To evaluate intra-assay variation, we pooled canine samples with relatively low, middle, or high concentrations of cCRP. The patient samples had been used previously for the matrix comparison portion of the study and refrozen at −80°C for two months. The low, middle, and high-level samples had previously measured cCRP concentrations of <25, 50-100, and 100-150 mg/L, respectively. Each pooled serum was analyzed 15 times during a single day instead of the 20 times recommended20 because of limited pool volumes. A new dilution of serum sample and detection buffer was prepared for each replicate.
2.2.2 Linearity and recovery
To assess proportional and constant bias, and systematic error of the measurements (SEmeas), we tested the linearity of the assay using serial dilutions of pooled serum and performed a spike recovery experiment. The serum serial dilutions were made by mixing pooled serum with relatively high cCRP concentrations into pooled serum with cCRP values below the reportable range of the test. All samples had been used previously for the matrix comparison portion of the study and refrozen at −80°C for 2 months. The below the reportable range pooled serum sample was used as the diluent to maintain a constant canine serum matrix and tested in duplicate to confirm that it had a less than detectable value. Ten 100 μL test samples were made by mixing increasing volumes of high cCRP concentration pooled serum in 10% increments with decreasing volumes of below the reportable range pooled serum. All test samples were measured in duplicate.
We tested recovery by spiking canine serum with purified cCRP prepared from canine serum (Lee Biosolutions). The manufacturer shipped the material on dry ice, and we stored it at −80°C until use. The literature accompanying the product claimed that the cCRP concentration was 3700 mg/L with ≥95% purity by SDS-PAGE. Based on the reported concentration, we thawed and mixed the purified cCRP liquid with pooled below-reportable-range cCRP serum to produce a stock solution with an estimated concentration of 502.5 mg/L (500.0 mg/L from concentrate and an estimated 2.5 mg/L from pooled serum). We performed serial dilutions beginning with 50 μl of the stock solution into 50 μL of below-reportable range serum to prepare six test samples of decreasing cCRP concentration. The six samples were run as a batch within approximately 60 minutes of preparation. The same procedure was repeated using 0.9% NaCl solution as a diluent instead of canine serum. All samples were measured in duplicate.
2.2.3 Interference
Possible test interference from hemolysis, icterus, and lipemia (turbidity) was evaluated. Serum from dogs with an inflammatory response, and therefore likely to have measurable serum cCRP, were identified from CBC results from concurrently submitted K+EDTA blood samples. The hematological evidence used to confirm the presence of inflammation included neutrophilia, increased band neutrophils, neutropenia, and morphologic changes in the neutrophils consistent with inflammation-induced toxicity.21 Hemolytic, icteric, and lipemic indices were measured for the pooled serum sample on an AU680 chemistry analyzer (Beckman Coulter, Brea, California) and confirmed to be negative for all interfering substances prior to testing. The cCRP concentration of the pooled serum was determined in duplicate each day that interference testing was performed for a total of four measurements. The mean of these four measurements constituted the cCRP concentration for the sample.
We used multiple samples of discarded canine K+EDTA blood stored refrigerated at 4°C for 3-4 days to determine the effect of hemolysis. The number of samples used ensured adequate volume for all hemolysis testing. Plasma was decanted from the blood cells after centrifugation at 1972 g for 10 minutes, and the cells were washed by resuspension in 0.9% NaCl solution, followed by recentrifugation for a total of three washings. The addition of deionized water followed by freezing overnight at −20°C lysed the cells. After freezing, the sample was thawed at room temperature and then centrifuged at 21 000 g for 10 minutes using the Sorvall Legend Micro 21 centrifuge (Thermo Scientific). The supernatant was removed from the remnant cell membranes and transferred to a new tube. The hemolytic supernatant was combined with 0.9% NaCl to make stock dilutions that, when combined in a 1:9 ratio with 0.9% NaCl, gave a hemolytic index of 1+, 2+, 3+ and 4+ when measured on the AU680 chemistry analyzer. The hemolysis stock solutions were then combined in a 1:9 ratio with the pooled serum sample and tested in duplicate for cCRP concentration.
Tests of the effect of lipemia (turbidity) used Intralipid 20% (Sigma-Aldrich). Intralipid 20% was mixed with 0.9% NaCl to make stock dilutions that, when combined in a 1:9 ratio with serum, produced AU680 lipemic indexes of 1+, 2+, 3+, and 4+. We tested the cCRP concentration of each 1:9 dilution twice.
Interference from icterus testing used conjugated bilirubin (EMO Millipore, Darmstadt, Germany) that, according to the manufacturer, behaves similar to purified bilirubin glucuronide in diazo tests. As recommended by the manufacturer, 10 mg of conjugated bilirubin was re-constituted using 1 ml of deionized water to make a 10 mg/mL solution. This solution was combined with deionized water to make stock dilutions that, when combined in a 1:9 ratio with serum, gave icteric indexes of 1+, 2+, 3+, and 4+ when measured on the AU680 chemistry analyzer. We tested the cCRP concentrations of each dilution in duplicate.
2.2.4 Comparison of serum with plasma matrix
The manufacturer communicated that a plasma matrix (K+EDTA or heparin) and a serum matrix are appropriate for use with the VetChroma cCRP assay. We, therefore, compared cCRP values obtained using 100 K+EDTA plasma samples with paired serum samples, measured sequentially within 10 minutes in randomized order.
2.3 Method comparison to a commercially available cCRP ELISA
The concentration of cCRP measured with the VetChroma cCRP assay was compared to cCRP concentrations determined using a cCRP ELISA method (TECO Canine cCRP assay, TECOmedical group, Switzerland) using canine serum. Although a complete validation study of the TECO ELISA has not been published, it was selected for comparison because published studies have verified its use with dog serum,12, 16 and a definitive gold standard test to measure cCRP was not available. One hundred and forty four samples were used for this portion of the study. Serum samples used for method comparison testing were shipped on dry ice via courier from the University of Illinois to Anivet Diagnostics Inc, South Korea. The cCRP concentration in serum samples was measured using the VetChroma analyzer first, followed by the TECO ELISA within the same lab at Anivet on the same day. The VetChroma analyzer used for the method comparison study was a different machine but the same model as the VetChroma analyzer used for all other portions of test evaluation. The comparisons did not include samples that measured >250.0 mg/L by the VetChroma assay, as this was greater than the reported measurement range. Samples were measured once using each test in a single day, following an analysis of controls for both assays.
The measurement range for the TECO ELISA is 5-50 mg/L. Based on the cCRP concentration as measured by the VetChroma assay, samples with a cCRP concentration ≤ 50.0 mg/L were prediluted 1:100, and samples with a cCRP concentration > 50.0 mg/L were prediluted 1:500 before measurement by the TECO ELISA as recommended by the manufacturer using the provided diluent.
2.4 Statistical analysis
Statistical analysis using MedCalc Statistical Software version 19.1.3 (MedCalc Software bv, 2019) with a P < .05 was considered significant.
The intra- and inter-assay variations of canine serum and QCM were calculated from the means and standard deviations and expressed as the %CV. The inter-assay variation calculation used the mean of the duplicate samples run each day. The TEobs and measured bias of the VetChroma cCRP was calculated following the American Society for Veterinary Clinical Pathology's (ASVCP) instrument performance evaluation guidelines.19 Observable total error was calculated using the equation, %TEobs = 2CV(%) + %Bias; where CV = the inter-assay coefficient of variation of the QCM. Bias was calculated using the formula, %Bias = ([meanmeasured − meanmanufacturer]/meanmanufacturer) × 100%, where meanmeasured = the mean inter-assay cCRP concentration determined in this study, and meanmanufacturer = the cCRP concentration of the QCM reported by the test manufacturer. Acceptable analytical imprecision was defined as measured CVs of less than half the within-dog biological variation of cCRP and TEobs less than the total desirable error (TEdes) calculated using the reported biological variation of cCRP.18, 22
We analyzed the results of the serial dilution of high cCRP serum with low cCRP serum for evidence of constant and proportional bias using ordinary least-squares linear regression, confidence interval (CI) = 95%. For the spike recovery experiment, we determined the spiked serum samples' percent recovery and SEmeas beginning with the first measured concentration within the analyzer's reportable range. Systematic error (SEmeas) was defined as the absolute difference between the calculated percent recovery and 100%. The percent spike recovery was calculated by subtracting the estimated amount of cCRP in the below-reportable range serum diluent (2.5 mg/L) from the average measured amount in the duplicate samples, divided by the amount of the cCRP spike. We considered the recovery of each dilution acceptable if the SEmeas was less than the published value for TEmax empirically determined from the biological variability of cCRP.18, 20 Ordinary least-squares regression was also evaluated in the spike recovery experiment to look for evidence of constant and proportional bias. Statistics for the spike recovery in 0.9% NaCl solution were similarly done.
Evaluation of the effect of interfering substances used a paired t-test.20 The expected cCRP concentrations were calculated as 90% of their measured values to adjust for the 1:9 sample dilution by the interfering substance stock solutions.
To determine whether the VetChroma produced equivalent cCRP concentrations for plasma and serum samples from the same dog, Passing-Bablok regression was performed, and a Bland-Altman plot was constructed to evaluate the presence of constant and proportional bias.20, 23, 25, 26 Visual examination of the Bland-Altman plot was used to assess the normality of the differences between serum and plasma sample data. If not normally distributed, the data were log10 transformed, and a new Bland-Altman plot was evaluated, and the antilogs of the limits of agreement (LOA) were used to determine the magnitude of the difference.24
Evaluation of the presence of constant and proportional bias between the methods comparison of the VetChroma assay and TECO ELISA used Passing-Bablok regression and a Bland-Altman plot23, 25, 26 as recommended.20 Evaluation of the distribution of the differences, transformation of the data as well as the construction of a new Bland-Altman plot to determine the magnitude of the difference were performed as stated above.
3 RESULTS
3.1 Analytical performance of the VetChroma C-reactive protein analyzer
The intra-assay and inter-assay CVs of the VetChroma cCRP assay, determined with control material and canine serum, ranged from 2.1% to 6.1% (Table 1). These values are 25% or less than the CV reported for within-dog (24.3%) biological variation and less than half the CVmax (12.2%) of cCRP.18 The TEobs of the low (15.2%) and high (19.7%) QCM were below the TEmax (29.6%) calculated using the reported biological variation of cCRP.19 Additionally, the intra- and inter-assay CVs and TEobs of the VetChroma analyzer compared favorably with reported values of other cCRP POCTs.16, 17
| % CV | SD | Mean cCRP (mg/L) | Replicates | |
|---|---|---|---|---|
| Intra-assay | ||||
| QCM level 1 | 4.0 | 1.1 | 27.2 | 20 |
| QCM level 2 | 6.1 | 11.7 | 190.9 | 20 |
| Low cCRP serum | 3.1 | 0.7 | 21.8 | 15 |
| Mid cCRP serum | 2.5 | 1.3 | 53.7 | 15 |
| High cCRP serum | 5.5 | 7.7 | 141.3 | 15 |
| Inter-assay | ||||
| QCM level 1 | 2.1 | 0.5 | 25.9 | 6 |
| QCM level 2 | 5.4 | 9.9 | 182.9 | 6 |
- Abbreviations: cCRP, canine C-reactive protein; QCM, cCRP quality control material; % CV, percent coefficient of variation; SD, standard deviation.
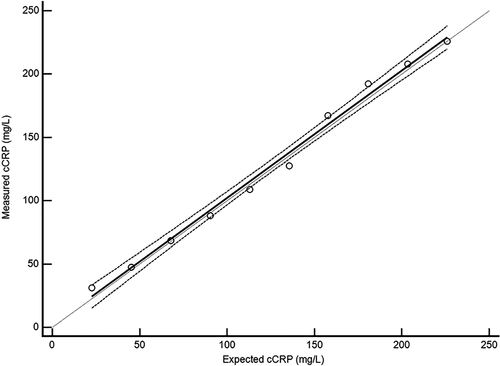
When we tested the linearity of the assay by mixing incremental volumes of high-cCRP serum with low cCRP-serum, the measured cCRP concentrations ranged from 31.4 to 225.8 mg/L, encompassing most of the manufacturer's recommended analytical range of 5-250 mg/L. Analysis of the regression line showed that the results were linear and without significant constant or proportional bias (Figure 2). The 95% CI of the y-intercept for the regression line (−8.9, 12.2) included 0, and the 95% CI of the slope for the regression line (0.93, 1.08) included 1.
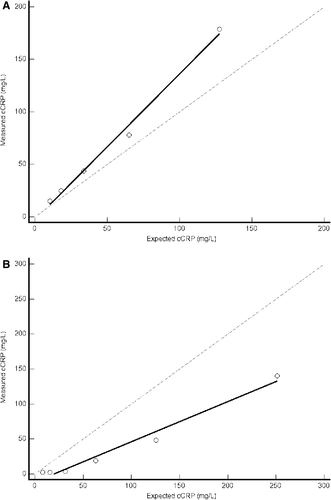
Recovery of a cCRP spike from serum or 0.9% NaCl solution showed no constant bias but showed evidence of proportional bias (Figure 3A,B). The 95% CI of the y-intercept for the regression line in the serum matrix (−17.3, 12.0) included 0, but the 95% CI of the slope for the regression line (1.17, 1.61) did not include 1. Using 0.9% NaCl as the diluent, the 95% CI of the y-intercept for the regression line (−26.2, 3.9) included 0, but the 95% CI of the slope (0.45, 0.70) did not include 1. The measured concentrations of cCRP in 0.9% NaCl were less than the equivalent dilutions measured in the serum matrix. The measured concentration of cCRP in the initial spiked serum sample was >250.0 mg/L. Because this value was above the manufacturer-provided measurement range of the assay, we began the analysis of the recovery data at the first dilution that had a cCRP concentration within the range of the assay, 178.9 mg/L. The percent recovery of the five samples ranged from 116.2% to 138.4% (Table 2). The SEmeas ranged from 16.2% to 38.4%. Given that the reported TEmax of cCRP is 29.6%,18 the VetChroma assay met our criteria for acceptable recovery performance (SEmeas < TEmax) when the expected cCRP concentration was ≤65.0 mg/L.
| Measured cCRP (mg/L) | Expected cCRP (mg/L) | Recovery (%) | SEmeas (%) |
|---|---|---|---|
| 178.9 | 127.5 | 138.4 | 38.4 |
| 78.0 | 65.0 | 116.2 | 16.2 |
| 43.6 | 33.8 | 121.8 | 21.8 |
| 24.8 | 18.1 | 123.0 | 23.0 |
| 15.2 | 10.3 | 123.2 | 23.2 |
- Abbreviations: cCRP, canine C-reactive protein; SEmeas, systematic error of the measurement.
In the tests of the effects of interfering substances on assay performance, the average measured concentration of pooled serum was 104.5 mg/L, with the calculated 90% concentration being 94.0 mg/L (Table 3). The below-reportable range stock solutions alone, before the addition of the pooled serum sample, had a cCRP concentration below the lowest measurable concentration (5 mg/L). The percent differences from the calculated cCRP concentration of 94.0 mg/L were all <10%. A statistically significant effect of hemolysis, icterus, or lipemia/turbidity on measured cCRP concentration was not evident.
| Sample | Mean cCRP concentration (mg/L) | Difference in cCRP concentration in mg/L and (%) |
|---|---|---|
| Pooled serum sample | 104.5 | |
| 90% pooled serum sample | 94.0 | |
| Hemolysis 1+ | 90.7 | −3.3 (−3.6) |
| Hemolysis 2+ | 88.4 | −5.7 (−6.0) |
| Hemolysis 3+ | 94.2 | +0.2 (+0.2) |
| Hemolysis 4+ | 93.4 | −0.6 (−0.6) |
| Icterus 1+ | 89.0 | −5.0 (−5.3) |
| Icterus 2+ | 87.0 | −7.0 (−7.4) |
| Icterus 3+ | 89.1 | −4.9 (−5.3) |
| Icterus 4+ | 87.4 | −6.6 (−7.0) |
| Lipemia 1+ | 89.0 | −5.0 (−5.3) |
| Lipemia 2+ | 91.9 | +2.1 (+2.2) |
| Lipemia 3+ | 88.5 | −5.6 (−5.9) |
| Lipemia 4+ | 87.8 | −6.2 (−6.6) |
- The effects of the degree of hemolysis, icterus and lipemia (turbidity) on the measurement of cCRP concentration in a pooled serum sample are shown. The measured cCRP concentration, difference between the measured and actual cCRP concentration (94.0 mg/L) and the percent difference in parentheses are provided. The P value for all comparisons was >.05.
- Abbreviation: cCRP, canine C-reactive protein.
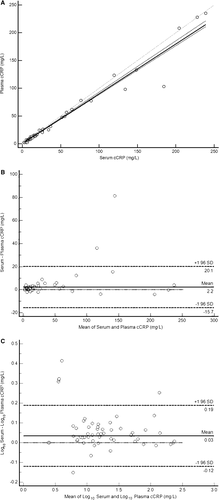
Analysis of the cCRP concentrations in paired plasma and serum samples indicated evidence of constant and proportional bias based on the 95% confidence interval for the y-intercept (0.18, 0.30) not including 0 and the 95% confidence interval for the slope (0.88, 0.93) not including 1 (Figure 4A). Inspection of the Bland-Altman plot showed that the serum and plasma differences were not normally distributed and had an LOA of −15.7 and 20.1 mg/L (Figure 4B). Data distribution was improved after log10 transformation (Figure 4C). The mean difference of the log10 transformed data was 0.03 and LOA of −0.12 and 0.19. The antilogs of the LOA were 0.8 and 1.5, suggesting that serum cCRP concentration could be 0.8 to 1.5 times the plasma cCRP concentration in 95% of cases. The possibility of a large difference does not support the direct comparison of serum values to plasma values.
3.2 Method comparison to a commercially available cCRP ELISA
Visual comparison of the VetChroma cCRP assay to the cCRP ELISA revealed that the two methods were not equivalent and that the relationship between the two assays differed when the cCRP ELISA concentration was >50 mg/L. This breakpoint reflected the ELISA manufacturer's recommendation to dilute cCRP concentrations >50 mg/L with a supplied diluent. Accordingly, method comparisons were performed separately for samples where the cCRP ELISA concentration was ≤50 mg/L (undiluted) and > 50 mg/L (diluted) based on the TECO ELISA cCRP concentration.
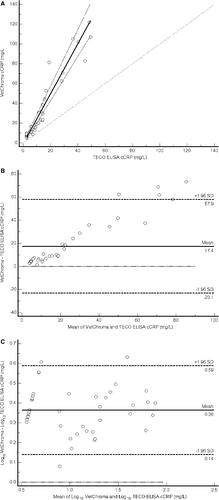
When the TECO ELISA cCRP concentration was ≤50.0 mg/L, 88 out of 130 samples measured below the measurement range of both assays. These data points were not included in the statistical analysis. The results of the Passing-Bablok regression did not indicate the presence of constant bias, based on an estimate for the y-intercept of −1.0 mg/L and a 95% confidence interval for the intercept estimate (−2.1, 0.1) that included 0 (Figure 5A). The estimate for the slope (2.53) and 95% confidence interval for the slope estimate (2.24, 2.86) did not include 1, indicating the presence of proportional bias. The presence of constant and proportional bias was readily identified on the Bland-Altman plot (Figure 5B), which had LOA of −23.1 and 57.9 mg/L. The presence of proportional bias was highlighted by an increase in the difference between the two methods as the concentration of cCRP increased. Since the differences when the TECO ELISA cCRP concentration was ≤50.0 mg/L were not normally distributed, the data was log10 transformed, and a new Bland-Altman plot was constructed, which improved data distribution. The mean difference on the log scale was 0.36, and the LOAs were 0.59 and 0.14 (Figure 5C). The antilogs of the limits of agreement were 3.9 and 1.4, respectively, which indicated that the cCRP concentration measured by the VetChroma assay was 1.4-3.9 times the value measured by the TECO ELISA in approximately 95% of cases when the TECO ELISA cCRP concentration was ≤50.0 mg/L. The presence of such a large difference does not support the clinical comparison between the results generated with the VetChroma assay and the TECO ELISA when the TECO ELISA cCRP concentration was ≤50.0 mg/L.
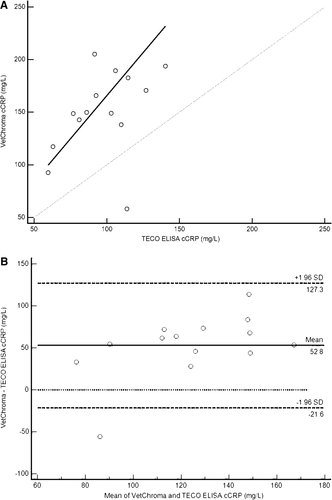
Results of the Passing-Bablok regression when the cCRP ELISA concentration was >50.0 mg/L indicated the lack of constant and proportional bias. The estimate of the y-intercept was 1.9 mg/L with a 95% CI for the intercept estimate (−171.4, 73.6), which was large but included 0 (Figure 6A). The estimate for the slope (1.64) and 95% CI for the slope estimate (0.86, 3.52) was also large but included 1. The Bland-Altman plot lacked evidence of proportional bias but readily identified constant bias that was not evident on the Passing-Bablok regression, with the VetChroma assay consistently measuring higher than the reference method (Figure 6B). The LOAs of the original Bland-Altman plot were −21.6 and 127.3 mg/L. The possibility of such a large difference does not support a clinical comparison between the results generated with the VetChroma assay and the TECO ELISA when the TECO ELISA cCRP concentration was >50.0 mg/L.
4 DISCUSSION
The ability to measure plasma or serum cCRP concentrations rapidly within a diagnostic laboratory or clinical practice setting may offer immediate supportive information to the diagnosis of a variety of common canine diseases. Canine CRP is known to be a marker of inflammation in the dog, with increased blood concentrations noted following surgery, with various infectious diseases, and with non-infectious inflammatory conditions.3, 4, 27 The cCRP response increases before more traditional inflammatory markers,28 reinforcing its usefulness as an early indicator of inflammation.
We found the VetChroma desktop analyzer to be easy to use as it provided on-screen directions for sample processing as well as a package insert. Also, we conclude that the analyzer's test precision is acceptable for clinical use to measure cCRP. The measured CVs were less than half those of biological variation18 and therefore in line with recommended limits of maximum allowable analytical variation of a clinical test.22 Further evidence of the analyzer's acceptable performance was the TEobs of the control materials, which were less than TEdes. Additionally, the intra- and inter-assay CVs and TEobs noted for this POCT compared favorably to those reported for previously evaluated cCRP POCTs.17, 18 One limitation of the inter-assay CV experiment was that it used only cartridges from a single lot number and could not evaluate the potential effect of successive manufacturing lots over time on test imprecision. A second limitation was that the lack of adequate pooled serum limited the number of repeat analyses of serum for our intra-assay variation study to 15, rather than the recommended 20 repeat analyses.20 However, given the relatively small CV values of less than 6%, we would not expect the CVs to significantly differ with 20 replicates.
The findings of this study confirm that the VetChroma assay's reported analytical range is valid, with the linearity of the assay results maintained upon serial dilution of high cCRP serum. While the possibility of an effect of small amounts of cCRP in the low serum pool was possible, we did not detect significant constant or proportional bias in the linearity results and therefore believed that the effect was negligible at most. Regression analysis using 0.9% NaCl solution as a diluent produced similar linear regression results as canine serum; however, the measured cCRP values were substantially less. We believe that the use of 0.9% NaCl as a diluent may cause the partial denaturing of the pentameric structure29 of cCRP, leading to decreased detection by the assay antibodies and a falsely decreased cCRP concentration. Nevertheless, based on these findings, a clinical sample's predilution may be acceptable if using pooled serum with a cCRP concentration below-reportable range as a diluent, but not 0.9% NaCl.
One clinical situation warranting sample dilution, and not tested for in this study, is when a prozone or hook effect is suspected. In such instances, the analyte concentration is so large that it overwhelms the detection and captures antibody concentrations and causes a falsely low result. Since the VetChroma cCRP test mixes the sample and detection antibody before passage over the capture antibody and uses a single wash step, it is sensitive to a hook effect. Consequently, similar to many automated immunoassays, one might choose to reanalyze serial dilutions of samples where clinical evidence of inflammation is strong, but the cCRP concentration is relatively low or normal.
The spike recovery study lacked either a gold standard cCRP source or calibration standards as reliable reference concentrations. Although the majority of results met our stated limit for acceptable recovery (SEmeas < TEmax), the individual recovery values were consistently higher than 100% when using serum with a below-reportable range cCRP concentration as the diluent. The supplier may have underestimated the concentration of cCRP in the stock solution. However, we cannot rule out that the VetChroma assay overestimates the cCRP concentration. Regardless, the results suggest that the RI of the VetChroma cCRP assay may differ from other CRP assays. The consistent overestimation of the spike appears to have contributed to SEmeas exceeding TEmax at only the highest measured concentration. The observed proportional bias seen by regression analysis was relatively less contributory to the magnitude of SEmeas. Therefore, our conclusion is that overall, test recovery is acceptable.
The methods comparison study revealed a difference between the results generated with the VetChroma assay and the TECO ELISA, indicating that cCRP values are not adequately comparable for precise comparison. The relationship between the two methods varied depending on the concentration of cCRP. Significant constant and proportional bias were present when the cCRP concentration measured ≤50.0 mg/L. The VetChroma assay often measured a greater cCRP concentration in split samples than the TECO ELISA, with the difference between the two assays increasing at higher concentrations of cCRP. When the cCRP concentration measured >50.0 mg/L, the VetChroma assay measured greater than the TECO ELISA in all but one sample. The relatively low number of samples at this concentration range may have reduced the sensitivity of the statistical analysis to detect significant bias. Our conclusions based on this experiment are like those drawn from the spike recovery experiment. We believe that clinicians should refrain from directly comparing cCRP results obtained using different assays.
The evaluation of the effect of interfering substances such as hemolysis, icterus, and lipemia is an important part of determining the analytical performance of an assay.20, 30 Other studies have evaluated the effects of these interferents on cCRP assays,31-34 including with a POCT method.17 In one previous study, hemolysis increased the measured cCRP concentration, while lipemia caused a variable change, and icterus caused the cCRP concentration to decrease.31 In the POCT assay that previously evaluated the effect of interferents, the observed bias (Bobs) of all interfering substances was less than the TEopt.17 In this study, the effect of hemolysis, icterus, and lipemia was deemed acceptable based on statistically insignificant paired t-test results.20 Although the ASVCP guidelines recommend using commercially available lipid solutions as one way of assessing lipemia interference, 20 Intralipid is made from soybean oil and phospholipids and not the lipoproteins, lipids, and triglycerides occurring in a naturally lipemic sample. Therefore, the term “turbidity” rather than “lipemia” may more closely reflect the interference measured in this study.
Others have shown that the use and type of anticoagulant may affect the measured cCRP concentration.31, 34, 35 The presence of constant and proportional bias in our results supports a similar effect of sample type on the VetChroma cCRP assay. Due to the laboratory's operating procedures, the K+EDTA plasma remained in contact with blood cells for up to 6 days after sample collection. We are not aware of studies that have investigated the stability of CRP in whole blood stored up to 6 days after collection. However, the differences in handling between the paired serum and plasma samples may be responsible for the observed bias and occasionally large differences between paired values.
An overall limitation of this study was that the clinical case material did not provide a large number of samples in the upper working range, i.e., >50.0 mg/L. Fourteen samples were available in this concentration range, which is less than the number recommended for some validation studies, including method comparison.20 However, the study included over 40 cases with cCRP concentrations above the published diagnostic cut-off of 15.0 mg/L,17, 27, 35 supporting our conclusions on the adequate performance of the VetChroma assay as a diagnostic test. Another limitation was that samples used in this study were stored under several different conditions for up to 2 years, and some samples went through at least one freeze/thaw cycle before testing. However, previous research has shown that CRP is stable under various storage conditions16, 33, 35-39 and after multiple freeze/thaw cycles.33, 36, 40 Therefore, we feel the variability in storage conditions and use of some samples after multiple freeze/thaw cycles were unlikely to have affected our results.
In conclusion, the VetChroma analyzer was easy to use and provided a much-needed POCT for measuring plasma or serum cCRP concentration. The assay provided acceptable intra- and inter-assay CV values, linearity throughout the manufacturer's reported working range, and acceptable recovery of cCRP when diluting with below the reportable range of the assay cCRP serum. The assay was not affected by interfering substances sometimes present in blood samples. Results obtained using other cCRP assays may not be directly compared to those generated using the VetChroma analyzer and require the generation of a specific reference range and diagnostic cut-off points. The point-of-care testing format of the VetChroma analyzer should advance the clinical use of cCRP by increasing test accessibility and decreasing test turn-around time and cost.
ACKNOWLEDGMENTS
The authors thank Anivet Diagnostics for providing the VetChroma analyzer, all control material, and all needed cCRP cartridges during the study. We also thank Lee Biosolutions for supplying additional cCRP to complete the spike recovery.
DISCLOSURE
Dr. Joo Hoo Don and Dr. Kim Hyun Jeong were previously employed with Anivet Diagnostics Inc. The method comparison testing was performed at Anivet Diagnostics Inc. All other testing and statistical analyses were performed at the University of Illinois by the remaining authors.


