
Regulation of Dynamin Oligomerization in Cells: The Role of Dynamin–Actin Interactions and Its GTPase Activity
Abstract
Dynamin is a 96-kDa protein that has multiple oligomerization states that influence its GTPase activity. A number of different dynamin effectors, including lipids, actin filaments, and SH3-domain-containing proteins, have been implicated in the regulation of dynamin oligomerization, though their roles in influencing dynamin oligomerization have been studied predominantly in vitro using recombinant proteins. Here, we identify higher order dynamin oligomers such as rings and helices in vitro and in live cells using fluorescence lifetime imaging microscopy (FLIM). FLIM detected GTP- and actin-dependent dynamin oligomerization at distinct cellular sites, including the cell membrane and transition zones where cortical actin transitions into stress fibers. Our study identifies a major role for direct dynamin–actin interactions and dynamin's GTPase activity in the regulation of dynamin oligomerization in cells.
The dynamin family of GTPases is unique in their ability to exist in multiple oligomerization forms. Dynamin is found in equilibrium as dimers (DynDIMER), tetramers (DynTETRA) and octamers (DynOCTA) 1, 2, and these structures can assemble into higher order oligomers such as rings and helices (DynOLIGO) (reviewed in 3). The assembly of dynamin into higher order oligomers increases its GTPase activity 4, which promotes its disassembly 5, 6. Since dynamin's GTPase cycle is regulated by its oligomerization cycle, it is not surprising that dynamin oligomerization is influenced by several distinct effectors, such as lipids 3, 7-9, microtubules 10, 11, SH3-domain-containing proteins 12 and short actin filaments 13.
The role of diverse dynamin effectors on dynamin's oligomerization cycle is primarily studied by examining dynamin's GTPase activity in vitro. In the presence of lipids, dynamin forms helices and the GTPase activity of dynamin increases between 10 and 100 fold (formation of helices have been observed using electron microscopy in vitro and in cells) 3, 7-9. Addition of SH3-domain-containing proteins or short actin filaments promotes formation of single and partial rings and results in a 2–5 fold increase in GTPase activity 12, 13.
Current dogma states that dynamin oligomerization in cells occurs exclusively on the cell membrane where it is believed to play an essential role in driving the fission reaction by which clathrin-coated pits are released (reviewed in 3). Interestingly, our in vitro studies have identified a role for direct dynamin–actin interactions in the promotion of dynamin oligomerization 13. This role has been implicated in the global organization of actin cytoskeleton (reviewed in 14). Although dynamin oligomerization has been invoked to explain two distinct biological phenomena (the fission reaction during endocytosis and the regulation of actin cytoskeleton) dynamin oligomerization has never been directly followed in live cells. Here, we report the use of fluorescence lifetime imaging microscopy (FLIM) as a technique to specifically follow dynamin oligomerization into higher order oligomers in vitro and in cells.
Results
FLIM analysis of dynamin helices on lipid templates
FLIM is a quantitative technique that is widely used to follow distinct oligomerization states of proteins in cells. FLIM measures fluorescence resonance energy transfer (FRET) between donor and acceptor fluorophores that are less than 10 nm apart. First, we tested whether FLIM could detect dynamin assembly into helices on the lipid templates. Human neuronal Dyn1 isoform was tagged on its N- and C-terminus with a donor [enhanced cyan fluorescent protein (eCFP)] or acceptor [enhanced yellow fluorescent protein (eYFP)] fluorophore. This yielded kinetically functional dynamin proteins that had the predicted effects on endocytosis (Table S1, Supporting Information and Figure S1 for N-terminally tagged Dyn1). The fluorescence lifetime, τ1, of the recombinant eCFP-Dyn1 (donor only) was similar to the lifetime when both donor- and acceptor-labeled dynamin proteins accompanied each other (eCFP/eYFP-Dyn1) (Figure 1A. column 1 and Table S2, lines 1–2). Since recombinant Dyn1 exists in equilibrium between dimer (DynDIMER), tetramer (DynTETRA) and octamer (DynOCTA) forms [Figure S1D, and 1, 2], these data show that in these oligomers, the fluorophores were too far apart for FRET to occur.

It is well known that lipid tubules provide a template for dynamin oligomerization into helices 3, 7-9. When dynamin was incubated with l-α-phosphatidyl-l-serine-containing lipid vesicles (PS liposomes) to promote its helical form 15, the lifetime in the whole sample was shortened from 2077 ± 12 picoseconds to 1684 ± 33 picoseconds, indicating FRET (Figure 1A, column 2 and Table S2, line 6). Of note, for these experiments the ionic strength of the buffer was lowered to 50 mm NaCl to allow for protein–lipid interactions. Control experiments showed that at such moderate ionic strength without lipids, dynamin did not exhibit a measureable FRET signal (Table S2, compare lines 2 and 3). This conclusion is consistent both with the decrease in FRET signal upon the addition of octadecyltrimethylammonium bromide (OcTMAB™) (Table S2, line 10), an inhibitor that blocks dynamin–phospholipid interaction 16, and with the ability of the tagged proteins to form helices around liposomes as observed by electron microscopy (Figure S2A). FRET was only observed if the donor and acceptor were present on the N-terminus of dynamin (Figure S2B). In addition, no FRET was observed if dynamin was induced to aggregate by instantly lowering the salt concentration below 10 mm NaCl (Figure 1A, column 3). Together, these data suggest that only controlled oligomerization of dynamin into helices around lipid templates would generate a positive signal.
Upon addition of liposomes, the histograms of the lifetimes in the whole image shift toward faster lifetimes (note the difference between the gray line and red line, Figure 1B). FRET efficiencies could then be determined based on the measured lifetimes. Thus, slow lifetimes represent FRET efficiency <20% and are color-coded in blue (no FRET, Figure 1A, discrete colors). Fast lifetimes, which represent FRET efficiency ≥20%, are color-coded in red (positive FRET, Figure 1A,C, discrete colors). The discrete color scheme allows for better spatial visualization of the FRET signal. The positive FRET signal was concentrated in small patches throughout the sample, consistent with the formation of dynamin helices on lipid tubules (Figure S2A). Furthermore, the amount of positive signal was time dependent, demonstrating that an adequate length of time is needed for dynamin to oligomerize around the lipid tubules (Figure 1B,C). Indeed, dynamin is routinely allowed to interact with lipid templates for ∼30 min prior to kinetic or electron microscopy analysis (e.g. 3, 7-9).
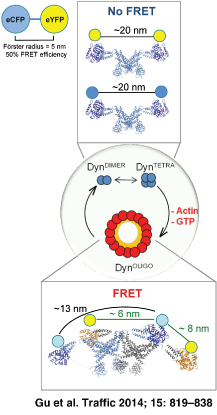
The observed positive signal for DynOLIGO is congruous with the solved crystal structure of DynDIMER 2, cryo-EM 8, a pseudoatomic model of DynOLIGO 17, and modeling data using the solved structure of DynDIMER 2, 18. The fluorophores situated on each N-terminus of DynDIMER are predicted to be ∼18 nm apart, which is too far to allow for FRET to occur [Figure S3A,B and 2]. Based on cryo-EM 8, a pseudoatomic model of DynOLIGO 17, and modeling data 2, the GTPase domains of a dimer in a ring are predicted to be ∼13 nm apart, still too far to allow for FRET to occur. However, the GTPase domains of two neighboring dimers within a ring might be in close enough proximity to allow for FRET to occur (∼6–8 nm, Figure S3C). Alternatively, positive FRET could come from interactions between the GTPase domains of two adjacent rings within a helix. Regardless of the source of the signal, together these data demonstrate that FLIM specifically measures dynamin–dynamin interactions that occur upon its oligomerization into higher order oligomers, such as helices in the presence of lipid templates.
FLIM detects dynamin oligomerization into rings
To further define the source of positive FRET signal we used a small molecule called Bis-T-23 (2-cyano-N-{3-[2-cyano-3-(3,4,5-trihydroxyphenyl) acryloylamino]propyl}-3-(3,4,5-trihydroxyphenyl)acrylamide) [Figure S4A and 19]. While Bis-T-23 was originally isolated as inhibitor of lipid-stimulated GTPase activity 19, detailed biochemical analysis demonstrated that Bis-T-23 was able to promote dynamin's natural propensity to oligomerize into DynOLIGO (Figure 2A). Therefore, Bis-T-23, rather than inhibiting, actually stimulated the basal GTPase activity of Dyn1 in a concentration dependent manner (Figure 2B). This level of activity is comparable to that elicited by the presence of short actin filaments (Figure 2C) 13, and SH3-domain-containing proteins such as Nck1 12 (Figure 2C and Table S1). Addition of Bis-T-23, furthermore, augmented the actin-stimulated GTPase activity of dynamin, which was initiated by the presence of gelsolin-capped actin filaments (Gsn-actin, Figure 2D). This increase in the rate of GTP hydrolysis is commensurate to that observed in lipid-stimulated GTP hydrolysis upon addition of PS liposomes (Figure 2C,D). Interestingly, the increase in the GTPase activity was observed at dynamin concentrations that are normally too low to support dynamin oligomerization (Figure S4B). We, therefore, speculate that the gain in activity is dependent on dynamin's ability to form DynOLIGO since Bis-T-23 failed to activate the oligomerization-incompetent mutant, Dyn1I690K [Table S1, and 20].

The addition of Bis-T-23 diminished the levels of DynTETRA and DynOCTA on the native gel, but did not affect the levels of dimers (Figure S4C–E). These results are indicative of the formation of DynOLIGO, as previous studies have shown that DynTETRA is necessary for the oligomerization of dynamin into higher order oligomers 20. Also denotative of the formation of DynOLIGO in the presence of Bis-T-23 is the increased amounts of Dyn1 in the pellet upon high-speed centrifugation, as only higher order oligomers can precipitate out of solution (Figure S4F). Finally, electron microscopy confirmed that the presence of Bis-T-23 promoted dynamin oligomerization into rings and partial rings (Figure 2E,F). The dimension of dynamin rings (∼40 nm in diameter) has previously been reported to be an intrinsic property of the enzyme 21. The formation of rings and partial rings would, therefore, account for the observed fivefold increase in GTPase activity by the addition of Bis-T-23. Together, these data suggested that the originally observed inhibitory effect of Bis-T-23 in lipid-stimulated GTPase activity 19 might have been the result of competition between the formation of dynamin rings by Bis-T-23 (∼5-fold stimulation) and the formation of dynamin spirals (∼50-fold stimulation). Prevailing formation of dynamin rings would thus reduce the overall observed stimulation. Indeed, in the presence of higher dynamin concentration, Bis-T-23 did not exhibit potent inhibition of PS liposome stimulated GTPase activity (Figure 2C and Table S1), nor did it inhibit dynamin oligomerization around lipid templates (Figure S4G). Altogether, these data demonstrate that Bis-T-23 promotes dynamin's intrinsic ability to oligomerize into DynOLIGO (rings and partial rings).
Positive FRET signal was detected in the presence of Bis-T-23, but not in the presence of DMSO or dynamin inhibitors such as Dynole 22 and Dynasore 23 (Figure 3A and Table S2). In addition, positive FRET signal was detected in the presence of Gsn-actin, which is capable of inducing dynamin oligomerization into single rings [Figure 3A and 13]. These data suggest that FRET signal was generated between the GTPase domains of two neighboring dimers within a ring. Consistent with this interpretation, a histogram of the lifetimes in the whole image shows similar distribution of the lifetimes between dynamin in the presence of PS liposomes, Gsn-actin and Bis-T-23 (Figure 3B). The intensity of the positive signal did not correspond to the level of the GTPase activity (Figure 3C). The addition of Bis-T-23 resulted in the highest level of positive signal though it induced only moderate increase in GTPase activity. Together, these data suggest that positive FRET signal was due to interactions horizontally between GTPase domains within partial and full rings and not vertically between GTPase domains between the stacks of rings that form when dynamin assumes a helical state, the latter of which being required for highest levels of the GTPase activity.

Detection of actin-dependent dynamin oligomerization in live cells
In vitro studies suggested that it might be possible to detect formation of DynOLIGO in live cells using FLIM. To this end, Cos-7 cells were transiently transfected with eCFP-Dyn1 both alone and in the company of eYFP-Dyn1. To define the dynamic range of the assay in cells, expression of eCFP-eYFP fusion protein (lacking dynamin) was used to define the maximum achievable FRET (∼77%, Table S3, line 3 and Figure S5). Of note, eCFP and eYFP proteins were found in both the cytoplasm and nuclei of cells. To determine the background, eCFP-Dyn1 was co-expressed with eYFP (an acceptor fluorophore lacking dynamin) (Figure 4A, and Table S3, line 5, ∼13% FRET efficiency). When eYFP-Dyn1 was co-expressed with eCFP-Dyn1, FRET efficiency increased from 13 to 64% (Table S3, line 13, and Figure 4A), indicating a surprisingly high level of constitutive dynamin oligomerization in otherwise untreated cells. To test whether FRET was indeed detecting DynOLIGO and not the formation of DynDIMER and DynTETRA, Dyn1I690K, a mutant incompetent in oligomerization 20, was examined. In accordance with the in vitro FLIM data, Dyn1I690K did not exhibit FRET beyond the background level (Table S3, line 29, Figure S5). Co-expression of Dyn1 with Dyn1I690K resulted in a positive FRET signal (Table S3, line 30 and Figure S5), implying partial oligomerization of hetero-oligomers, consistent with a previous study 20. Together, these data suggest that, as seen in vitro, FLIM experiments in live cells were specifically detecting the formation of DynOLIGO.

Since the positive data are derived from confocal optical sections within the cell, the data also establish that oligomerization occurs within the cell interior rather than specifically at the plasma membrane, as previously believed. Indeed, treatment of cells with methyl-β-cyclodextrin (MβCD), a reagent that binds cholesterol and blocks most forms of endocytosis at the plasma membrane, including clathrin mediated endocytosis and macropinocytosis 24, produced no detectable change in FRET efficiency (Table S3, line 19). In addition, no alteration in the signal was observed when cells were treated with nocodazole, a compound that inhibits microtubule polymerization (Table S3, line 20). Thus, FLIM detected dynamin oligomerization that was neither endocytosis- nor microtubule-dependent.
FLIM might also be detecting actin-dependent dynamin oligomerization, as we have identified the role of actin–dynamin interactions in regulating dynamin oligomerization in vitro [13 and Figure 3]. To test this hypothesis, cellular actin was altered by pretreating cells with different actin-targeting drugs. Latrunculin A (Lat A) sequesters actin monomers, blocking actin polymerization and promoting actin depolymerization [Figure 4B and 25]. Pre-treatment of cells with Lat A greatly decreased FRET efficiency to almost background levels [Figure 4A, and Table S3, line 17]. In contrast, pre-treatment with cytochalasin D (CytoD), a drug that inhibits actin polymerization by binding to growing ends of F-actin and thus generating short actin filaments 26, resulted in maximal FRET efficiency (Figure 4A, and Table S3, line 16). Addition of Jasplakinolide, which binds actin filaments to stabilize them against depolymerization and promote polymerization 27, had no effect on FRET efficiency (Table S3, line 18). The ability of short actin filaments generated by CytoD to promote dynamin oligomerization in cells is consistent with the biochemical analysis and FLIM experiments in vitro (Table S1 and Table S2). Furthermore, a dynamin mutant with impaired affinity for F-actin, Dyn1K/E 13, exhibited a decreased FRET efficiency of 32% (Figure 4C and Table S3, line 23), whereas a dynamin mutant with higher affinity for F-actin, Dyn1E/K 13, increased FRET efficiency to 73% (Figure 4C and Table S3, line 26). Together, these data suggest that FLIM was detecting actin-dependent DynOLIGO in the cytoplasm of live cells.
Unexpectedly, a classic dynamin mutant impaired in GTP binding and hydrolysis, Dyn1K44A, exhibited very low levels of positive signal (Table S3, line 33). In addition, pre-treatment of cells with Dynole, an inhibitor of the GTPase activity of dynamin 22, abolished the positive signal in cells expressing wild type dynamin. This is in contrast to the addition of Bis-T-23, which further increased the amount of positive signal (Table S3, lines 14 and 15, and Figure 4C). Together, these data suggest that the GTPase activity of dynamin is essential for actin-dependent dynamin oligomerization in cells, which can be further promoted by addition of Bis-T-23.
Actin-dependent dynamin oligomerization occurs at distinct sites in Cos cells
To further examine actin-dependent dynamin oligomerization in the cell, we used an alternative assay in which energy transfer occurs between fluorescently labeled anti-dynamin antibodies. Since this experimental approach failed to generate a sufficient amount of signal to follow endogenous dynamin, FLIM analysis was performed by viral expression of non-tagged Dyn1 in Cos-7 cells (Figure S6A) and staining of fixed Cos-7 cells with monoclonal antibodies against the N-terminal GTPase domain and the C-terminal proline and arginine rich domain. To define the dynamic range of the FLIM assay using fixed cells and antibody staining, Cos-7 cells were co-stained using a mouse monoclonal antibody against the GTPase domain (donor fluorophore, alexa488) and either a donkey anti-rabbit antibody (DAR-Alexa 568, negative control, 0% FRET efficiency, Table S4, line 2) or a donkey anti-mouse antibody (DAM-Alexa 568, positive control, 42% FRET efficiency, Table S4, line 3, and Figure S6B). Of note, the images were acquired from the bottom of the cell.
As seen in live Cos-7 cells, FLIM analysis detected positive FRET signal in cells expressing wild type dynamin, but not in those expressing Dyn1K44A or Dyn1I690K (Figure 5A, Table S4, lines 17 and 19, respectively). As observed in live cell, the positive signal was insensitive to inhibition of endocytosis by MβCD (Figure S6B). While addition of Bis-T-23 increased the amount of the positive signal (Figure 5A,B, Table S4, line 15), FRET efficiency was dramatically lower than that observed in live Cos-7 cells (14–17% compared to 64–77%). Since the efficiency of the energy transfer is inversely proportional to the sixth power of the distance between donor and acceptor 28, FRET is extremely sensitive to small distances. Therefore, the observed difference in FRET efficiencies is most likely due to increased distances between donor and acceptor fluorophore when using antibodies (instead of direct coupling of fluorophores to dynamin). Furthermore, fluorophores in live experiments were both present at the N-terminus of the protein, whereas experiments in fixed cells used a combination of N-terminal and C-terminal antibodies. Thus, both of these observations would account for significantly different FRET efficiencies between the two experimental approaches.

In addition to lower FRET efficiencies, there was an overall significant decrease in the amount of positive signal detected in fixed cells compared to live cells, demonstrating significant loss of sensitivity by this experimental approach. Despite these issues, the positive signal required the ability of expressed dynamin to oligomerize (Dyn1I690K in Figure 5) and was dependent on both direct dynamin–actin interactions (DynK/E and DynE/K in Figure 6A), and the status of the actin cytoskeleton in the cell. Thus, treatment of cells with Lat A abolished the positive signal (Figure 6A) whereas addition of Cyto D increased the amount of positive signal (Figure 6A). A histogram of the lifetimes in the whole image shows similar distribution of the lifetimes between the DynE/K mutant and DynWT in the cells treated with Cyto D (Figure 6B), suggesting that the observed positive signal was generated by similar actin-dependent dynamin–dynamin interactions in the cell. Together, these data further support the existence of GTP- and actin-dependent dynamin oligomerization in the cell.

Actin-dependent dynamin oligomerization occurs at distinct sites in podocytes
FLIM assays using labeled antibodies allows for examination of dynamin oligomerization in different cell types. We and others have shown that dynamin is essential for the structure and function of podocytes 29, 30. Podocytes are terminally differentiated cells of the glomerulus that are essential for kidney filtration. The function of these cells is dependent on its structure, which consists of a cell body, microtubule-based major membrane extensions and actin-based minor membrane extensions named foot processes (FPs). Loss of podocyte FPs is directly correlated with proteinuria (a sign that kidney filtration is compromised). In contrast to live and fixed Cos-7 cells, FLIM analysis in podocytes did not detect positive FRET signal (Figure 7A, and Table S5, line 7, 4% FRET efficiency), suggesting that dynamin assembly in terminally differentiated podocytes is tightly regulated even when dynamin is overexpressed in the cell. As in the case of Cos-7 cells, the images were acquired from the bottom of the cell.

Addition of Bis-T-23 resulted in a positive signal (Figure 7A, Table S5, line 9), whereas addition of DMSO had no effect (Table S5, line 8). Bis-T-23 failed to induce dynamin oligomerization in cells expressing Dyn1K/E (decreased affinity for F-actin) or Dyn1I690K (impaired in oligomerization) (Figure S7 and Table S5), further demonstrating that Bis-T-23 was inducing actin-dependent dynamin oligomerization. Importantly, in the absence of Bis-T-23, positive FRET signal was also detected in cells expressing Dyn1E/K (increased affinity for F-actin) (Figure S5, Table S4, line 13). In addition, treatment of cells expressing Dyn1E/K with Lat A abolished positive FRET signals (Table S5, line 15). In contrast, treatment of cells expressing Dyn1E/K with MβCD had no effect on the FRET signal (Table S5, line 14). A histogram of the lifetimes in the whole image shows similar distribution of the lifetimes between cells expressing the DynE/K mutant and cells expressing DynWT after addition of Bis-T-23 (Figure 7B), suggesting that the observed positive signal was generated by similar actin-dependent dynamin–dynamin interactions in the cell. Although expressed dynamin was distributed uniformly throughout the cell interior (Figure 7A, τ1, continuous), positive FRET exhibited site-specific distribution. The signal was primarily concentrated at the leading edge of the cell, where it was localized at the cell membrane, as well as transition zones, where cortical actin transitions into the stress fibers (Figure 7C). Together, these data suggest that FLIM specifically detects actin-dependent dynamin oligomerization into higher order oligomers whose level and distribution exhibits cell-specific characteristics.
Discussion
Actin-dependent dynamin oligomerization
It is well accepted that the ability of dynamin to oligomerize into rings and spirals accounts for the budding of clathrin-coated vesicles at the plasma membrane (reviewed in 3). However, our in vitro study revealed that direct dynamin–actin interactions might also play a role in the regulation of dynamin oligomerization 13. Short actin filaments capped with gelsolin were found to increase the GTPase activity of dynamin and to promote its oligomerization into single rings as observed by electron microscopy. In turn, dynamin oligomers were found to displace gelsolin from the barbed ends, thus implicating dynamin oligomerization in the regulation of actin polymerization. In this study, using FLIM, we expand our original in vitro observation by demonstrating that actin-dependent dynamin oligomerization also occurs in cells.
First, we used dynamin oligomerization into helices around lipid templates to demonstrate that FRET measured by FLIM occurred only upon controlled dynamin oligomerization. By use of Bis-T-23 and Gsn-actin, we show that positive FRET signal was due to interactions between the GTPase domains within partial and full rings and not between the GTPase domains between the stacks of rings formed in a helix, thus identifying a distinct conformational switch within DynTETRA and DynOCTA that occurs upon their oligomerization into rings as a source of positive FRET signal. In cells, three different experimental approaches (live and fixed Cos-7 cells and fixed podocytes) showed that dynamin oligomerization was dependent on direct dynamin–actin interactions, the ability of dynamin to oligomerize into higher order oligomers, and the status of the actin cytoskeleton. By combination of live cell imaging (FLIM in live Cos-7 cells) and fixed cells (Cos-7 and podocytes), our study identified cell type differences in the amount as well as sites of dynamin oligomerization. Thus, in live and fixed Cos-7 cells, dynamin oligomers were detected throughout the cytoplasm, whereas dynamin oligomers in podocytes were predominantly found at the cell membrane.
In both cell types, positive signal was found at the transition zone in which cortical actin transitions to stress fibers. Additionally, in Cos-7 cells but not in podocytes, positive signal was often localized at the cytoplasmic face of the nuclei (Figure 5A), which is consistent with the well-established observation that physical interactions between cytoplasmic actin and the nuclear envelope are known sites of active actin polymerization (e.g. 31). The observed differences could be explained by the fact that podocytes are terminally differentiated, non-dividing cells that contain well-defined focal adhesions and stress fibers, with distinct regions of cortical actin cytoskeleton supporting formation of lamellipodia and filopodia 13. In contrast, Cos-7 cells, which are constantly dividing in culture, contain few short well-defined stress fibers and are mostly supported by a highly dynamic cortical actin cytoskeleton that supports the formation of large lamellipodia and cell migration [Figure 2B and 32]. Since the positive signal was spatially distinct and influenced by the status of the actin cytoskeleton (as determined by treatment with Lat A and Cyto D) in both cell types, our study suggests not only cell type-specific regulation of dynamin oligomerization but also tight spatial regulation of actin-dependent dynamin oligomerization in the cell.
In addition, our study identifies Bis-T-23 as a small molecule that promotes intrinsic dynamin propensity to oligomerize into partial and whole rings in an actin-dependent manner in the cell. Bis-T-23, therefore, could not induce oligomerization of DynK/E or DynI690K (Table S5). However, because Bis-T-23 could induce oligomerization of DynK/E in vitro (Table S1), it can be inferred that Bis-T-23 specifically promotes actin-dependent dynamin oligomerization in cells, thereby identifying it as reagent to study the novel role of actin-dependent dynamin oligomerization in the cell.
While FLIM did identify DynOLIGO at the membrane, those oligomers were not dependent on active endocytosis. In fact, membrane-associated dynamin oligomerization was also actin-dependent (inability of MβCD to abolish the positive signal and ability of Lat A to abolish the positive signal in podocytes expressing DynE/K mutant). The inability of FLIM to detect endocytosis-dependent dynamin oligomerization at the membrane is most likely due to the nature of FLIM, which requires a threshold amount of energy transfer between the fluorophore-labeled species of dynamin. This threshold amount simply was not met during endocytosis. The same might apply to dynamin oligomerization on microtubules. That said, our study does suggest that it might be worth re-examining the mechanism by which dynamin oligomerizes on the membrane. Thus, identification of DynOLIGO at distinct sites at the cell membrane by FLIM is consistent with a previous study using total internal reflection fluorescence (TIRF) microscopy coupled with a number and brightness analysis in live mouse embryo fibroblasts expressing Dyn2-eGFP 33. This study demonstrated that dynamin exists primarily as a tetramer throughout the entire cell membrane, aside from punctate structures that corresponded to DynOLIGO. While the authors believe that sites of dynamin oligomerization might correspond to regions of membrane vesiculation (formation of clathrin-coated vesicles), our study suggests that the observed dynamin oligomerization at the membrane might have been actin-dependent.
Actin-dependent dynamin oligomerization requires its GTPase activity
It was surprising that actin-dependent dynamin oligomerization was dependent on dynamin's ability to bind and hydrolyze GTP. Dyn1K44A, a well known dominant-negative mutant of dynamin impaired in GTP binding and hydrolysis, did not exhibit significant amount of oligomerization. Similarly, loss of dynamin oligomerization was observed if cells were pre-treated with Dynole, a potent inhibitor of dynamin's GTPase activity 22. Therefore, in contrast to lipid-promoted dynamin oligomerization into helices, actin-dependent dynamin oligomerization in the cell is dependent on the enzyme's ability to bind and hydrolyze GTP. This insight provides the molecular mechanism by which expression of Dyn1K44A affects actin cytoskeleton in cells. Accordingly, expression of Dyn1K44A significantly reduced the formation of F-actin comets generated by either Listeria 34 or vesicles formed through overexpression of 1-phosphatidylinositol 5-phosphate kinase 35. Furthermore, when expressed in PtK1 cells, Dyn1K44A decreased the dynamics of cortical actin followed by GFP-capping protein 36. Additionally, it has been shown that expression of Dyn1K44A decreased osteoclast resorption and migration, whereas overexpression of wild type dynamin increased these processes 37. Expression of Dyn1K44A resulted in drastically reduced extracellular matrix degradation at invadopodia (specialized plasma membrane protrusions through which invasive cells make contact with the extracellular matrix) by altering their morphology 38. Finally, it has been recently shown that remodeling of lamellipodial actin filaments by dynamin 2 in U2-OS cells was endocytosis-independent but required the GTPase activity of dynamin 39.
While these compelling studies provided a distinct role for dynamin's GTPase cycle in the regulation of the actin cytoskeleton at distinct sites in cells, our study suggests that the observed phenotypes are due to impairment in actin-dependent dynamin oligomerization. In summary, our study identifies actin-dependent dynamin oligomerization that is dependent on dynamin's ability to bind and hydrolyze GTP. The highly dynamic reorganization of the actin cytoskeleton at these sites asserts a novel role for dynamin oligomerization in the cell, that in regulating cytoskeletal dynamics.
Materials and Methods
Materials, antibodies and standard techniques
GTP (lithium salt) and MβCD were from Sigma Aldrich, Dynole (Abcam), Bis-T-23 (Aberjona Laboratories, Inc.) and Dynasore (Sigma) were prepared as 30 mm stock solutions in DMSO and stored frozen. The required amounts were added to the reaction vessel, achieving final DMSO concentrations of 1% or less. DMSO from Sigma (0.1–1%) was used as a control vehicle in all experiments. Two types of monoclonal mouse anti-dynamin antibodies were used: Hudy 1, an antibody specific to the PRD domain of Dynamin (EMD Millipore) and anti-GTPase, an antibody specific to the GTPase domain of Dynamin (Mouse Anti-Dynamin 1, Chemicon). Antibodies were conjugated using Alexa Fluor 488 or Alexa Fluor 594 (Invitrogen). BN-PAGE was performed using a Native PAGE Novex Bis–Tris Gel System (Invitrogen) according to the manufacturer's protocol. Dynamin was purified using GST-SH3 domain of amphiphysin II as described 15. GTPase assays were performed as described 40 in a buffer solution containing 20 mm HEPES–KOH pH = 7.5, 100 mm KCl, 2 mm MgCl2, 1 mm DTT and Malachite Green Stock Solution (1 mm Malachite Green, 10 mm ammonium molybdate in 1 N HCl), except for PS liposomes which were performed at 50 mm KCl to allow for dynamin–lipid interactions. PS liposomes (Sigma) were generated as described 15, and Gsn-actin was generated as described 13. The pelleting of DynOLIGO upon high-speed centrifugation was performed in a buffer containing 20 mm HEPES, 1 mm MgCl2, 1 mm EGTA (pH = 7.5) and indicated concentrations of NaCl
Transmission electron microscopy
Dyn1 (1 µm), Bis-T-23 (30 µm) and Gsn-actin (5 µm) were mixed in an actin polymerization buffer. The samples were diluted 150-fold, in the same buffer before being applied to the grids. Carbon-coated grids were glow-discharged and then the protein samples were placed on surfaces of the grids at RT for 3 min. The grids were blotted with filter paper and the samples were stained with 1% uranyl acetate for 1 min, washed three times, dried at room temperature, visualized at 100 kV (Phillips CM12), and imaged at magnifications ranging from 3000× to 35 000×.
Membrane tubulation assay
Liposomes were formed using equal parts phosphatidylcholine and PS (Sigma). Lipids were mixed at 10 mg/mL concentrations in chloroform and the solvent evaporated under nitrogen on ice and then dried further under vacuum for 30 min. Dried lipids were hydrated in 0.25 m sucrose at 50°C for 2 h. The solution was clarified by centrifugation at 10 000 × g for 10 min and stored at −20°C until used. Thawed lipids were diluted to 0.2 mg/mL with PBS in the presence or absence of 0.4 mg/mL dyn1 protein 41. Tubulation was assessed after 15 min in the electron microscope after negative staining of protein–liposomes solutions with 1% uranyl acetate.
Cell culture
Cos-7 cells were grown in DMEM containing 10% fetal bovine serum supplemented with antibiotic/antimycotic (all from Invitrogen). Mouse podocyte cell lines were grown as described in 42. Adenoviral infections of cultured podocytes were performed as described 29.
FLIM
FLIM is a morphology based FRET technique that can reveal close protein–protein proximity in intact cells. The fluorescence lifetime of a high energy donor fluorophore may be influenced by its surrounding micro-environment, and is shortened in the immediate vicinity of a lower energy FRET acceptor fluorophore. Non-radiative energy transfer occurs between a donor and acceptor if these are within the Förster distance (R0) of roughly 100 Å (10 nm) and results in a shortened fluorescence lifetime of the donor. The degree of lifetime shortening is inversely proportional to the 6th power of the distance between the fluorophores, and lifetimes can be visualized with sub-cellular spatial resolution in a pseudo-colored lifetime image. Thus, detection of the shortened lifetimes demonstrates FRET and indicates spatial proximity of the two labeled molecules.
In vitro
Vectors expressing eCFP and eYFP N- and C-terminally tagged dynamins were generated using peCFP (enhanced CFP) and peYFP (enhanced YFP) vectors (Clontech). In order to keep dynamin activity intact, a 7 amino acid linker between the fluorescent proteins was situated at the N-terminus of Dyn1. eCFP- and eYFP-Dyn1 were purified using GST-SH3 domain of amphiphysin II as described 15. Recombinant proteins were dialyzed overnight into buffer containing 150 mm NaCl, 20 mm HEPES pH 7.0, 1 mm EGTA, and 1 mm MgCl2 (HCB150). Unless otherwise indicated, 10 μL of 5 µm tagged dynamin was incubated with 0.8 µm PS liposomes, 70 µm OcTMAB, 10 µm Gsn-actin (G1:A50) or 10 µm Dynole for 10 min prior to FLIM. Following incubation, 5–10 μL of the recombinant protein was placed within a microcapillary tube and FLIM was performed as described below.
In live Cos-7 cells
FLIM was performed on live Cos-7 cells 18 h post-infection. When indicated, cells were treated with 10 mm MβCD (Sigma Aldrich), 3 µm jasplakinolide (Molecular Probes), 1 µm Cyto D (Sigma Aldrich), 3 µm nocodazole (Sigma Aldrich), and 0.2 µm Lat A (Sigma Aldrich), or 10 µm Dynole for 20 min prior to data collection.
In fixed Cos-7 cells and podocytes
FLIM was performed on fixed Cos-7 cells or podocytes. Unless otherwise indicated, cells were treated with 10 mm MβCD (Sigma Aldrich), 1 µm Cyto D (Sigma Aldrich) or 0.2 µm Lat A for 20 min prior to fixing. Cells were fixed using 4% formaldehyde and stained with anti-GTPase antibodies conjugated with Alexa Fluor 488 (donor fluorophore) and Hudy 1 conjugated with Alexa Fluor 594 (acceptor fluorophore).
FLIM experiments were performed using a Chameleon pulsed laser at 800 nm coupled with a Zeiss LCM510 microscope to induce two photon excitation of eCFP or Alexa Fluor 488. Imaging occurred using 25× (in vitro and in live Cos-7 cells), 63× or 100× oil immersion objective lenses (fixed Cos-7 cells and podocytes, respectively). A high-speed microchannel plate detector (MCP5900; Hamamatsu, Japan) and hardware/software package from Becker and Hickl (SPC830) were used to measure the fluorescence lifetimes on a pixel-by-pixel basis via time-correlated single photon counting (TCSPC). The lifetimes (τ1) were curve fitted to a two exponential decay curves with one exponential fixed (τ2) at the average lifetime for donor only fluorophore (eCFP-Dyn, and Alexa Fluor 488- GTPase antibody). The remaining variable exponential reveals the presence or absence of a shortened lifetime for each pixel within each image as well as the relative amplitude compared to the amplitude of the fixed lifetime component. FRET efficiency is the percent of lifetime decrease, and was calculated: E = 1 − (τDA/τD) × 100; where τDA is lifetime of the sample with donor and acceptor, and τD is the lifetime of just the donor (non-FRET lifetime).
When indicated in the figure, positive signal was defined as ≥20% of FRET efficiency (for example, if τ2 was fixed at 2100 picoseconds as in the case of recombinant eCFP-Dyn1WT, then all lifetimes τ1 that were equal or faster then 1700 picoseconds represent ≥20% of FRET efficiency, and are shown in red). Thus, the cut of for ≥20% of FRET efficiency in each case was defined based on the value of fixed τ2.
All FLIM data (in vitro and in cells) were collected over a period between 6 and 8 min using the same instrument. In all experiments, the collected counts were in the range of 3 × 10⁴–2 × 10⁵. The fluorescence lifetime (τ1) of a fluorophore (eCFP or Alexa Fluor 488) can be represented by a multi-exponential decay function where t = a1e-t/τ1 + a2e-t/τ2 + a3e-t/τ3 + ane-t/τn. The average lifetime for a particular region of interest was calculated from the lifetime values from each pixel in that region or cell. In addition, eCFP or Alexa Fluor 488 images alone did not show biexponential decay. For statistical analysis of residuals, two-tailed test was used.
Acknowledgments
This work was supported by the National Institutes of Health (NIDDK R01 DK087985 and DK93773 to S. S. and R37-HL036153 to W. L.). The authors wish to thank Nick N. Gorgani, Phillip J. Robinson and Adam McCluskey for sharing their insight that Bis-T-23 promotes dynamin oligomerization.