Spatial organization of cellulose microfibrils and matrix polysaccharides in primary plant cell walls as imaged by multichannel atomic force microscopy
Summary
We used atomic force microscopy (AFM), complemented with electron microscopy, to characterize the nanoscale and mesoscale structure of the outer (periclinal) cell wall of onion scale epidermis – a model system for relating wall structure to cell wall mechanics. The epidermal wall contains ~100 lamellae, each ~40 nm thick, containing 3.5-nm wide cellulose microfibrils oriented in a common direction within a lamella but varying by ~30 to 90° between adjacent lamellae. The wall thus has a crossed polylamellate, not helicoidal, wall structure. Montages of high-resolution AFM images of the newly deposited wall surface showed that single microfibrils merge into and out of short regions of microfibril bundles, thereby forming a reticulated network. Microfibril direction within a lamella did not change gradually or abruptly across the whole face of the cell, indicating continuity of the lamella across the outer wall. A layer of pectin at the wall surface obscured the underlying cellulose microfibrils when imaged by FESEM, but not by AFM. The AFM thus preferentially detects cellulose microfibrils by probing through the soft matrix in these hydrated walls. AFM-based nanomechanical maps revealed significant heterogeneity in cell wall stiffness and adhesiveness at the nm scale. By color coding and merging these maps, the spatial distribution of soft and rigid matrix polymers could be visualized in the context of the stiffer microfibrils. Without chemical extraction and dehydration, our results provide multiscale structural details of the primary cell wall in its near-native state, with implications for microfibrils motions in different lamellae during uniaxial and biaxial extensions.
Introduction
The primary cell wall functions as a key control point for plant growth, morphogenesis and mechanics. Understanding its structure and its remarkable ability to extend irreversibly in surface area, yet to maintain sufficient mechanical strength to resist the wall stresses generated by cell turgor pressure, remains a central problem in this field.
Most current thinking of primary cell wall structure is dominated by the results of biochemical analysis of isolated wall polymers, which are imaginatively configured into molecular-scale models intended to account for polymer arrangements within cell walls, with implications for the mechanisms of cell wall growth and mechanics (Talbott and Ray, 1992; Carpita and Gibeaut, 1993; Frankova and Fry, 2013; Cosgrove, 2014). For instance, the oft-depicted ‘tethered network’ model posits that cellulose microfibrils are well separated by pectins and xyloglucans but mechanically linked into a load-bearing molecular network by extended xyloglucan chains that noncovalently bind to microfibril surfaces or become entrapped within microfibrils (Fry, 1989; Hayashi, 1989; McCann and Roberts, 1991). Recent results based on solid-state nuclear magnetic resonance (ssNMR) indicate fewer xyloglucan–cellulose contacts within the wall than previously assumed, but instead find abundant pectin–cellulose interactions (Dick-Perez et al., 2011; Wang et al., 2012, 2015). Other results based on AFM and in vitro binding likewise implicate pectins as potential control points for cell wall mechanics (Zykwinska et al., 2007; Peaucelle et al., 2011, 2015). Consequently pectins are sometimes depicted as tethers between cellulose microfibrils, parallel with xyloglucan tethers. There is, however, little information about the actual shape and conformation of matrix polymers within cell walls. Moreover, the central role of xyloglucan as the major load-bearing linkage between cellulose microfibrils was cast into doubt by genetic results showing relatively minor phenotype in mutants lacking xyloglucan (Cavalier et al., 2008; Park and Cosgrove, 2012a, 2015).
An alternative to the tethered network concept was recently advanced based on the biomechanical effects of substrate-specific endoglucanases (Park and Cosgrove, 2012b). The results contradicted the concept of xyloglucans as load-bearing tethers between microfibrils. Instead, tight cellulose–cellulose junctions, dubbed ‘biomechanical hotspots’, were inferred as key sites for control of cell wall creep, e.g. by expansins and possibly plant endoglucanases. A minor, relatively inaccessible xyloglucan component was implicated within these sites, closely interacting with disordered cellulose chains at the junctions between two or more microfibrils. A similar structure was identified by ssNMR as the site of expansin binding within complex cell walls (Wang et al., 2013) and molecular dynamics simulations (Zhao et al., 2014) provided additional support for the potential mechanical role of tight cellulose–xyloglucan–cellulose junctions. In cell walls of an Arabidopsis mutant lacking xyloglucan, sensitivity to the wall-loosening action of expansin was reduced but not eliminated (Park and Cosgrove, 2012a) and cellulose microfibril organization became less dispersed (Xiao et al., 2016), suggesting that some cellulose–cellulose junctions can form without xyloglucan.
The hotspot model implies relatively infrequent load-bearing junctions, shifting the focus of attention from the nm scale (typical of molecular models) to larger scale features. Mesoscale characteristics include the packing and bundling of cellulose microfibrils within individual lamellae, the spatial extent and continuity of individual lamellae (do they encompass the whole cell, only one face, or just part of one face?), the stacking of sequential wall lamellae and their microfibril orientations, and the interactions between lamellae. Although some of these points were investigated previously by electron microscopy (Boyd and Foster, 1975; McCann et al., 1990; Vian et al., 1993), technical limitations of those studies precluded full answers, so closer scrutiny of these features of primary cell walls with modern techniques and perspectives is needed.
In this study we focused on the outer (periclinal) epidermal wall, which plays a particularly important role in growing tissues. It is a multilayered, protective and extensible wall that bears much of the mechanical stress of growth-generated ‘tissue tensions’ and consequently assumes key importance in limiting organ growth (Kutschera, 2008; Baskin and Jensen, 2013). The outer epidermal wall also figures prominently in recent biophysical models of plant morphogenesis which connect the pattern of cell wall stress with cytoskeletal organization and intercellular auxin flows (Kierzkowski et al., 2012; Routier-Kierzkowska et al., 2012; Sampathkumar et al., 2014a,b). An understanding of its structure thus touches on many aspects of plant growth and mechanical behaviours.
One puzzling structural aspect of the outer epidermal wall is that its cellulose organization has variously been described as random, transverse, crossed polylamellate or helicoidal (Carpita et al., 2001; Kutschera, 2008; Geitmann, 2010). A helicoidal wall is one in which the microfibrils in successive lamellae rotate progressively at a small, constant angle in clock-like fashion (Neville, 1985; Vian et al., 1993; Emons and Mulder, 1998). Clarification of this architectural point is important for relating wall mechanics and growth to cell wall structure.
For this study we took advantage of recent advances in AFM instrumentation and techniques to examine the newly deposited surface of the outer epidermal wall of onion scales. The onion epidermis is readily peeled as a large sheet, enabling combined mechanical and spectroscopic studies of polymer rearrangements during deformations (Wilson et al., 2000; Hepworth and Bruce, 2004; Suslov et al., 2009; Kafle et al., 2014). Unlike previous studies which made use of an intact layer of cells from the adaxial epidermis, e.g. (Vanstreels et al., 2005; Suslov et al., 2009; Pieczywek and Zdunek, 2014), our procedure made use of the abaxial epidermis, which has a different peeling behaviour: the epidermal cells are ruptured upon peeling, producing in a thin sheet consisting only of the outer epidermal wall (~2 to 4 μm thick) with small stubs of the side walls (Zhang et al., 2014; Kim et al., 2015). With this simple technique, the most recently deposited wall surface (the inner surface next to the plasma membrane) is open for AFM imaging. Never-dried, imaged under water, and treated only with buffered detergent to remove membranes and cytoplasmic residues, the wall is in a near-native state, so the potential for structural rearrangements due to dehydration or extraction is greatly reduced compared with EM-based methods. Using AFM, we characterized large-scale microfibril patterns (orientation, bundling) in surface lamellae in the onion epidermal walls, along with the change of microfibril angles in successive lamellae. Additionally we adapted nanomechanical mapping by AFM to produce two-color merged images that highlight the location of matrix polymers, their spatial relationship with microfibrils and their mechanical properties. Comparison with FESEM images clarifies the differences between these two high-resolution imaging methods and the distinct insights that can be gained from each of them.
Results
Characterization of microfibril shape, orientation and bundling in surface lamellae
We prepared 1 × 1 cm sheets of outer epidermal cell walls of onion scales for AFM imaging of the surface closest to the plasma membrane. Surfaces were scanned with a tip of 3- to 4-nm diameter at 512 × 512 pixel resolution using PeakForce Tapping® mode and ScanAsyst® software for AFM parameter settings. At a 2 × 2 μm scale, microfibrils were readily seen in PeakForce error images as single microfibrils that merged into and out of short bundles of well aligned microfibrils (Figure 1). Images based on PeakForce error provide higher clarity of microfibrils by flattening the image and emphasizing edges. Microfibrils in surface lamella were generally oriented in the same direction, with some dispersion, giving the lamella a clear net directionality. Gaps in the surface lamella revealed one or sometimes two underlying lamellae in which the microfibrils were oriented at ~30 to 90° to the overlying lamella. When sampled at different locations across a single epidermal cell, microfibril orientations were consistent across the first (superficial) lamella; that is, they did not change gradually or abruptly. A similar consistency in orientation was seen in the second lamella, although it was oriented at a distinctive angle to the first lamella. These observations indicate that lamellae are continuous across the entire outer periclinal wall.
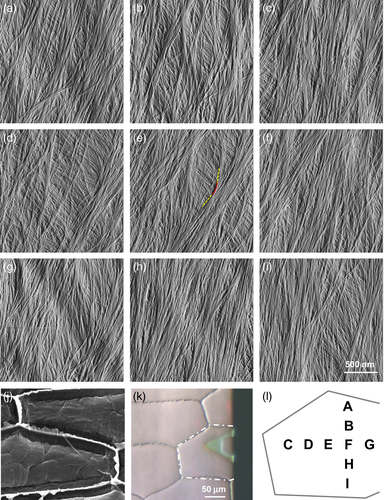
Microscopic analysis of the newly deposited surface of the outer epidermal cell wall prepared from onion scales. (a–i) AFM images at different locations of the same cell wall surface. In (e) a curved microfibril is highlighted; the red line highlights the curved region, the yellow lines highlight the relatively straight portions of the microfibril.
(j) FESEM image of the inner surface of an onion epidermal peel, the same material used for AFM.
(k) Light micrograph showing the AFM hovering above the peeled epidermal wall; the scanned cell is highlighted by white dash line.
(l) Map of locations of scanned cell wall areas (a–i) within the cell shown in (k).
This conclusion is further supported by montages made by overlapping AFM images (Figure 2), which give the high resolution needed to observe individual microfibrils as well as the larger scale to observe the mesoscale pattern of microfibril orientations, packing and bundling. In ten such montages, the microfibril direction in the surface lamella was found to be uniform (though differing in each montage), with no evidence of discontinuities or systematic change in microfibril orientation of the surface lamella, with allowances for the microfibril dispersion evident in these cell walls. Hence we conclude that lamellae are continuous and unbroken across the entire outer wall surface and are deposited with a consistent microfibril direction.
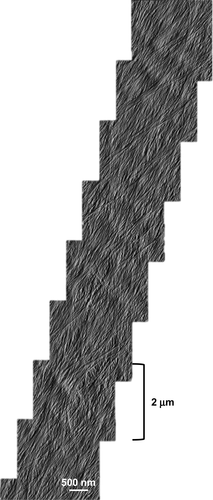
A montage of high-resolution AFM images over an extended area, revealing extensive microfibril bundling with microfibrils merging into and out of bundles, forming a reticulated network.
This image is representative of ten such montages collected.
For geometrical reasons we could not use this method to follow the microfibrils close to the edge where the outer wall of the epidermis merges with its side walls, which are only short stubs in these samples. Because the outer wall is much thicker than the side walls (Ng et al., 2000; Suslov et al., 2009), it seems likely that many lamellae in the outer wall do not continue into the side walls. This conclusion is consistent with a FESEM study of Arabidopsis epidermal cell walls, showing a discontinuity at the line where the outer wall meets the side walls (Crowell et al., 2011).
The diameter of single microfibrils in the wall was estimated from high-resolution height maps (Figure 3) to be 3.4 ± 0.3 nm based on relative height and 3.6 ± 0.4 nm based on width, deconvoluted for tip diameter (means ± standard deviation (SD), n = 50). The mean value of 3.5 nm is consistent with the dimensions published for single cellulose microfibrils (Newman et al., 2013; Kuramae et al., 2014), and therefore it appears that matrix polysaccharides do not adhere to the single microfibrils selected for size analysis. Alternatively adherent polysaccharides may be highly compliant, escaping AFM detection.
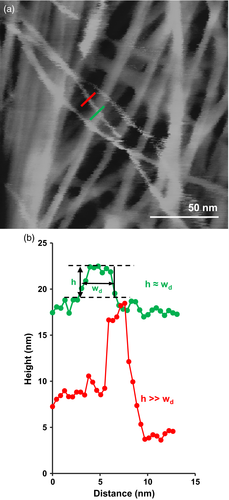
Microfibrils were often seen to bend in the plane of the wall with a smooth curvature before merging into bundles (see color microfibril in Figure 1e). Such gentle bending should result in an extension of the convex surface and a compression of the concave surface, with a strain calculated to be 0.3 ± 0.1% (mean ± SD, n = 50) (Figure S1). Such strain is within the elastic range of cellulose which consists of an array of glucan chains that are hydrogen-bonded laterally to form flat ribbons, stacked in a manner to form distinctive surfaces of hydrophobic and hydrophilic character and with different moduli in the three orthogonal directions (Wu et al., 2014). Because cellulose bends most easily in the direction perpendicular to the hydrogen bonded plane, we infer from the microfibril bending that the hydrophilic surfaces of the microfibril are likely at the top and bottom of the microfibril, as viewed in these images, and the hydrophobic surfaces are at right angles to the plane of the cell wall. Assuming this orientation is maintained into the bundled regions (see below), microfibrils within a lamella would appear to make contact via their hydrophobic surfaces. Furthermore, the smoothness of the curved regions suggests that there is little or no inherent microfibril twist, at least within the curved regions, for otherwise a more erratic curve would be expected due to the microfibril anisotropies (think of trying to bend a flat metal band). This point is relevant to computational models of cellulose structure which predict microfibril twisting and helical conformation (Ciesielski et al., 2013). This line of reasoning argues against inherent microfibril twisting in these never-dried walls.
Close examination of the AFM montages (Figure 2) reveals that microfibrils weave into and out of bundled regions, forming a reticulated network. The short bundled regions often have a smooth surface that masks fibrillar features, indicating close packing of microfibrils that may be coated with relatively rigid matrix polymers. The extent of microfibril bundling was quantified by measuring the width of single microfibrils and microfibril bundles, using the approach shown in Figure 3 (Methods S1). Widths ranged from 3 to 56 nm; for histogram analysis they were binned by the width of a single microfibril, 3.5 nm (Figure 4a). Approximately 60% of the counts were the width of a single microfibril, 20% were the width of two microfibrils, and the remainder were estimated to contain 3 to >10 microfibrils. When these counts were weighted by the estimated number of microfibrils in each bundle, we calculated that ~33% of the length of the average microfibril is found as a singleton, ~23% as a doublet and the remaining 44% as bundles of 3 to >10 microfibrils (Figure 4b). These estimates are based on the superficial lamella and assume that matrix polymers do not make a substantial contribution to the measured bundle width and that bundles are only one microfibril thick (i.e., microfibrils below the surface are not counted in this estimate). These values, which must be viewed as a first-order approximation of the extent of bundling, indicate that ~1/3 of the total microfibril length in this wall material is unbundled.
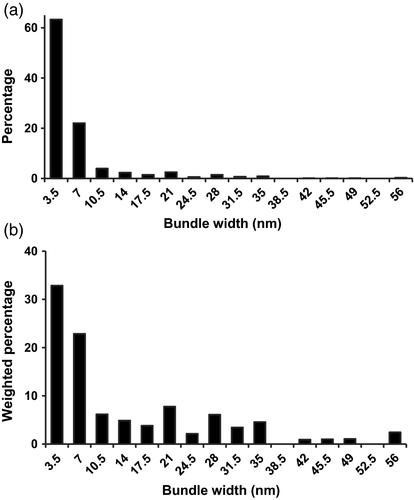
Histograms showing the distribution of width for microfibrils and microfibril bundles in the first lamella.
The widths of 341 microfibrils or bundles were measured from three independent montages, using the approach shown in Figure 3.
(a) Histogram binned by 3.5 nm (the width of a single microfibril).
(b) Histogram as in (a), but weighted by the number of microfibrils in the bundle.
A crossed-polylamellate, not helicoidal, structure
The surface view of these epidermal walls suggests a crossed-polylamellate structure with alternating microfibril orientation in sequential lamellae, with ~40 nm between the surface lamellae (Figure 5a). This is distinctive from a helicoidal structure which is defined by a clock-like rotation of microfibril orientations in continuous or small (~15°) steps. Microfibril orientation in sequential lamellae varied by large steps (61.9° ± 16.4°, mean ± SD, n = 15). When three lamellae were visible, we found that the microfibril angles did not progress consistently in a clock-like manner, but appeared to change in their clock direction and by variable increments (Figure 5b). These results likewise indicate a crossed-polylamellate structure.
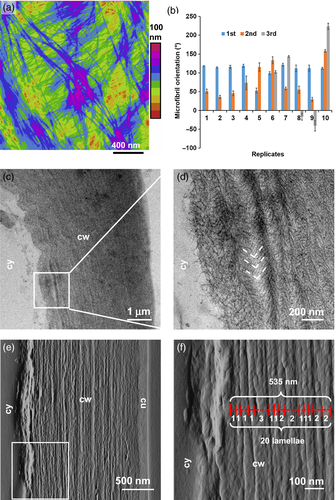
Polylamellate structure of onion epidermal wall.
(a) AFM height map of wall surface, color coded with the height scale indicated at right (step size = 10 nm). The distance between microfibrils in the two visible lamellae is ~30 to 40 nm.
(b) Microfibril orientations of up to three visible lamellae, measured from montages of AFM images across a large area (>30 mm2). Means ± standard deviation (SD) of five microfibrils. First is the surface lamella, second is the lamella below the first, and third is the lamella under the second.
(c) TEM images of the oblique sections of onion epidermal walls suggested multi-layer structure.
(d) Close-up image show the herringbones and layers.
(e) Peak force error image of the cross section of onion epidermal wall.
(f) Close-up image scanned from the white square in (e). The annotations show that the average lamella thickness is calculated by measuring the thickness across multiple lamellae and counting the number of lamellae included. cy, cytosol; cw, cell wall; cu, cuticle.
A conventional method to assess helicoidal wall structure uses transmission electron microscopy (TEM) of oblique cross-sections of swollen cell walls oxidized with periodate and stained with silver proteinate (Kutschera, 2008; Lloyd, 2011). In such images, helicoidal walls are said to exhibit a smooth, crescent-like pattern of arcs across lamellae whereas cross lamellate walls may give a coarse, V-shaped ‘herringbone’ pattern. In onion epidermal walls prepared this way, we observed multilayered structures, in most cases with V-shaped herringbone patterns near the innermost cell wall surface (316 out of 349 images) and other cases without an interpretable order, but never with crescent-like arcs (Figure 5c,d). These results confirm a crossed-polylamellate wall.
To assess the multilayer structure by yet another method, epidermal walls were dehydrated, embedded in soft resin, cross-sectioned and scanned by AFM (Figure 5e,f). Many lamellae were evident, with an average thickness of 40 ± 17 nm (mean ± SD, n = 20), consistent with the lamella thickness estimated by the height profile from AFM surface scans (46 ± 16 nm, mean ± SD, n = 41) (Figure 5a). The surface scans also indicate that the microfibrils were distributed throughout the thickness of the lamella, not concentrated in the middle of the lamella (Figure S2).
To compare this texture with other walls, we used AFM to examine hydrated cell walls from onion parenchyma and from the outer epidermal walls of maize coleoptiles, Arabidopsis petioles, and cucumber hypocotyls. Similar wall textures were observed, but the extent of microfibril bundling appeared to be less in Arabidopsis and cucumber epidermal walls (Figure S3).
Pectin at the cell wall surface
These AFM images highlighted microfibrils, but did not identify matrix polysaccharides, which constitute up to 80% of the dry mass of onion cell walls (Ng et al., 2000). We hypothesized that the AFM probe tapped through the highly hydrated, gel-like matrix during scanning and that the preset tip interaction force (1 nN) was met only when it approached the surface of relatively stiff cellulose microfibrils or other dense structures. Scanning at smaller forces (as low as 100 pN) produced low quality, featureless images, suggesting that matrix polymers in these hydrated cell walls were too mobile and flexible to be visualized by AFM.
Because previous work indicated that pectins overlay cellulose microfibrils at the surface of dehydrated onion cell walls (McCann et al., 1990; Zhang et al., 2014), we attempted to visualize homogalacturonan (HG) in our hydrated walls by adding calcium to the buffer. We expected calcium to cross link unesterified HG (Morris et al., 1982; Jarvis, 1984), resulting in a structure rigid enough to be visible by AFM. Microfibrils that were submerged in calcium-free buffer were visible in height maps, but became obscured upon addition of 10 mm CaCl2, which solidified a superficial meshwork with pore sizes of 20–100 nm (Figure 6a,b). Subsequent addition of the chelator EDTA caused much of the meshwork to disappear (Figure 6c) and the microfibrils to reappear with little change from the start. From these sequential images of the same region of the cell wall under the three varying calcium conditions, we conclude that the wall surface is coated with an HG layer that is normally too soft and mobile to detect by AFM imaging.
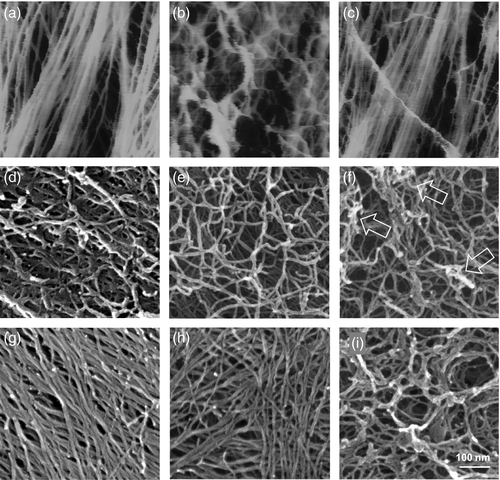
A ramified meshwork at the cell wall surface, as made visible by AFM upon addition of calcium or in FESEM images.
(a–c) The same area of the onion epidermal wall imaged in fluid by AFM. (a) Initial image before adding calcium, showing microfibrils. (b) Upon addition of 10 mm calcium chloride, a superficial meshwork appeared. (c) After adding 10 mm EDTA, most of the meshwork shown in B disappeared.
(d–i) FESEM images of onion epidermal walls prepared in different ways. (d) Control. (e) After 72 h of 50 mm EDTA treatment. (f) Addition of 50 mm calcium after 72 h of EDTA incubation. Arrows point to aggregated regions. (g) After pectate lyase digestion for 16 h. (h) After TEMPO oxidation following pectate lyase treatment. (i) After EDTA extraction for 72 h followed by high-pressure freezing.
To test this conclusion, we imaged the walls with FESEM, wherein the sample was dehydrated and coated with iridium. In place of the microfibrils seen by AFM, we observed an irregular surface of branched polymers of very different appearance (Figure 6d). Pre-treatment with EDTA resulted in a less dense layer of irregular worm-like structures (Figure 6e), suggesting disaggregation and limited removal of pectin. Subsequent addition of calcium resulted in increased aggregation (arrows in Figure 6f). We interpret these FESEM results to mean that the surface of the epidermal walls, adjacent to the plasma membrane, is coated with pectic (and possibly other) substances that obscure FESEM imaging of the microfibril layer.
As a further test, the walls were digested with pectate lyase (PL) prior to FESEM imaging. This enzyme specifically cleaves HG. The worm-like polymers were entirely absent; instead, arrays of oriented, linear microfibrils dominated the surface (Figure 6g). Their general appearance, spatial arrangement and density are generally similar to the microfibrils seen by AFM, but with some notable differences. Compared with AFM, individual microfibrils imaged by FESEM appear fatter and kinked, some with a twisted appearance. The fatter width (7.4 ± 0.1 nm, mean ± SEM, n = 120) may be due to iridium coating (1–2 nm), microfibril aggregation or dehydration-induced adhesion of matrix polymers. Irregularities in the microfibril surface suggest the last possibility. PL-treated walls were additionally treated with TEMPO oxidation. This chemical treatment oxidizes the exposed extracyclic −CH2OH groups to carboxylates, which puts a negative charge on the cellulose surface, causing microfibril repulsion and disaggregation (Isogai et al., 2011). The resulting microfibrils indeed appeared to be less aggregated and individual microfibrils were thinner (5.6 ± 0.1 nm in diameter, mean ± SEM, n = 125), although some aggregated regions persisted (Figure 6h). If the thickness of the iridium coating is taken into account, the microfibril diameter estimated from FESEM images approximates the value measured by AFM. The microfibril patterns were generally similar in appearance to ones seen in AFM images of submerged cell walls, but more dispersed, disordered and kinked after TEMPO oxidation.
The FESEM images shown above were from samples that were dehydrated in ethanol at room temperature followed by critical point drying. Ethanol may cause hydrated polymers to collapse and alter their conformation. We therefore employed rapid high-pressure freezing (HPF) followed by freeze substitution and critical point drying to better preserve and stabilize polymer structure. Walls prepared this way displayed a ring-like lattice with pores ranging from ~5 to 200 nm (Figure 6i). Tilted images for 3D projection reinforce the impression of a structured, sponge-like porous layer (Figure S4).
Multichannel AFM imaging
To assess the spatial relationships between microfibrils and matrix polymers, we made use of AFM nanomechanical data, which are simultaneously collected at each pixel. Our approach was to color code and merge the height image with maps based on modulus, deformation and adhesion. The microfibrils seen in the height image (Figure 7a, bright red) corresponded to regions of high modulus (Figure 7c, bright green); in the merged map they appear as orange–yellow microfibrils (Figure 7d). Regions of low modulus (Figure 7c, black) generally corresponded to spaces between microfibrils, apparently filled with relatively soft matrix polymers. However, we observed some microfibrils with low modulus (Figure 7d arrow pointing to red microfibrils); we interpret these as poorly supported microfibrils, e.g. with nothing or only highly hydrated pectin immediately below them, so they were readily indented by the AFM tip. Note that the modulus measured here is not the tensile modulus of the cellulose microfibril itself but the compressive (indentation) modulus of the assemblage directly under the tip and is influenced by stiffness of both the microfibril and its supporting matrix.
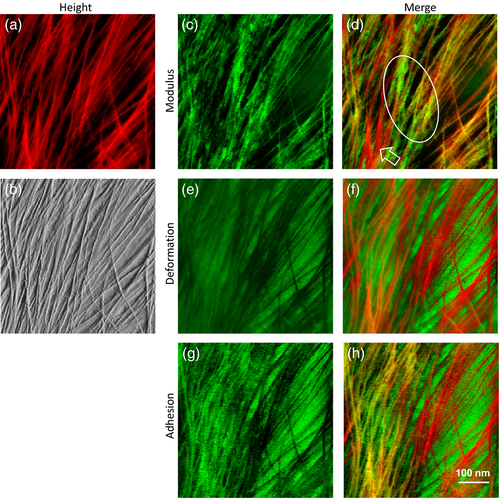
Multichannel AFM imaging to highlight the heterogeneity of cell wall polymer distribution.
(a) Height image of onion epidermal walls.
(b, c, e, g) (b) PeakForce error image, (c) modulus map, (e) deformation map, and (g) adhesion map were captured simultaneously for the same area as (a).
(d) Merged image from (a) and (c). Hollow arrow heads point to the flexible microfibrils with low moduli. Ellipse indicates nonfibrillar rigid regions.
(f) Merged image from (a) and (e).
(h) Merged image from (a) and (g).
These results are consistent with the idea that the microfibrils are embedded in a soft matrix gel. In some regions there were nonfibrillar patches with relatively high modulus (green patches within the white ellipse in Figure 7d) that were not apparent in the height images; we interpret these as relatively rigid matrix regions. Whether these regions contain xyloglucan, rigid pectin or some other polymers is not possible to decide at this time; such regions were generally in close contact with microfibrils, which may play a role in their rigidity.
The deformation map (Figure 7e) complimented the modulus map: inter-fibrillar regions with low modulus showed higher deformation, indicative of a soft matrix. The merged map (Figure 7f) highlights the microfibrils embedded in soft matrix. Weakly supported microfibrils experienced higher deformation and appear orange in this map.
The adhesion map (Figure 7g) shows regions of high adhesion to the AFM tip (i.e. during tip retraction). High adhesion suggests the presence of compliant, sticky polysaccharides, possibly dominated by pectin in these walls. Regions of high adhesion were generally located in the space between microfibrils, consistent with the interpretation of the modulus and deformation maps. The merged map (Figure 7h) highlights the fact that some microfibrils display low adhesion (bright red) whereas others (orange/yellow) show substantial adhesion to the tip; the former may be bare microfibrils while the latter may be microfibrils coated with matrix polymers. We also note that the nonfibrillar green regions highlighted in Figure 7(d) have lower adhesion than adjacent areas; low adhesion could result from matrix polymers of high rigidity, as indicated in the modulus map; additionally, their chemical nature may result in low affinity to the AFM tip. These results show that two-color nanomechanical maps can distinguish soft and rigid components of the matrix and localize them with respect to microfibrils.
Discussion
Our results lead us to four major insights about the architecture of the onion epidermal cell wall: (i) microfibrils, which are selectively visualized by AFM PeakForce error images, weave into and out of bundled regions, forming a reticulated network that is embedded in a soft gel-like matrix; (ii) lamellae span the whole outer wall surface and form a crossed polylamellate, not helicoidal, structure; (iii) a highly pliant, structured pectic layer covers the inner wall surface, obscuring FESEM imaging of the underlying microfibrils and potentially acting as a porous buffer zone between the microfibrils and the plasma membrane; and (iv) two-color mapping of nanomechanical data shows nm-scale details of how microfibrils interact with soft and rigid matrix domains. These points are discussed below.
Implications for cell wall mechanics and microfibril motions
The onion epidermis has proved to be useful as a model for exploring primary cell wall mechanics and polymer movements associated with mechanical deformations. For instance, Wilson et al. (2000) used two-dimensional infra-red (IR) spectroscopy of onion epidermal sheets combined with small-scale mechanical oscillations to show that HG motions occurred first, followed by cellulose motions. The results were interpreted to mean HG has higher mobility than cellulose, which is consistent with NMR-based estimates of pectin mobility (Foster et al., 1996; Wang et al., 2015). Our nanomechanical modulus maps support these inferences with direct mechanical measurements and provide a nanoscale perspective on the distinct spatial locations and rigidities of these two dominant components of the primary wall. Our results also support the common notion that cellulose microfibrils are embedded in a relatively soft matrix, but with the distinction that most of the microfibril lengths are contained in bundles of microfibrils that form a higher-order reticulated network. Microfibril bundling likely changes during development because microfibril alignment increases with developmental age of the onion scale (Kafle et al., 2014).
Microfibril bundling in primary walls has been noted previously (Ding et al., 2014; Zhang et al., 2014), but here we have quantified the extent of bundling and documented that the bundles are interconnected to form a reticulated network – a structural feature likely to be important for wall extension and growth. It is possible that some of the bundled regions involve a local fusion of microfibrils, as inferred from studies of primary wall cellulose by diffraction or spectroscopy (Newman et al., 2013; Thomas et al., 2013a,b). They may also be sites of the ‘biomechanical hotspots’ inferred as selective sites of cell wall loosening by endoglucanases (Park and Cosgrove, 2012b) and expansins (Wang et al., 2013). Finally, microfibril bundling may account for the conclusion of Hepworth and Bruce (2004), based on the mechanical properties of onion epidermis, that ‘the primary cell wall resembles more a knitted cloth than a semisolid composite material’. Microfibril bundling and network formation is a mesoscale feature of primary cell walls that is not captured in most molecule-scale models of cell walls, but it may be key to understanding control of wall extensibility at limited regions of microfibril–microfibril connections. Boyd and Foster (1975) hinted at this concept in their EM study of ‘trellis-like configurations’ of microfibrils in primary cell walls; however, potential dehydration artefacts in the dried cell walls that they studied left the significance of such microfibril contacts open to doubt.
As with other primary cell walls, the mechanical anisotropy of the onion epidermis has generally been attributed to the organization of cellulose microfibrils, with greater compliance found at right angles to the net orientation of cellulose (Vanstreels et al., 2005; Suslov et al., 2009). This concept is based on analogy with composite material made of stiff fibres embedded in an amorphous matrix. While this description is partly true, it does not begin to capture the complexity and hierarchical order we have documented in this study: the onion outer epidermal wall in these samples is composed of ~100 lamellae; within each lamella cellulose microfibrils are generally well aligned with a net orientation, but with bundling that results in a fishnet-like mesoscale organization; and the cellulose orientation between each successive lamella varies by 30–90°. ‘Net orientation’ thus masks considerable structural complexity not present in a simple two-phase system of stiff oriented fibres in a soft matrix. As Ha et al. (1997) stated, ‘the architectural complexity of the system is such that it may be appropriate to consider the hydrated cell wall as a nanostructure rather than as a composite material’.
To see this point explicitly, consider the microfibril motions that likely occur in the different lamellae of an epidermal wall that is stretched by ~25% uniaxially (Wilson et al., 2000; Hepworth and Bruce, 2004; Suslov and Verbelen, 2006). Such stretching elongates the wall in the direction of stress and shrinks it in width, simultaneously inducing large-scale wrinkling parallel to the stretch direction. Assuming large-scale slippage and merger between lamellae does not occur, distinctive microfibril motions must occur in the crossed lamellae, some dominated by sliding between bonded microfibrils, others dominated by lateral separation between microfibrils, and a third category dominated by microfibril reorientation and reduction of the spacing between microfibrils (see Figure S5). Thus, microfibril motions during uniaxial wall stretching are complex and expected to differ according to their initial orientations.
In bidirectional stretching and during two-dimensional surface growth of the epidermis in vivo, wrinkling and in-plane curving of microfibrils is unlikely to occur, but the crossed-polylamellate construction still requires microfibril sliding and lateral separation to occur to different degrees in the lamellae with different microfibril orientations. Whether these two modes of microfibril motion are governed by the same cellulose–matrix interactions is uncertain, but cases of poor correlation between the degree of growth anisotropy and net cellulose alignment suggests separate controls of microfibril sliding and lateral separation (Baskin, 2005; Suslov et al., 2009; Baskin and Jensen, 2013). Slippage between lamellae may be theoretically possible, but seems implausible in internal walls penetrated by plasmodesmata or in outer walls bearing large tissue tensions.
In addition to this complexity, which occurs within a single wall, for whole growing organs such as stems the situation is further complicated by internal walls of the epidermis and of internal cells which may have a transverse cellulose alignment (Chan et al., 2011; Crowell et al., 2011; Baskin and Jensen, 2013). Marga et al. (2005) used FESEM and AFM to image the internal cell walls of cucumber hypocotyls that were allowed to undergo slow uniaxial creep mediated by endogenous expansins or exogenous Cel12A endoglucanase; they did not find evidence of passive reorientation of transverse microfibrils during the wall extension. This result suggests a pattern of transverse microfibril motions similar to that shown in Figure S5(c). In that report, as well as in many other FESEM and AFM studies, the walls were dehydrated and the microfibril patterns lacked the clarity that is seen here with AFM PeakForce error images of never-dried walls, so a more detailed study of microfibril motions by current AFM methods is warranted.
Imaging wall texture and microfibrils by FESEM versus AFM
The remarkably different surface textures visualized by AFM and FESEM (compare Figures 1 and 6) highlight the relative advantages of these two high-resolution imaging techniques. A surface layer of pectin obscures microfibrils when the onion wall is imaged in the dry state, whether by FESEM (this study) or by AFM (Zhang et al., 2014). In wall samples extracted with EDTA, which removes only a fraction of the HG, FESEM revealed a pectic layer with a highly porous lattice-like structure (Figure 6i) which resembles the texture of the pectin-rich layer on the surface of Penium margaritaceum (Domozych et al., 2014). It also bears some resemblance to isolated pectins (Round et al., 2010), which lack the ring-like lattice that is likely lost by extraction procedures. We did not observe microfibrils overlaying the pectic layer: they may have been washed away during sample preparation; alternatively, the pectic layer may dynamically remodel itself around and over microfibrils as they are deposited to the nascent lamella. If this pectic layer is present in living cells, it might serve as a soft, porous buffer zone between the plasma membrane and the microfibrils in the nascent lamella, providing a zone for integration of newly deposited wall components to assemble into an interconnected layer, potentially aided by pressure from the protoplast (Proseus and Boyer, 2005). The apparent porosity of this pectic layer is consistent with the view that pectins are the major determinants of cell wall porosity (Read and Bacic, 1996).
In other FESEM-based studies of cell wall texture (e.g. Marga et al., 2005; Crowell et al., 2011; Fujita et al., 2013; Fujita and Wasteneys, 2014; Zhu et al., 2015), cellulose microfibrils are also evident but are less clearly defined as in onion walls pretreated with PL (Figure 5g,h). Digestion with PL or other enzymes may find wider use for other cell wall materials, but possible artefacts from increased cellulose aggregation must be considered (McCann et al., 1990; Sugimoto et al., 2000). In onion walls, the general organization of microfibrils was preserved in FESEM images, but close inspection showed the microfibrils to appear thicker, more crooked and more bundled than was the case for AFM – potentially artefacts of sample preparation, i.e. pectin removal, dehydration and metal coating. In a FESEM study of hypochlorite-treated cell walls from Arabidopsis, Fujita and Wasteneys (2014) observed a sparse layer of worm-like fibrillar structures above a layer of well ordered microfibrils (e.g. see their Figure 1d–h). They interpreted the worm-like fibrils to be recently synthesized cellulose, i.e. during aldehyde penetration, but their appearance more closely resembles short fibrils of pectin material seen on the surface of onion walls than the underlying cellulose microfibrils (our Figure 5). This is a point in need of further study.
Our AFM measurements indicate a cellulose microfibril diameter of 3.5 nm. This value is consistent with an 18- or 24-chain model (Newman et al., 2013; Thomas et al., 2013b), but contrasts with the 3 × 5 nm microfibril (36-chain model) reported by Ding et al. (2014) in their AFM analysis of dried walls from maize stems. Differences may originate from the different cell wall materials studied or from the use of a dried wall sample, in which coalescence of matrix polymers and microfibrils may generate larger fibrillar structures. An 18-chain microfibril would fit neatly with recent results about the structure of the cellulose synthesis complex (Cosgrove, 2014; Gonneau et al., 2014; Hill et al., 2014).
Two-color mapping of nanomechanical data
By combining nanomechanical data into two-color maps, it was possible to distinguish rigidly supported microfibril regions from weakly supported regions and rigid regions of the matrix from softer regions (Figure 7). This approach provides unprecedented detail about spatial variations in microfibril–matrix interactions and the mobility of cell wall regions. We anticipate that it will prove useful in future for exploring the consequences of genetic lesions in cell wall synthesis as well as the mechanisms of control of cell wall extensibility.
Experimental procedures
Cell wall sample preparation
Fresh onions (Allium cepa) were purchased locally and the outer periclinal epidermal wall from the abaxial surface was prepared as described previously (Zhang et al., 2014), using scale #5 (counting from the outside). The peeling process splits open the epidermal cells, resulting in a layer of periclinal walls, with the rest of the epidermal cell remaining behind. To prepare walls from onion parenchyma, the abaxial and adaxial epidermal layers were removed, leaving the parenchyma which was ground in liquid nitrogen and washed with 20 mm HEPES buffer (pH 7.0) and 0.1% Tween-20 three times or until the supernatant was clear. The wall fragments were resuspended in 20 mm HEPES buffer and a droplet of the sample was added to a clean glass slide. Excess water was evaporated on a slide warmer (50°C) until the sample was still visibly moist but could adhere to the slide. The slide was rinsed immediately with 20 mm HEPES buffer to remove loosely bound fragments before AFM scanning under buffer. We assume the middle lamella remained intact and so the only exposed wall surfaces were the inner faces of the cell walls. A similar grinding procedure was used for Arabidopsis thaliana (Columbia) petioles (4-week-old; day/night, 16 h/8 h; temperature, 22°C/16°C), cucumber (Cucumis sativus) hypocotyls and maize (Zea mays) coleoptiles (dark grown for 4 days at 27°C). Epidermal cell walls were identified by their characteristic appearance under the light microscope (elongated, rectangular shape and the presence of a cuticle).
AFM
Samples were scanned by Dimension Icon® atomic force microscope (Bruker, CA, USA) with ScanAsyst® and PeakForce QNM® (Quantitative Nanomechanical Property Mapping) operation package, as detailed previously (Zhang et al., 2014). All images were scanned at 512 × 512 pixels (scan size: 0.17, 0.5 or 2 μm). The images were flattened to remove tilt or bow in each scan line and exported as TIFF format. At least five different cells or fragments from each sample were scanned at 0.5–2 μm sec−1, and representative images were chosen for analysis.
The PeakForce QNM® operation records the force–distance curve at every pixel and thereby maps the distribution of nanomechanical properties (elastic modulus, adhesion, deformation). The modulus is calculated based on the Derjaguin–Muller–Toporov (DMT) model (Derjaguin et al., 1975). The adhesion force represents the absolute value of the maximum negative force when the tip starts to pull away from the sample surface. Deformation registers the maximum penetration depth during tip–sample interaction (Su et al., 2010).
To construct a montage, continuous 2 × 2 μm scans were stitched together by ImageJ's plug-in MosaicJ (Thevenaz et al., 1998). Microfibril orientations were measured using ‘Angle tool’ and the curvatures were measured using the ‘Fit circle’ function in ImageJ.
TEM
The outer epidermal wall from the fifth scale was peeled, cut into 3 × 3 mm sizes and immediately immersed in pure dimethyl sulfoxide (DMSO) for 16 h at room temperature before high-pressure freezing (HPF) and automatic freeze substitution (AFS). Briefly, the washed samples were loaded to a carrier filled with 2.5 μl hexadecane, frozen in a Leica (Wetzlar, Germany) EM HPM 100 at −196°C, then transferred to a Leica AFS system and freeze substituted with 1% osmium tetraoxide in acetone and 100% acetone at slowly increased temperature before being embedded in Eponante 12™ (Ted Pella, Redding, CA, USA) and polymerized at 70°C overnight. The tissue blocks were trimmed and sectioned at an oblique angle. Thin sections (70 nm) were made with a diamond knife and collected on gold grids. The thin sections on the grids were then incubated with 1% periodic acid in water for 30 min and rinsed in deionized water for 20 min before being incubated with freshly prepared 0.2% thiocarbohydrazide in 20% acetic acid in a humidity chamber in dark for 24 h. The sections were then washed sequentially with 10%, 5%, and 2% acetic acid and finally with deionized water three times for 20 min. The sections were stained with 1% silver proteinate (Sigma-Aldrich, St. Louis, MO, USA) in dark for 30 min, washed in deionized water and air dried before being further stained with 0.46% lead citrate followed by washing. The samples were imaged on a FEI Tecnai Spirit G2 TEM (FEI, USA) at 120 kV.
FESEM
Outer epidermal walls from the fifth scale were peeled and washed in 20 mm HEPES, pH 7.0 with 0.1% Tween-20 for 3 h at room temperature. Some samples were incubated with 50 mM EDTA (adjusted to pH 8.0 with NaOH) for 12 h six times, a total of 72 h at room temperature. Some samples were incubated with PL (10 μg ml−1) in 50 mm CAPS buffer, pH 10 with 2 mm calcium chloride for 16 h at room temperature. For TEMPO-mediated oxidation (Kuramae et al., 2014), samples were immersed in 100 ml water with 0.0148 g TEMPO and 0.162 g sodium bromide. Oxidation was started by adding sodium hypochlorite (15.7 mm final concentration) and continued at pH 10 at room temperature for 2 h before being stopped by addition of 1 ml methanol. The cell wall samples were transferred to 100% ethanol for 30 min before critical point drying with Leica EM CPD 300. Earlier work showed that fixation and dehydration of the wall samples by a graded ethanol series yielded the same result as direct dehydration 100% ethanol. The dehydrated cell walls were then stuck to carbon tape with cuticle side down, sputter coated by iridium for 10 sec and imaged by a Merlin FESEM (Zeiss, Jena, Germany). The same HPF and AFS protocol used for TEM was applied for FESEM sample preparation, except that samples were freeze substituted with 100% acetone. We used HPF and AFS techniques to compare pectin conformations with these two methods of dehydration.
Acknowledgements
We thank Seong Kim, Michael Jarvis and Yong Bum Park for informative discussion and Liza Wilson for AFM assistance. This work was supported by the Center for Lignocellulose Structure and Formation, an Energy Frontier Research Center funded by the U.S. Department of Energy, Office of Science, Basic Energy Sciences (grant no. DE-SC0001090). The authors declare no conflict of interest.


