Single-copy gene-based chromosome painting in cucumber and its application for chromosome rearrangement analysis in Cucumis
Summary
Chromosome painting based on fluorescence in situ hybridization (FISH) has played an important role in chromosome identification and research into chromosome rearrangements, diagnosis of chromosome abnormalities and evolution in human and animal species. However, it has not been applied widely in plants due to the large amounts of dispersed repetitive sequences in chromosomes. In the present work, a chromosome painting method for single-copy gene pools in Cucumis sativus was successfully developed. Gene probes with sizes above 2 kb were detected consistently. A cucumber karyotype was constructed based on FISH using a cocktail containing chromosome-specific gene probes. This single-copy gene-based chromosome painting (ScgCP) technique was performed by PCR amplification, purification, pooling, labeling and hybridization onto chromosome spreads. Gene pools containing sequential genes with an interval less than 300 kb yielded painting patterns on pachytene chromosomes. Seven gene pools corresponding to individual chromosomes unambiguously painted each chromosome pair of C. sativus. Three mis-aligned regions on chromosome 4 were identified by the painting patterns. A probe pool comprising 133 genes covering the 8 Mb distal end of chromosome 4 was used to evaluate the potential utility of the ScgCP technique for chromosome rearrangement research through cross-species FISH in the Cucumis genus. Distinct painting patterns of this region were observed in C. sativus, C. melo and C. metuliferus species. A comparative chromosome map of this region was constructed between cucumber and melon. With increasing sequence resources, this ScgCP technique may be applied on any other sequenced species for chromosome painting research.
Introduction
Chromosome painting refers to visualization of a specific chromosome region or entire chromosome via fluorescence in situ hybridization (FISH) based on chromosome- or chromosome region-specific probes (Pinkel et al., 1988; Fuchs et al., 1996). It has been verified as a very powerful tool for diagnosis of chromosome abnormalities, investigation of chromosome rearrangements during evolution, and construction of ancestral karyotypes (Rens et al., 2006; Graphodatsky et al., 2011).
In human and animal species, chromosome painting research has been widely performed using probes from flow-sorted or micro-dissected chromosomes followed by degenerate oligonucleotide-primed PCR amplification (Telenius et al., 1992; Yang et al., 1999; Ferguson-Smith and Trifonov, 2007). However, chromosome painting from chromosome-derived DNA probes failed to give satisfactory results in plant species, due to the presence of the large amounts of repetitive DNA common to all chromosomes (Jiang and Gill, 2006; Idziak et al., 2011; Lysak and Mandakova, 2013). Instead of using flow-sorted or micro-dissected chromosomes as probes, chromosome painting based on large-insert DNA clones [such as bacterial artificial chromosomes (BACs) or yeast artificial chromosomes (YACs)] has been developed for plant species with small genomes. Use of chromosome painting in plants was first described by Fransz et al. (2000), who used several YACs to paint specific regions of Arabidopsis thaliana chromosome 4. Subsequently, Lysak et al. (2001) used contiguous BACs as probes to paint chromosome 4 of A. thaliana, followed by painting of chromosomes 1 and 2 by the same group (Lysak et al., 2003). The chromosome painting technique has been used to detect gaps in the genome draft (Szinay et al., 2008, 2010). Comparative painting based on cross-species BAC FISH has provided reliable cytogenetic evidence for chromosomal rearrangements between plants and their relatives (Lysak et al., 2006; Tang et al., 2008; Lou et al., 2010; Idziak et al., 2011; Peters et al., 2012; Szinay et al., 2012). However, these experiments relied on the availability of contiguous BAC clones that are free of repetitive elements. Clones of this kind usually contain genomic inserts of between 50 kb and 1 Mb or more, and it is laborious work to screen for clones without repetitive sequences in plant species. In addition, preparation of probes is a challenging process that entails culturing bacteria, isolating the plasmid, and optimizing the hybridization reaction.
Successful painting of specific chromosome regions based on use of unique oligonucleotide probes was recently reported for mammalian and Drosophila cells (Boyle et al., 2011; Yamada et al., 2011; Beliveau et al., 2012). Complex oligonucleotide libraries were used in these experiments to produce region-specific probes based on sequence capture technology or massive parallel PCR amplification (Porreca et al., 2007; Gnirke et al., 2009); however, their application in higher plants remains to be confirmed.
In this study, a chromosome painting method based on FISH of single-copy gene pools (the ScgCP technique) was developed in Cucumis sativus. Single-copy genes free of repetitive sequences were screened using RepeatMasker software (http://www.repeatmasker.org) and BLAST analysis against the National Center for Biotechnology Information (http://www.ncbi.nlm.nih.gov) and cucumber genome databases (http://cucumber.genomics.org.cn/page/cucumber/index.jsp). Single-copy gene probes with lengths >2 kb were consistently detected on somatic metaphase and pachytene chromosomes based on the ScgCP technique. The painting patterns produced by gene pools containing sequential genes with intervals of 50, 150 and 300 kb were compared. Using the ScgCP technique, the individual chromosomes of cucumber in metaphase or pachytene spreads were unambiguously painted. Three large mis-assembled blocks on the short arm of chromosome 4 were identified using the ScgCP technique. To further demonstrate the potential application of this technique in comparative painting, the 8 Mb region gene pool at the distal end of chromosome 4, consisting of 133 sequential single gene fragments, was used for the analysis of chromosome rearrangement among Cucumis species through cross-species FISH.
Results and discussion
Single-copy gene isolation and probe purification
The single-copy genes were obtained by PCR amplification. Primers with a mean length of 25 bp, Tm values of 55–65°C, and nucleotide compositions of 40–60% cytosine and guanine were selected. All gene fragments ranging from 2 to 11 kb were amplified efficiently using the same procedure described in Experimental Procedures. The PCR amplification of some single-copy gene fragments from the short arm of chromosome 5 is shown in Figure 1.
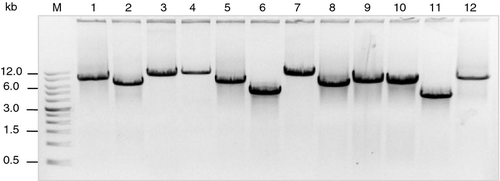
PCR products of single-copy genes from the short arm of chromosome 5.
Lanes 1–12 contain gene fragments with sizes 7.2, 5.8, 8.7, 9.0, 6.3, 4.6, 8.3, 5.8, 6.5, 6.3, 4.3 and 7.7 kb. Information regarding these genes is provided in Table S1. Lane M, size markers (kb).
The PCR products of single-copy gene fragments were recovered and purified by gel electrophoresis in 1% low-melting-temperature agarose. This step was necessary to remove the genomic DNA used as the PCR template and other non-specific amplicons from the specific PCR products. FISH using unpurified PCR products as probes produced background signals along all chromosomes, especially within heterochromatic domains.
Karyotype of cucumber chromosomes with a single-copy gene cocktail
Chromosome identification is critical for the construction of cytogenetic maps and further cytogenetic research. Cucumber has small and similar chromosomes. Karyotype analysis of cucumber has been performed by several groups (Koo et al., 2005; Han et al., 2008; Yang et al., 2012). The identification of each chromosome in these studies was mainly achieved by two methods. One is the FISH map of chromosome-specific large-insert clones, such as BACs and fosmids; the other is based on the distribution and signal intensity of tandem repeat sequences. As such, the cytogenetic research relies on the availability of large-insert clones and specific repeat sequences.
Here, we investigated the application of single-copy gene FISH for identification of individual chromosomes and construction of the cucumber karyotype. Seven gene probes with sizes ranging from 2.1 to 9.6 kb, together with 45S rDNA, were used to identify all seven chromosome pairs of cucumber and construct the cucumber karyotype. Seven single-copy gene probes specific to each chromosome were simultaneously hybridized onto metaphase chromosome spreads. Details of the probes used are given in Table 1. The FISH results showed that all seven probes produced clear signals at the expected position on each chromosome (Figure 2).
| Chromosome number | Gene | Chromosome arm | Primers | Probe size (kb) |
|---|---|---|---|---|
| 1 | Csa005197 | Short arm |
5′-TCTCTTTCTTCCTTATGGTATTGGTGG-3′ 5′-GCTCAGACTCTTGATTCTTCTCTTTGTGT-3′ |
6.7 |
| 2 | Csa006771 | Short arm |
5′-TGAAGAAGAGGAAAGTTTGGGTC-3′ 5′-GTTTGTTGAAGAGATGAGGGGATA-3′ |
6.5 |
| 3 | Csa020588 | Short arm |
5′-GCAGGTAGGTATTGTCTTTGTTC-3 5′-CTTCGTCTAATGCTTCTTCTCC-3 |
2.1 |
| 4 | Csa009352 | Long arm |
5′-ATTTTGTATGCCCCTGTATTCTCTC-3′ 5′-TTTCCCCCTTCTTACCAGTTTATGT-3′ |
9.6 |
| 5 | Csa000991 | Long arm |
5′-TGTGCTAAGTGAGGGTTTCG-3′ 5′-TCAGGGAGGCTATTCTATTCG-3′ |
5.2 |
| 6 | Csa015198 | Short arm |
5′-TTCTACTGCTTTCACTCCCTCTCAT-3′ 5′-CTTCAACTTCAACTTCATCCTCATC-3′ |
6.5 |
| 7 | Csa016691 | Long arm |
5′-CATGTGCTTTCCCCAATAATTCC-3′ 5′-ACGACCCTCTTTCTTTTCTGCCT-3′ |
6.1 |
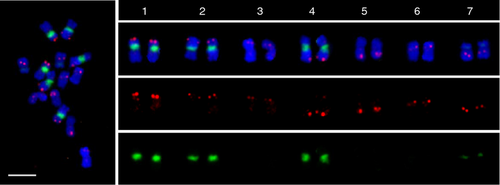
Chromosome identification based on FISH using chromosome-specific single-copy gene probe cocktails.
Seven single-copy genes (red) corresponding to an individual chromosome and 45S rDNA probes (green) were simultaneously hybridized onto mitotic metaphase chromosomes. Scale bar = 5 μm.
Sensitivity and reliability of single-copy gene FISH
The ‘smear’ method (described in 2.1) followed by digestion of the cytoplasm debris by pepsin treatment was used to prepare pachytene spreads. This method provided clearer preparations compared to the previous ‘flaming’ method (Iovene et al., 2008). To determine the sensitivity of single-copy gene FISH in pachytene spreads, we investigated the signal intensity of genes with different sizes. The FISH signal intensity of probes from the gene locus Csa000991 (located on the long arm of chromosome 5) with sizes of 9.9, 8.1, 5.2, 4.1 and 2.1 kb, respectively, was compared. We used a 5S rDNA probe that mapped to the short arm of chromosome 5 (Han et al., 2008) to identify chromosome 5 and also as a control for signal intensity (Figure S1). The FISH results showed that, except for the weak but clear signal produced by the 2.1 kb probe (Figure S1a), all other probes gave strong signals (Figure S1b–e). Primer information for these five probes is provided in Table S2.
Then, five sequential gene probes from the short arm of chromosome 5 with lengths ranging from 3.6 to 7.7 kb were used to investigate the reliability of single-copy gene-based painting on pachytene chromosome spreads. Five genes (annotated as Csa008123, Csa008194, Csa008101, Csa008222 and Csa008077) spanning 1.4 Mb with 250–450 kb intervals were labeled with biotin-16-dUTP or digoxigenin-11-dUTP. The probe lengths for the five genes were 4.1, 6.5, 7.7, 6.0 and 3.6 kb, together spanning approximately 2% of the interval. A probe mixture of these five gene fragments was hybridized onto meiotic pachytene chromosome spreads, somatic metaphase chromosomes and interphase nuclei after their relative position had been verified in separate FISH experiments. On pachytene spreads, they produced discernable signals in adjacent locations (Figure 3a–e). The FISH signals of these five gene probes showed that they completely overlapped on metaphase chromosomes (Figure 3f). A comparison between the cytological map and sequence structure showed that the relative locations of the five genes on the chromosomes were in accordance with their physical positions on the sequence map (Figure 3g). These results indicate that use of sequential single-copy genes results in reliable painting for specific chromosomal regions.
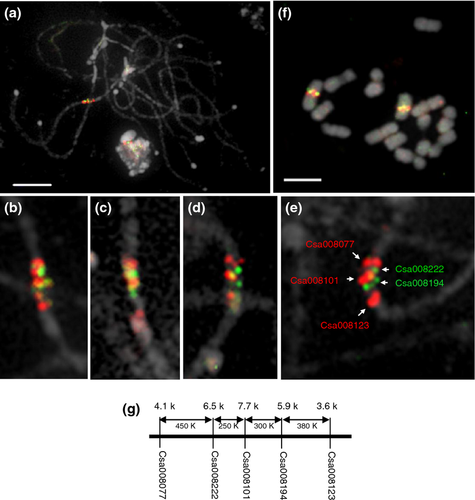
FISH mapping of five neighboring single-copy genes in cucumber, showing the reliability of the ScgCP technique.
(a) Simultaneous FISH mapping of five single-copy gene fragments with sizes of 4.1, 6.5, 7.7, 5.9 and 3.6 kb on pachytene chromosomes.
(b) Magnified image of the signals shown in (a).
(c–e) FISH mapping of five single-copy genes from different pachytene spreads. The color of each probe is shown in (e).
(f) FISH mapping of five single-copy genes on somatic metaphase chromosomes.
(g) Diagram of the five single-copy genes showing their orientation, probe size, interval and gene name based on the cucumber database (http://cucumber.genomics.org.cn/page/cucumber/index.jsp). Scale bars = 5 μm.
Painting patterns of single-copy gene pools with different intervals
To demonstrate the convenience of single-copy gene pools for chromosome painting in pachytene spreads, we mixed the purified single-copy gene PCR products from the region covering 8 Mb at the distal end of chromosome 4, and labeled the mixed DNA rather than labeling each PCR product. We found that FISH of single-copy gene pools produced obvious painting patterns on corresponding regions of pachytene chromosome spreads (Figure 4).
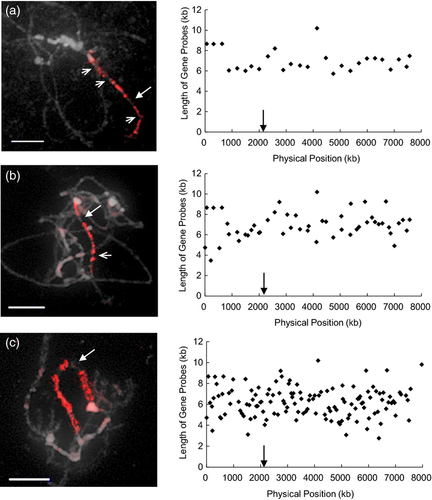
FISH painting of the 8 Mb region at the distal end of chromosome 4 based on gene pools containing different numbers of single-gene fragments.
(a) FISH painting of a gene pool containing 27 single-copy gene fragments (left), and distribution of these genes along the genomic sequence map (right).
(b) FISH painting of a gene pool containing 54 single-copy gene fragments (left), and distribution of these genes along the genomic sequence map (right).
(c) FISH painting of a gene pool containing 133 single-copy gene fragments (left), and the distribution of these genes along the genomic sequence map (right).
Disconnected regions are indicated by arrowheads, and the large arrows indicate gaps in the sequence map. The sequences of these genes are derived from the cucumber ‘9930’ genome database (http://cucumber.genomics.org.cn/page/cucumber/index.jsp). Information on these genes is provided in Table S1. Scale bars = 5 μm.
We compared the painting results of three probe pools containing 27, 54 and 133 single-copy genes from the same 8 Mb region of chromosome 4. The intervals for the three gene pools were approximately 300, 150 and 50 kb, respectively. FISH results showed that use of the three gene pools resulted in unambiguous painting for the corresponding region in chromosome 4 (Figure 4). However, the coverage and intensity of signals had a positive correlation with the density of single-copy genes. The two former pools gave clear painting results, but with some small disconnected regions (Figure 4a,b, arrowheads). The third pool produced much higher painting coverage and stronger signals (Figure 4c). Gaps without signal coverage are most likely the missing region in the referenced cucumber genomic sequence (Figure 4, arrows on FISH images). The estimated positions of this gap on the sequence map are indicated by arrows in the graphs on the right of Figure 4, and was confirmed by detailed analysis of this region as described below.
Painting of cucumber chromosomes
To examine the adaptability of the ScgCP technique for any chromosomes/regions, the painting results for each cucumber chromosome were investigated. Single-copy gene fragments with mean intervals of 300 kb covering all chromosomes of cucumber ‘9930’ were amplified and gel-purified. Primers were designed to produce amplicons of >5 kb to obtain a higher coverage. For genes of less than 5 kb, flanking sequences were included to obtain longer PCR products. The longest gene fragment was 10.9 kb. In total, 667 single-copy genes were selected for painting of all chromosomes. Table S1 list all the single-copy genes and their primers. All these single-copy gene fragments were amplified efficiently by the same PCR procedure as described in Experimental Procedures. For each chromosome painting experiment, all PCR products from a specific chromosome were mixed and then labeled.
The painting results for all cucumber chromosomes are shown in Figure 5. Unlabeled Cot-1 DNA of approximately 2–3 μg was used as a competitor to reduce background signals, and this worked very well except for chromosomes 1 and 4. The interference from background signals on these chromosomes 1 and 4, especially in heterochromatic domains, was not effectively reduced even when the amount of Cot-1 DNA was increased. In this case, the PCR products of the reverse transcriptase region of Ty1-copia and Ty3-gypsy group retrotransposons were used as well as blocking DNA with Cot-1 DNA to obtain a higher signal-to-noise ratio for chromosomes 1 and 4. The retrotransposons of Ty1-copia and Ty3-gypsy were previously confirmed to be distributed widely along the cucumber chromosomes (Jiang et al., 2010, 2011). The PCR products of the Ty1-copia and Ty3-gypsy retrotransposons in cucumber were obtained as described previously (Flavell et al., 1992; Kumekawa et al., 1999) (Figure S2). Products with sizes 280 and 430 bp were cloned and confirmed by sequencing. The results showed that using Cot-1 DNA combined with PCR products of retrotransposons as competitors significantly reduced background signals (Figure S3).
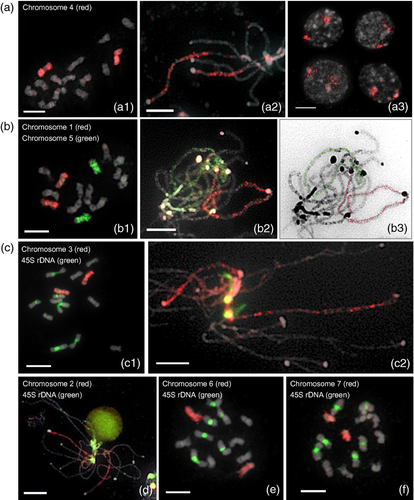
Painting of individual cucumber chromosomes based on FISH using chromosome-specific single-copy gene pools.
(a) Painting of chromosome 4 at various cell stages: (a-1) metaphase, (a-2) pachytene, (a-3) interphase.
(b) Painting of chromosomes 1 (red) and 5 (green) at various stages: (b-1) metaphase, (b-2) pachytene. The image in (b-3) represents a DAPI-stained image of the spread shown in (b-2), with chromosomes 1 and 4 indicated by red and green lines, respectively.
(c) Painting of chromosome 3 (red) and 45S rDNA (green) at various stages: (c-1) metaphase, (c-2) pachytene.
(d) Painting of chromosome 2 (red) and 45S rDNA (green) at pachytene stage.
(e) Painting of chromosome 6 (red) and 45S rDNA (green) at mitotic metaphase stage.
(f) Painting of chromosome 7 (red) and 45S rDNA (green) at mitotic metaphase stage. Scale bars = 5 μm.
The gene pool containing 75 genes from chromosome 4 was used to paint chromosome 4 at various cell stages. Figure 5(a) shows the painting results on metaphase, pachytene, and interphase nuclei of chromosome 4. The metaphase and pachytene chromosome 4 were clearly painted (Figure 5a-1/a-2). The FISH results also showed that homologous chromosomes occupied different territories of the interphase nuclei in approximately 80% of investigated cells (Figure 5a-3). In addition, the results showed that different chromosomes could be painted and traced in the same chromosome spreads using the ScgCP technique. The gene pool containing 73 single-copy genes from chromosome 1 and that containing 73 genes from chromosome 5 were labeled using biotin-16-dUTP (green) and digoxigenin-11-dUTP (red), respectively, and distinguished chromosomes 1 and 5 at metaphase and pachytene stages (Figure 5b-1/b-2/b-3). All other chromosomes were painted in the same way using 94 single-copy genes of chromosome 3 (Figure 5c-1/c-2), 68 single-copy genes of chromosome 2 (Figure 5d), 86 single-copy genes of chromosome 6 (Figure 5e) and 58 single-copy genes of chromosome 7 (Figure 5f).
Mis-assembly of the genomic sequence is detected by the ScgCP technique
The ScgCP technique was further used to evaluate the assembly quality of the genome sequence. We divided the 133 single-copy genes covering the 8 Mb distal end of chromosome 4 as above into two pools containing 87 and 46 sequential gene fragments, and labeled them with digoxigenin-11-dUTP (red) and biotin-16-dUTP (green), respectively (Figure 6a). The two gene pools painted the distal region of chromosome 4 in C. sativus ‘9930’, except for several gaps. Interestingly, instead of the two expected blocks, six regions with red or green signals were arranged in an alternating manner (Figure 6a). This unexpected painting pattern may be due to mis-assembly of the sequence in this region. Further, detailed information regarding assembly of the sequence was analyzed by detecting gene probes about each 500 kb along this region. FISH results showed that the gene Csa002940 at the end of the sequence map produced a signal at the rather than at the of the short arm of chromosome 4, while gene Csa003110, located at 2163 kb, mapped to the end of pachytene chromosome 4 (Figure 6b). Further, we mixed purified PCR products of all 38 genes from Csa002940 to Csa003110, covering a region of 2.16 Mb, and labeled them with digoxigenin-11-dUTP (red). This gene pool painted the distal end region of chromosome 4 (Figure 6c). These results confirmed that the block of approximately 2.16 Mb located at the distal end of chromosome 4 was mis-assembled back to front in the sequence map. In addition, two other blocks of mis-assembly were found by a similar process. The region from Csa004257 (at 2704 kb) to Csa004089 (at 5012 kb) was mapped at a position adjacent to another region from Csa017765 (at 6861 kb) to Csa017733 (at 7318 kb). However, the former region mapped to the proximal position, and the latter region was located at the distal position of the short arm of chromosome 4 in pachytene spreads (Figure 6b,c).
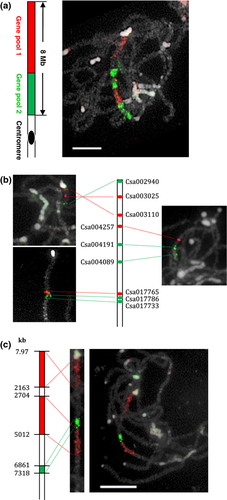
Chromosome painting of 8 Mb at the distal end of chromosome 4 to evaluate the quality of the sequence assembly.
(a) Left: ideogram showing the physical positions of two pools containing 87 sequential genes (red) and 46 sequential genes (green) from the cucumber ‘9930’ sequence map. Right: painting of these two pools on pachytene spreads of ‘9930’. The difference between the chromosome painting pattern and sequence map revealed that the sequence was mis-assembled in this region.
(b) FISH mapping of individual gene from the ends and middle of three mis-assembled regions on three different pachytene spreads, showing the orientation of each region on chromosome.
(c) Painting of three mis-assembled regions using three gene pools. Left: ideogram showing the physical positions of three gene pools. Right: painting of these three pools on pachytene spreads of cucumber ‘9930’. Middle: straightened pachytene chromosome showing three mis-assembled regions.
Such mis-assembly often occurs for genomic sequences obtained using next-generation sequencing technologies (Schatz et al., 2010; Treangen and Salzberg, 2012). Chromosome painting technology has been verified as a powerful tool to identify mis-aligned regions (Lysak et al., 2003; Yang et al., 2012). In this study, single-copy genes as small as 2 kb were detected consistently, which makes it is possible to evaluate the quality of the genomic draft assembly at a high resolution.
Comparative chromosome painting in the Cucumis genus
Inter-specific chromosome painting may be used to identify chromosomal rearrangements that occurred during speciation (Fuchs et al., 1996; Rens et al., 2006), and has been widely applied in many species (Yang et al., 1999, 2003; Lysak et al., 2003, 2005, 2010; Tang et al., 2008). In the genus Cucumis, C. sativus is the only species with 2n = 2x = 14 chromosomes. All other species show multiples of n = 12 (Kirkbride, 1993). Previous comparative cytogenetic research based on FISH using large-insert clones proposed the occurrence of centromere repositioning (Han et al., 2009) and segment inversion (Huang et al., 2009; Yang et al., 2012) during Cucumis evolution. To assess application of the ScgCP technique to study chromosome rearrangement among species, we compared the painting patterns of two gene pools covering 8 Mb of chromosome 4 (Figure 6a) in pachytene chromosome spreads of C. sativus ‘9930’ (cucumber), C. melo ‘Baipicui’ (melon) and C. metuliferus ‘PI 292190’ (kiwano). Unlike the painting patterns from cucumber chromosome 4 (shown in Figures 6a and 7a), three disconnected painting regions were observed on one chromosome arm of C. melo ‘Baipicui’ (Figure 7b), while C. metuliferus ‘PI 292190’ showed a clear painting pattern at the distal end of one chromosome pair with several large gaps (Figure 7c). The different painting patterns indicated by the red and green regions in different species indicated a chromosomal rearrangement during their evolution.
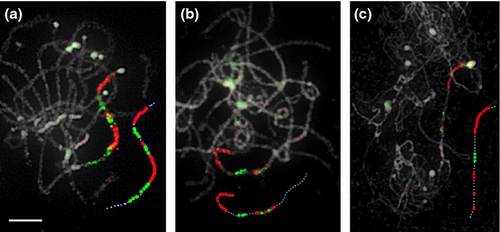
Comparative chromosome painting in Cucumis based on cross-species FISH of two sequential gene pools covering 8 Mb at the distal end of chromosome 4.
(a) Painting of two gene pools on C. sativus ‘9930’ pachytene chromosomes.
(b) Painting of two gene pools on C. melo ‘Baipicui’ pachytene chromosomes.
(c) Painting of two gene pools on C. metuliferus ‘PI 292190’ pachytene chromosomes.
The sequences of single-copy genes comprising the two gene pools are derived from the cucumber ‘9930’ genome database (http://cucumber.genomics.org.cn/page/cucumber/-index.jsp). Information on these genes is provided in Table S1. The additional dotted lines drawn next to the chromosomes show characteristic painting patterns for the three species. Scale bar = 5 μm.
Further, we compared the distribution of single-copy genes in cucumber and melon to reveal the chromosome rearrangement. Genes whose cytological positions have been determined on the short arm of chromosome 4 (shown in Figure 6b,c) were hybridized onto pachytene spreads of melon. Seven genes produced clear signals on melon pachytene spreads. We used five multi-probe cocktails comprising overlapping subsets of these genes combined with a melon centromere probe to identify their relative positions on melon pachytene spreads (Figure 8a–e). The FISH result showed that, except for gene Csa004191, which produced a signal on the proximal position of long arm (Figure 8a, number 7), all other genes mapped to the short arm of one melon chromosome. The comparative mapping results revealed high collinearity of this region between cucumber and melon, as indicated by the similar relative positions of genes 1–6 between the two chromosomes (Figure 8f). Mapping of gene 7 to the long arm of one melon chromosome is likely to be explained by pericentric inversion during evolution. Research has confirmed that the cucumber karyotype (n = 7) is the result of complex reshuffling of the ancestral karyotype (n = 12), comprising fusion, translocation and inversion events (Huang et al., 2009; Yang et al., 2014). The ability of the ScgCP technique to detect fine-scale region will allow detailed analysis to understand chromosome rearrangements among Cucumis species. In addition, based on the utility of this ScgCP technique, conserved gene probes will be an invaluable resource for elucidating the genomic similarity and evolution amongst higher plants.
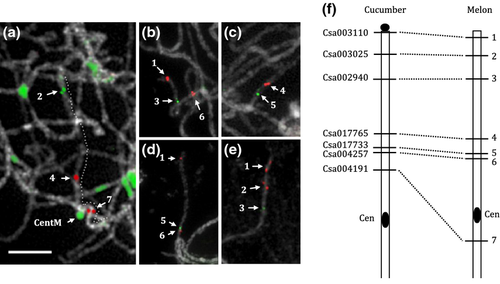
Chromosome rearrangement between cucumber and melon revealed by cross-species single-copy gene FISH.
Seven cucumber single-copy genes whose physical positions have been determined on the short arm of cucumber chromosome 4 in this study were FISH-mapped on the melon pachytene chromosomes to show the rearrangement.
(a–e) FISH mapping of various multi-probe cocktails comprising overlapping probes combined with melon centromere probe ‘CentM’ on melon pachytene chromosome spreads to show their relative positions on the melon chromosome.
(f) Comparative chromosomal positions of seven single-copy genes on cucumber and melon pachytene chromosomes. Six probes (numbers 1–6) showed high collinearity between the cucumber and melon chromosomes. A pericentric inversion was detected based on mapping of probe 7 to the other side of the melon centromere.
Experimental procedures
Plant materials and chromosome preparation
Cucumber C. sativus cv. 9930 (2n = 2x = 14) was used for all FISH experiments. The seeds of cucumber ‘9930’ were provided by Sanwen Huang (Institute of Vegetables and Flowers, Chinese Academy of Agricultural Sciences, Beijing, China). The metaphase and pachytene chromosome preparations were prepared as described previously (Iovene et al., 2008; Lou et al., 2013) with some modifications. The anthers at the pachytene stage were digested with enzyme mixtures containing 4% cellulose R-10 (Yakult, http://www.yakult.co.jp), 2% pectinase (Sigma-Aldrich, http://www.sigmaaldrich.com) and 0.1% pectolase (Yakult) in 1× PBS buffer, pH 5.5, at 37°C for 1.5 h. The digested anthers were then fixed in in 3:1 ethanol:glacial acetic acid (v/v) for at least 1 h. The ‘smear’ method (Lysak et al., 2006) with some modification was used to obtain well-spread pachytene chromosomes. Two or three digested anthers were transferred to approximately 20 μl of 60% acetic acid solution. The anther tissue was carefully squeezed with a pipette tip to release the pollen mother cells. Approximately 3–4 μl of the cell suspension was smeared gently onto the surface of the slide using the pipette tip. During smearing, the anther tissue was macerated using the pipette tip. The slides were air-dried and then screened under a phase-contrast microscope to select well-spread pachytene chromosome preparations. Use of diluted cell suspension was found to be essential to obtain well-spread chromosomes with a clear background. Two or three slides were prepared from each digested anther. We do not recommend use of more than two anthers for one slide, as it increases the amount of cell debris and hampers probe penetration.
The cytoplasm was removed by pepsin treatment to facilitate penetration of the probes. Slides with good chromosome spreads were treated as described by Lysak and Mandakova (2013) before performing FISH with the following modifications: the slides were treated with DNase-free RNase A (TaKaRa, http://www.takara.com) in 2× SSC at 37°C for 30 min, followed by washing three times in 2× SSC at 37°C for 5 min, washing with 1 μg ml−1 pepsin (Sigma-Aldrich) in 10 mm HCl for 30 min at room temperature, and washing three times in 2× SSC at room temperature for 5 min. Finally, the slides were dehydrated in 70, 90 and 100% ethanol for 5 min each, and left to air-dry.
Isolation of single-copy gene probes
The cucumber genome database (http://cucumber.genomics.org.cn/page/cucumber/index.jsp) (Huang et al., 2009) was used for designing the single-copy gene probes. Sequences of annotated repeat-free genes every 50–300 kb were selected for this research. Repetitive elements in each gene were identified using RepeatMasker software (http://www.repeatmasker.org). Any genes containing repetitive elements were removed. Further, any genes with more than one target in the cucumber genome were also eliminated based on BLAST analysis against the cucumber genome database. Gene fragments >2000 bp were selected as probes. The flanking sequences of some genes <2000 bp were included for primer design to obtain amplification products >2000 bp. High-quality primers producing exclusive amplification products were designed using primer premier 5.0 software (http://www.premierbiosoft.com). The mean length of primers is 25 bp, with Tm values between 55 and 65°C and GC content between 40 and 60%. All gene fragments with lengths 2–11 kb were amplified using the same PCR procedure as above, making it possible to obtain the gene amplicons in one step. The amplification procedure was as follows: 98°C for 10 sec, 60°C for 15 sec, 68°C for 4 min for 35 cycles, with a final extension at 68°C for 10 min. All PCR products were resolved on 1% agarose gels (BIO-WEST, http://www.genehk.com) for 30 min at 120 V, and stained with ethidium bromide. Products of the expected size were cut from the gel and purified using a gel recovery kit (Promega, http://www.promega.com). Some PCR products were cloned using TOPO TA cloning kits (Invitrogen, http://www.lifetechnologies.com), and the sequences were confirmed by sequencing. Table S1 lists the gene sequences used and their primers.
Preparation of blocking DNAs
The repeat-free single-copy genes screened by the repeatmasker software were further analyzed using another online software program (http://www.girinst.org) (Kohany et al., 2006). We found that many of these repeat-free genes contained short dispersed repetitive DNA, such as Ty1-copia and Ty3-gypsy retransposons fragments. To decrease interference from background signals, Cot-1 DNA was used as blocking DNA during hybridization. The Cot-1 DNA was isolated from cucumber as described previously (Zwick et al., 1997). Briefly, RNA-free genomic DNA was diluted to a concentration of 300 ng μl−1 using 3 m NaCl and double-distilled H2O to a final concentration of 0.3 m NaCl. Then the DNA was sheared by incubating the tube containing the DNA sample in boiling water until the DNA fragment size ranged from 100 to 1000 bp, based on electrophoresis in a 1% agarose gel. Usually, incubation for 60–90 min is required to obtain the correct size, depending on the quality of the DNA. The sheared DNA was then denatured at 95°C for 10 min, cooled in ice water for 10 sec, followed by incubation at 65°C in a water bath for 1130 sec for a re-annealing of Cot-1 DNA. This time was calculated accurately for the re-annealing of Cot-1 DNA according to the formula: Cot 1 = DNA concentration (m) × re-annealing time (sec). Then the DNA solution was cooled immediately on ice to prevent re-annealing of other DNA. S1 nuclease (1 unit per 1 μg DNA) was added to the cooled DNA solution to digest the single-stranded DNA at 37°C for 8 min. The reaction was stopped by immediate phenol extraction using Tris-equilibrated phenol, and the subsequent steps of the genomic DNA extraction method were performed until resuspension of Cot-1 DNA in TE buffer (Tris-hydrochloride buffer, pH 8.0, containing 1.0 mm EDTA) (Zwick et al., 1997).
In addition, PCR products from the reverse transcriptase region of the Ty1-copia and Ty3-gypsy retrotransposons of cucumber were used as blocking DNA in some experiments to reduce the non-target signals produce by these repetitive sequences. The primers used and the amplification methods for the two kinds of retrotransposons have been described previously (Flavell et al., 1992; Kumekawa et al., 1999). The heterogeneous sequences of the reverse transcriptase region of retrotransposons were confirmed by cloning and sequencing PCR products.
Probe labeling and fluorescence in situ hybridization
The single-copy genes or gene pools from the purified PCR products were used for FISH. On average, approximately 50 ng purified PCR amplified DNA was used for each slide. To create gene pools, we mixed the purified gene products in equal amounts according to their brightness based on ethidium bromide staining. The gene fragments/pools were labeled with either biotin-16-dUTP or digoxigenin-11-dUTP using nick translation, and detected using a fluorescein isothiocyanate-conjugated antibiotin antibody and a rhodamine-conjugated anti-digoxigenin antibody (Roche, http://www.roche-applied-science.com), respectively.
The FISH experiments were performed as previously described (Lou et al., 2013). Images were captured using a sensys (http://www.photometrics.com) CCD camera attached to an Olympus (http://www.olympus-global.com) BX51 microscope. The CCD camera was controlled using fish view 5.5 software (Applied Spectral Imaging Inc, http://www.spectral-imaging.com). Images were processed using adobe photoshop 5.0 (Adobe Systems, http://www.adobe.com).
Acknowledgements
The authors thank Joyce Wanjiru Ngure (Department of Horticulture, College of Horticulture, Nanjing Agricultural University, Nanjing, China) for critical reading of the manuscript. We appreciate two anonymous reviewers for their constructive comments and editorial polishing. This research was partially supported by the National Basic Research Program of China (973 Program: 2012CB113900), the ‘863’ Project (2012AA100102), General Programs 31272174 and U1178307 from the National Natural Science Foundation of China, the ‘111’ Project (B08025), and the National Key Technology R&D Program of the Ministry of Science and Technology of China (2013BAD01B04-10).


