A site selection framework for urban power substation at micro-scale using spatial optimization strategy and geospatial big data
Abstract
The world is facing more energy crises due to extreme weather and the rapidly growing demand for electricity. Siting new substations and optimizing the location of existing ones are necessary to address the energy crisis. The current site selection lacks consideration of spatial and temporal heterogeneity in urban power demand, which results in unreasonable energy transfer and waste, leading to power outages in some areas. Aiming to maximize the grid coverage and transformer utilization, we propose a multi-scene micro-scale urban substation siting framework (UrbanPS): (1) The framework uses multi-source big data and the machine learning model to estimate fine-scale power consumption for different scenarios; (2) the region growing algorithm is used to divide the power supply area of substations; and the (3) location set coverage problem and genetic algorithm are introduced to optimize the substation location. The UrbanPS was used to perform siting optimization of 110 kV terminal substations in Pingxiang City, Jiangxi Province. Results show that the coverage and utilization rate of the optimization results under different power consumption scenarios are close to 99%. We also found that the power can be saved by dynamic regulation of substation operation.
1 INTRODUCTION
The increasing economic growth and urban expansion have led to rapid growth in power consumption, especially in developing countries (Liu et al., 2017; Taghizadeh-Hesary et al., 2021). However, the unreasonable spatial distribution of substations and their limited number lead to power shortages and low utilization of current power grid equipment, making the mismatch between power energy supply and demand increasingly prominent (Fan et al., 2021). Most peak loads occur in cold winter and hot summer, especially in extreme climates. During this period, electricity loads are constantly at high levels, power equipment operates under high stress, and substations may be overloaded (Sun et al., 2018). This can lead to power shortages in urban areas, thus posing a considerable challenge to the power supply (Uddin et al., 2018). Therefore, it is urgent to relieve the pressure on grid operation and optimize the power supply structure during peak periods (Zeng et al., 2019). Future grid planning should expand the electricity supply network considering the spatial and temporal variation of the grid electricity load in different seasons based on the urban electricity demand (Chen & Zhang, 2021). The substation is an important part of the power system (Xia et al., 2018). Its reasonable location selection is of great significance for the safety and stability of electricity resources and regional power distribution (Ximing et al., 2019; Zeng et al., 2019).
However, most of the current power optimization is aimed at minimizing the total cost of siting and construction, which is difficult to cope with the power shortage problem during peak periods (Li, Yang, et al., 2018; Qin et al., 2019). Therefore, we aimed to maximize grid coverage and transformer utilization and proposed a multi-scenario micro-scale urban substation site selection optimization framework based on a genetic algorithm. Firstly, the fine-scale power consumption estimation models for different scenarios were constructed using the random forest method. Then, the region growing algorithm was used to assign the power supply area of each substation. Finally, the coverage model and genetic algorithm were used to solve the optimal solution of the substation site. The results of multi-scenario optimization were compared with the spatial distribution of existing substations to evaluate the effectiveness of the UrbanPS.
2 RELATED WORKS
2.1 Estimation of urban residential power demand
Knowing the detailed spatial distribution of power demand at the microscopic spatial (e.g., at every single house or 100 m grid level) and temporal (i.e., at tight time intervals) scales is essential, especially for power system planning and the construction of substations (Yi et al., 2016). Some studies used spatial load forecasting methods to reveal the characteristics of electricity demand (Heymann et al., 2018; Ye et al., 2019). But these methods have low simulation accuracy and mainly focus on estimating future load growth. The development of remote sensing technology has brought new opportunities in this field (Yin et al., 2021). Some scholars have used nighttime light data to estimate power consumption at the grid level. For example, He et al. (2012) established a power consumption model using nighttime light data to map mainland China's spatial pattern of county-level power consumption. However, the method is vulnerable to data quality. Thus, the estimated result's accuracy and scale cannot meet the actual requirements.
In conclusion, the current research on predicting power consumption has low prediction accuracy and is only conducted on coarse spatial scales (1 km or 500 m). Actual substation sitting in cities requires data support at finer plot scales (Zheng et al., 2014). In recent years, location-based service (LBS) technology has provided reliable data support for urban planning, energy, and economics (Hu et al., 2022; Yang et al., 2022). LBS data include points of interest (POI), mobile phone data, public transportation trajectory data, etc. They can reveal cities' spatial structure and population activity characteristics at the microscopic scale (Ding et al., 2018), thus providing an opportunity for fine-scale urban power load distribution mapping (Cheng et al., 2022).
2.2 Site selection of substation and other public facilities
Early research used traditional mathematical models to solve the optimal location of substations (Anjos & Vieira, 2017). However, as the power systems continue to expand and the grid structure becomes increasingly complex, traditional methods can no longer meet the requirements of optimal substation planning. Subsequently, some studies have used heuristic optimization models for urban substation siting. For example, Li, Yin, et al. (2018) used a combination of biogeographic optimization and population competition algorithms for substation site selection. They demonstrated that the method can be effective for complex substation site selection but is more applicable to a small number of substation sites. Kaewmamuang et al. (2019) used a dynamic bacterial foraging algorithm (DBFA) to search for the best binary variables and the best integer variables to determine the optimal substation location, capacity, power supply range, and construction time. The optimization objective of these two methods is cost minimization.
Recently, spatial analysis technology and geographic information systems (GIS) have become popular in site selection for many facilities, including hospitals, schools, and emergency shelters (Wang et al., 2020; Yu et al., 2020). Among them, the maximum coverage location problem (MCLP)-based models and location set coverage problem (LSCP) -based model have been widely used. For example, Yu et al. (2020) used the MCLP and the LSCP for macro and micro fire stations, respectively. Wang et al. (2020) used the MCLP -based model to maximize the network service coverage for the location optimization of base stations in 5G cellular networks. However, there is a lack of using the MCLP-based and LSCP-based models for the site selection of substations. Since electronic facilities are also essential public service facilities, this coverage model-based approach provides new opportunities to address the site selection of electric facilities.
To sum up, previous substation siting studies are rarely supported by the accurate fine-scale spatial distribution of residential electricity demand. Most of them have focused on the optimization objective of minimizing total cost. There is a lack of research that combines spatial analysis technology with the site selection of substations from the perspective of large-scale urban grid coverage. In response to the power supply shortage problems during peak periods in rapidly developing cities in China, the current site selection does not satisfy urban residents' primary production and daily power use, leading to low grid operation efficiency and even regional blackouts (Li, Yang, et al., 2018; Qin et al., 2019).
3 METHODOLOGY
The workflow of the proposed UrbanPS is shown in Figure 1, which includes three steps: (1) Estimate the urban power demand under different scenarios in 100 m spatial resolution. Based on multi-source spatial data and power data, the relationship between power load and spatial variable factors in four scenarios is constructed using a random forest model fitted to get the fine-scale spatial distribution of power load. Grids with power load are extracted and transformed to urban residential power demand points; (2) Assign the power supply area of each substation. Select the power supply index of the terminal substation, take the substation as the initial seed point, use the regional growing algorithm for neighborhood power diffusion, and gradually assign the surrounding power demand points to get the actual power supply area of each substation; (3) Substation site selection optimization. Based on the urban residential power demand and substation supply area of different scenarios obtained in the above two steps, the selection of the optimal substation location is abstracted as a LSCP according to the actual urban grid coverage characteristics, coupled with genetic algorithm to solve the optimal location and construct a substation location optimization model.

3.1 Multi-scenario fine-scale power mapping
Accurate power demand mapping is a key step for substation site selection optimization. Four scenarios of urban power consumption were considered in the UrbanPS, considering the urban production and living power load vary with the seasonal climate change (Li, Yin, et al., 2018; Senthil Kumar et al., 2018). They are extreme power consumption, winter peak power consumption, summer peak power consumption, and usually low power consumption. The extreme power consumption scenario is the sum of the maximum power consumption of all distribution transformers in each township of the city at different times. The winter peak power consumption scenario is the maximum power value obtained during January–February. The summer peak power consumption scenario is the maximum power value obtained during June–August. And the usual low peak power consumption scenario is the maximum power values obtained during March and October each year. Considering the efficiency and applicability of the urban substation siting and referring to previous studies (Zheng et al., 2014), a 100 m land parcel was chosen as the basic analysis unit for the residential electricity demand estimation.
In the UrbanPS framework, the random forest model was selected to characterize the complex relationship between the residential power load and explanatory variables. The random forest model was used for each power consumption scenario to characterize the nonlinear relationships and interactions between explanatory variables and the power load at the township level. Through the random forest model, we modeled the urban electricity load and multi-source spatial data-driven factors in four different scenarios, and constructed power fitting models for various electricity consumption scenarios. The R2, Pearson’ r, and root mean square error (RMSE) was used to evaluate the fitting accuracy of the model (Yao et al., 2019). After fitting models, the spatial distribution of power load at 100 m resolution in four scenarios was mapped using the explanatory variables. After mapping the power at the 100 m grid level, grids with non-zero power demands were selected. They were transformed into points and were regarded as the power demand points.
3.2 Substation power supply area division based on region growing algorithm
Estimating the supply area of each substation is a crucial step in optimizing the substation location. The electrical energy is transmitted from the substations to the demand points stepwise from near to far (Shu et al., 2020), and different substations have their specific supply area. In this study, we assume that the transmission process can be described by region growing. Therefore, the region growing algorithm was used in the UrbanPS framework to assign each substation's power supply region based on the power mapping result. Region growing refers to the gradual addition of neighboring pixels from a specific pixel according to a certain criterion, and the region growing terminates when certain conditions are satisfied.
There are two region growing conditions considered in the UrbanPS: (1) the Euclidean distance between the power demand point and the substation is less than or equal to the power supply radius; (2) the load rate of the substation is less than the maximum load rate.
The steps of substation supply area division using the region growing method area are as follows: First, the demand point located in the substation was designated as the seed point. The nearest power demand point to the substation was judged by the growth condition and was assigned to this substation if the condition was satisfied. Second, we considered the growth conditions of the grid of 8 neighboring demand points around the seed point and assigned the demand point that satisfies the conditions. When judging the growth condition of the power demand point, the Euclidean distance from all substations to this demand point was calculated. If the nearest substation meets the condition of continued growth, the demand point is assigned to the substation closest to it. Otherwise, a step-by-step judgment from near to far assigns that demand point to other substations. The above steps are cycled until one of the termination conditions is reached, which means the area growth is terminated, and the substation power supply range division is completed. In UrbanPS, there are three termination conditions: the substation reaching its maximum load, all power demand points being allocated, or the power supply radius of that substation being exceeded.
3.3 Substation location optimization for different scenarios
The load mapping results at different scenarios could provide important data support for optimizing the substation location. The substation location optimization process is based on four different scenarios: extreme power consumption, winter peak power consumption, summer peak power consumption, and low power consumption. After the power mapping and substation supply area division, the final step of the UrbanPS framework is location optimization based on LSCP and genetic algorithm, consisting of two parts: problem construction and the optimization of the solution. As for the problem construction, the LSCP was used in UrbanPS to cover all service demand points in a certain area with a minimum number of facilities (Yu et al., 2020). The LSCP-based model is often used for siting emergency facilities, such as fire stations and ambulances (Yu et al., 2020). The objective is to determine the minimum number of service facilities or construction costs while satisfying the need to cover all emergency points. Given that low coverage in the urban grid currently leads to local area shortage (Yadav et al., 2021), we consider that substations also have some emergency facility nature.
This study introduced the LSCP model based on the spatial distribution of power loads and characteristics of distribution networks (transformer capacity, transformer units, power factor, supply radius, maximum load factor). Considering the actual substation power supply range division, we aimed to maximize urban grid coverage and utilization of grid equipment (Honarparvar et al., 2021; Ye et al., 2018), thus establishing the LSCP-based urban substation site selection problem. The problem can be formulated as follows: within the urban area, the minimum number of terminal substations was used to cover all power demand points, and the objective was to maximize the grid coverage and equipment utilization.
In this study, the grid coverage is the percentage of demand points supplied with electricity (Wang et al., 2020). The utilization rate is defined as the ratio of the current load factor to the maximum load factor of the substation (Ye et al., 2018). At the same time, UrbanPS can also consider the optimization of the transformer's capacity by setting the capacity parameter Cj. The specific mathematical expression is as follows.
| Symbols | Definition |
|---|---|
| i | Index of power demand point |
| j | Index of substation |
| T i | Total number of power demand points |
| T j | Total number of selected substations |
| X j | If substation j is selected, Xj = 1; otherwise, Xj = 0 |
| Y i | If power demand point i is assigned, Yi = 1; otherwise, Yi = 0 |
| L j | Maximum load factor of substation j |
| C j | The total capacity of the main transformer in substation j |
| E j | The actual active power output of substation j |
| d ij | Distance between demand point i and substation j |
| R | Power supply radius of the substation |
| W 1 | Weight of coverage, 0 < W1 < 1 |
| W 2 | Weight of utilization, 0 < W2 < 1 |
The next step is the optimization of the solution. The problem of selecting P optimal substation locations from N candidate locations to maximize the grid coverage and distribution utilization is NP-hard. Previous studies have shown that the heuristic algorithm effectively solves the NP-hard problem (Seyhan et al., 2018). Commonly used heuristics in site-selection problems include genetic algorithms (Yu et al., 2020), greedy search algorithms (Vasko et al., 2016), forbidden search (Silva & Cunha, 2017), and Lagrangian relaxation methods (Zhang, Beltran-Royo, et al., 2019). Genetic algorithms have been proven to effectively solve combinatorial optimization problems (Comber et al., 2011).
This framework used a genetic algorithm to find the optimal substation location for different scenarios. We used a parameter tuning approach to determine the optimal parameters to ensure that the algorithm obtains the global optimal solution (Saif-Eddine et al., 2019; Zhang, Zhang, et al., 2019). The parameters to be determined for the genetic algorithm are the number of iterations, the population size, and the chromosome length. By setting different parameter values within a specific range, the optimal parameters are determined based on the accuracy of the results. The other parameters were kept constant while solving the relationship between one parameter and the approximate optimal solution.
3.4 Evaluation of power supply capacity of urban substations
4 CASE STUDY
4.1 Study area and data
Pingxiang is located in the western part of Jiangxi Province (Figure 2), with complex geomorphology. The total area of Pingxiang is 3823.99 km2, and there are 54 towns. The contribution of tourism to the economic growth of Pingxiang reached 48.6%, and the domestic tourism revenue in 2019 was 52.048 billion RMB (Pingxiang Bureau of Statistics and Pingxiang General Survey Team of National Bureau of Statistics, n.d.). Tourism can indirectly affect the spatial pattern of power consumption in the city, thus impacting the planning layout of substations (Lai et al., 2008). Currently, there are 23,110 kV terminal substations distributed in these five districts and counties.

We collected electricity consumption data recorded every half hour at substations from June to October 2017 and from January to March 2018. After cleaning and aggregating the data, the zonal statistics were used to obtain each township-level administrative district's average daily electric power. Such electric power was used as the power consumption data in our experiment. The power data collection information is shown in Table 1. The substation information contains transformer capacity, load factor, power supply radius, power factor, and other power data collection information is shown in Table 2.
| Station ID | Start time of collection | End time of collection | Electrical power (W) | Name | Longitude (°) | Latitude (°) |
|---|---|---|---|---|---|---|
| 23**30 | 2018/1/1 0:00 | 2018/1/2 15:51 | 0.242 | Liushi town | 117.271 | 20.311 |
| 69**55 | 2018/1/1 0:00 | 2018/1/2 15:51 | 0.537 | Paishang town | 112.606 | 27.535 |
| … | … | … | … | … | … | … |
| 81**51 | 2018/1/1 0:00 | 2018/1/2 15:51 | 0.212 | Shangbu town | 114.058 | 27.575 |
A total of 18 spatial drivers (Figure 3) were used as the explanatory variables of power consumption in this study. They are derived from multi-source data, including POI, OSM road network, and nighttime light data. Among them, POI data and road network density strongly correlate with urbanization levels (Wu et al., 2021). Therefore, they are widely used for urban functional area identification (Yao et al., 2017; Yu et al., 2022). In this study, POI data in 2018 were obtained from the GAODE map (www.amap.com), including residential communities, living services, educational institutions, corporate enterprises, entertainment venues, financial institutions, medical institutions, accommodation services, dining venues, shopping districts, and transportation facilities. The kernel density analysis was conducted to obtain the spatial distribution of the POI density of each category.

We extracted five types of roads, highways, primary roads, secondary roads, tertiary roads, and railroads, from the OSM road network data in 2018. The accessibilities to five types of roads at the grid level were calculated according to Euclidean distance. They were regarded as the line driver of the power load. Nighttime light intensity is commonly used to estimate regional socio-economic parameters, which has potential applications in energy consumption pattern analysis (He et al., 2012). The nighttime light data in 2018 were obtained from publicly available data on the High-Resolution Earth Observation System of Systems website (www.hbeos.org.cn), with system-level geometric correction, radiometric correction, and resampling statistics to obtain the average light intensity in the region. The final acquired raster data were spatially interpolated to obtain a 100 m spatial resolution driver dataset.
4.2 Spatial distribution of fine-scale power load
The multi-source spatial data was divided into a training set (80%) and a test set (20%) in this study. The constructed power consumption estimation model had high accuracy, with fitting accuracy R2 of 0.453, RMSE of 0.010, and Pearson's r of 0.694. The importance analysis of the random forest model shows that the slope factor has the most significant influence on the power consumption load in Pingxiang, followed by the hotel density and night light index (Figure S4).
Multi-scenarios fine-scale power was estimated, and the grids with power load value greater than 0 were converted into power demand points (Figure 4). The total load of four power consumption scenarios shows a significant seasonal difference in Pingxiang. In the extreme power consumption scenario, the power consumption load in each region was relatively large, especially in the central city, which reached 991.686 MW. This was followed by 665.377 MW in the satellite city (Lianhua County) and 642.611 MW in the industrial area. The overall demand for power during the winter peak period declined, and the power load in the central city was 752.045 MW. Central urban areas, satellite cities, and industrial areas had the most significant electrical loads. The summer peak power demand was relatively small compared with the usual low peak power demand except for four areas: central city, industrial area, tourist attractions, and satellite city (Shangli County), which was due to the increase in the use of cooling equipment in the hot summer (Lai et al., 2008). In contrast, the satellite city (Lianhua County) had a summer power load of 316.682 MW and a usual power load of 375.379 MW, which showed a special situation in that the usual power consumption is higher than the summer power consumption. The overall residential power consumption in Pingxiang obtained by micro-scale fitting matches the actual urban power consumption pattern (Guo et al., 2018), with only very few regions having differential patterns.

4.3 Spatial distribution evaluation analysis of existing substations
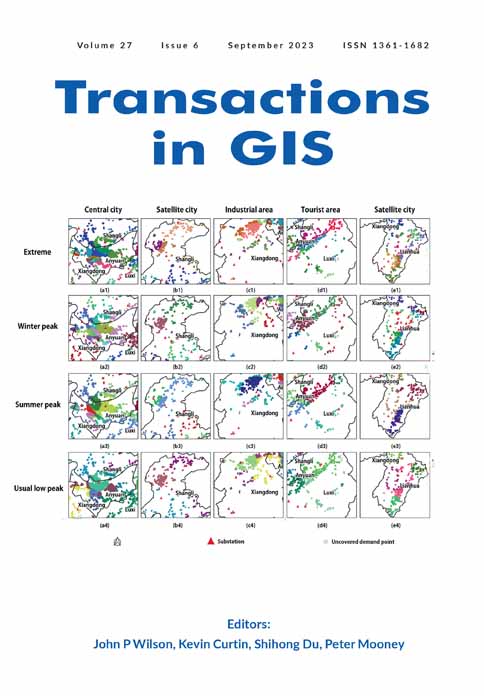
The coverage and utilization rates of the existing 23 substations in Pingxiang were evaluated. The results show that power supply shortage and low utilization of grid equipment exist in all scenarios. The coverage rate range from 71 to 95%, and the utilization rates range from 75 to 99%. Figure 5 and Table 3 show that Pingxiang suffers from serious power shortages under extreme power consumption and winter peak power consumption. The grid coverage rate was only 71.39% during the extreme power consumption period, prone to large area blackouts, especially in central cities, satellite cities (Shangli County), and scenic tourist areas. In the winter peak period, the grid coverage was 89.66%, and there was a shortage of power supply in the southern part of the central city and the northeastern part of the tourist area. These two scenarios with relatively high power demand had very low grid coverage and had a high utilization rate of nearly 99%. In the summer peak and usual low peak scenarios, the grid coverage was close to 95% to meet most of the regional power supply. Only the satellite city (Lianhua County) had a power shortage. The utilization rate of substations in these two scenarios was relatively low, with 91.41% in the summer peak period and 75.51% in the usual low peak period.

| Scenario | Optimized result | Current result | ||||
|---|---|---|---|---|---|---|
| Substation number | Coverage rate (%) | Utilization rate (%) | Substation number | Coverage rate (%) | Utilization rate (%) | |
| Extreme power consumption | 42 | 99.47 | 99.69 | 23 | 71.39 | 99.98 |
| Winter peak power consumption | 28 | 99.46 | 99.95 | 23 | 89.66 | 98.37 |
| Summer peak power consumption | 23 | 99.83 | 99.97 | 23 | 94.49 | 91.41 |
| Usual low peak power consumption | 20 | 99.50 | 99.97 | 23 | 94.49 | 75.51 |
Among all the regions, the power supply situation in the satellite city (Lianhua County) was the tensest, with a serious power shortage phenomenon in all four scenarios. The results show that 58.27% of the power demand area in the satellite city cannot be supplied under the extreme scenario, 42.07% during the winter peak period, and 29.30 and 30.53% during the summer peak period and the usual low peak period, respectively.
4.4 Multi-scenario optimization results
The substation location optimization was performed using the genetic algorithm with the optimal parameters set. We used Visual Studio software for the optimization, and the entire optimization process took 3039.952 s. We used parameter tuning to determine the optimal values of the sensitive parameters of the genetic algorithm (Zhang, Beltran-Royo, et al., 2019). The parameters used in this study were the initial number of iterations of 100, the population size of 20, and the chromosome length of 2839 (Figures S1 and Table S1). We set the same power capacity for all substations. Each substation was equipped with two transformers of 50 MVA capacity, that is, is 100 MVA. We set a maximum load factor of 80%, that is, = 0.8, a power factor of 100%, and a maximum power supply radius of 30 km from the substation (China Academy of Urban Planning and Design, 2014). In order to balance the grid coverage and utilization in the optimization objective (Ma et al., 2018), this study set equal weights for both, that is, = 0.5 and = 0.5.
As shown in Table 3 and Figure 6, optimization results' coverage and utilization rate under four scenarios could reach 99–100%, which means the substation can cover all the power demand points and reduce transformer losses. Under the extreme scenario, the current coverage rate of the existing 23 substations was only 71.39%, and it was increased by nearly 30% to 99.47% after the optimization. Results show that 19 new substations were needed to meet the power demand under this scenario. They were suggested to build in the north, northeast, and southwest of the satellite city (Lianhua County) and the southern industrial zone. Under the winter peak power consumption scenario, the current coverage rate of the existing 23 substations was 89.66%, and it would increase nearly 10% to 99.46% after the optimization. To meet the power demand, five new substations were suggested to build in the satellite city and the southern part of the tourist attractions. In the summer peak power consumption scenario, the existing 23 substations cover 94.49 and 91.41% utilization rates, while after the optimization, they can cover nearly 100% for both indicators. Results show that adjusting the spatial location of substations can improve grid coverage and equipment utilization. In this scenario, two to three substations in the central city were suggested to move to the southern part of the industrial area and the southern part of the satellite city (Lianhua County). In the usual low peak scenario, the existing 23 substations had 94.49% coverage and a 75.51% utilization rate. The optimization results show that only 20 substations were needed to achieve close to 100% coverage and utilization in this scenario. Additional substations were required to provide power in satellite cities (Lotus County) and tourist attractions, and some substations in other areas were suggested to close to save energy.

5 DISCUSSION
5.1 Interpretation of the findings
We proposed the UrbanPS framework from the perspective of grid coverage to optimize the location of large-scale substations in newly built urban areas. The framework can accurately simulate the spatial distribution of urban residential electricity demand and effectively improve cities' grid coverage and equipment utilization. The results show that the power consumption estimate model has high accuracy (R2 = 0.453, RMSE = 0.010, Pearson's r = 0.694). The weight analysis of driving factors of power load verified the feasibility and effectiveness of the model for urban residential power demand simulation. The optimized grid coverage and equipment utilization rate for different scenarios were close to 99%. The results demonstrate that the UrbanPS framework is a reliable method for parameter tuning and can effectively optimize the substation location.
The UrbanPS framework introduced multi-source spatio-temporal variables to reveal the drivers of electricity consumption. Population activity is the most significant factor affecting the distribution of electricity assumption. However, topographical conditions such as slopes can mainly limit electricity consumption in some areas. Previous studies on estimating electricity demand had insufficient fitting accuracy and large analysis units (1 km or 500 m) (Lu et al., 2019; Wang & Lu, 2021). The UrbanPS provides a new opportunity to explore the prevalent spatio-temporal heterogeneity of electricity consumption at a fine scale.
5.2 Electricity consumption is influenced by urban spatial structure and seasons
The residential electricity load of fast-growing Chinese cities has spatial and temporal heterogeneity at the microscopic scale. The central city has a dense and uneven distribution of demand points (Figure 4). The value difference of neighboring demand points can be up to 330%. The high electricity loads are mainly located around hospitals, schools, and companies, indicating a high electricity consumption in areas with dense populations. The demand points in industrial areas show a regional aggregation, with high electricity consumption in various industrial parks, while residential electricity consumption is relatively low. In addition, the electricity load of tourist attractions and surrounding satellite cities is relatively high due to the influence of crowd gathering.
The residential electricity load also shows a strong seasonal effect. The seasonal effect is particularly pronounced in the central city, where winter and summer electricity loads are twice and 1.5 times higher than usual. This phenomenon is related to spiking electricity loads due to temperature control equipment such as air conditioners (Li, Yang, et al., 2018). The seasonal effect of electricity consumption in industrial areas is relatively weak, with load differences between seasons averaging 1.35 times. The differences between these two typical functional areas suggest that electricity loads have a strong seasonal pattern in population-dense areas. However, there are some exceptions. For example, the electricity load in tourist attractions during the tourist season (spring and autumn) is 1.05 times the summer electricity load, which is very close to both. This is due to the higher number of tourists in mountainous areas during the peak tourist season.
5.3 Substation siting and refinement management
The proposed UrbanPS framework uses the LSCP model for substation siting optimization. The optimization results can alleviate the problems of power supply constraints and low utilization of electrical facilities and can be used to refine the management of grid resources. We found that the coverage and utilization rate of the optimization results increased by 5–30% compared to the existing distribution. Traditional substation siting studies are mainly limited to planning a minimal number of substations to achieve the optimization goal of minimizing the total cost. Compared to the substation siting models proposed in recent years (Li, Yin, et al., 2018), the proposed UrbanPS framework considers the electricity consumption patterns of multiple urban scenarios and adopts a region growing algorithm to more finely delineate the power supply area of the substation. At the same time, UrbanPS innovatively uses grid coverage and utilization as the optimization objectives for substation siting. The model helps to optimize the location of future substations in new urban areas, relieving the pressure on the grid during peak periods and meeting the basic electricity needs of urban residents.
This study optimized the siting of substations under different scenarios by analyzing the residential electricity consumption patterns under multiple scenarios. The results might solve the power shortage problem during seasonal peak consumption periods. For example, during the seasonal peak power consumption, substations in the central city, industrial areas, and satellite cities can be turned on, thus preventing power outages due to overload operation of the distribution network. In contrast, several substations can be turned off to reduce power losses during the low power consumption period of spring and autumn. The study suggests that the operation of different substations can be dynamically adjusted by evaluating the actual local power load to balance the electrical energy supply and consumption.
5.4 Limitations and future works
The present framework still has some limitations. First, in future research, we will dynamically simulate the opening and closing of substations in different city areas according to the seasonal power consumption pattern and conduct the dynamic dispatching distribution of electric energy among regions. Second, capacity planning is another essential part of urban power grid planning, which is not addressed in this study. In the future, we will establish a multi-objective optimization model for substation siting and capacity by adjusting the capacity in the model and optimizing the capacity and location of substations simultaneously. Third, the disadvantage of heuristic optimization algorithms for solving NP-hard problems is it is difficult to obtain a global optimal solution (Deng et al., 2019; Wang & Sobey, 2020). In the future, we will consider further introducing reinforcement learning methods to enhance the algorithm's optimization performance.
6 CONCLUSION
Aiming at the spatial planning of substations in new urban areas and dealing with the power shortage problem during peak periods, we proposed the UrbanPS framework from the perspective of large-scale urban grid coverage. The maximum coverage and utilization rate were regarded as the optimization objective. The substation siting optimization was conducted in Pingxiang, China, and the results verify the proposed methods' theoretical and practical contributions. Results show that the UrbanPS helps allocate power resources and effectively alleviates the power shortage problem during peak hours in a fast-growing city. It is suggested that power resources can be reasonably distributed by dynamically adjusting the operation of different substations. Findings from this study can guide grid planning in new urban areas in China.
ACKNOWLEDGMENTS
We would like to thank editor and anonymous reviewers for their constructive suggestions and comments for improving this manuscript. Open Access funding enabled and organized by Projekt DEAL.
CONFLICT OF INTEREST STATEMENT
No conflict of interest exists in this article, and the article was approved by all authors for publication.
Open Research
DATA AVAILABILITY STATEMENT
The data that support the findings of this study are available from the corresponding author upon reasonable request.