RETRACTED: The diagnostic value and associated molecular mechanism study for fibroblast-related mitochondrial genes on keloid
Abstract
Purpose
This study aims to reveal the mechanism of fibroblast-related mitochondrial genes on keloid formation and explore promising signature genes for keloid diagnosis.
Method
The distribution of fibroblasts between the keloid sample and control sample based on three keloid datasets, followed by the differentially expressed genes (DEGs) investigation and associated enrichment analysis. Then, hub genes were explored based on DEGs, mitochondrial genes from an online database, as well as fibroblast-related genes that were revealed by WCGNA. Subsequently, signature genes were screened through machine learning, and their diagnostic value was validated by nomogram. Moreover, the targeted drugs and related transcriptional regulation of these genes were analyzed. Finally, the verification analysis was performed on signature genes using qPCR analysis.
Result
A total of totally 329 DEGs were revealed based on three datasets, followed by enrichment analysis. WGCNA revealed a total of 258 fibroblast-related genes, which were primarily assembled in functions like muscle tissue development. By using machine learning, we screened four signature genes (ACSF2, ALDH1B1, OCIAD2, and SIRT4) based on eight hub genes (fibroblast-related mitochondrial genes). Nomogram and validation analyses confirmed the well-diagnostic performance of these four genes in keloid. Immune infiltration and drug correlation analyses showed that SIRT4 was significantly associated with immune cell type 2 T helper cells and molecular drug cyclosporin. All these findings provided new perspectives for the clinical diagnosis and therapy of keloid.
Conclusion
The fibroblast-related mitochondrial genes including SIRT4, OCIAD2, ALDH1B1, and ACSF2 were novel signature genes for keloid diagnosis, offering novel targets and strategies for diagnosis and therapy of keloid.
1 INTRODUCTION
Keloid is a chronic skin disorder characterized by the abnormal proliferation of fibroblasts during the wound-healing process, leading to excessive scar formation.1 Fibroblasts are one of the most important cell types in connective tissue, playing a crucial role in tissue repair and scar formation.2 Keloid management can be difficult and frustrating since the difference in morphology between keloid fibroblasts and normal skin fibroblasts is not significant.3 Hence, delving into the molecular mechanisms governing the role of fibroblast-related genes in the formation of keloid, and identifying potential diagnostic genes associated with them, holds significant importance for the clinical diagnosis and treatment of keloid.4
The distribution differences of fibroblasts are associated with various diseases, including keloid.5 A previous study shows that the quantity and activity of fibroblasts vary significantly across different tissues, and these differences can impact the pathological processes of diseases.6 For instance, in keloid, the excessive proliferation of fibroblasts and their abnormal secretion of extracellular matrix are primary causes of the lesions.7 Although the roles of different types of fibroblasts in the formation of keloid are not yet fully understood, their distribution and functional differences are evidently important factors in the disease's development. Actually, the differential expression of mitochondrial genes in fibroblasts is gaining attention in the study of molecular mechanisms of various diseases.8 Mitochondria are key organelles for cellular energy metabolism and signal transduction, and changes in their gene expression can affect cell function, leading to the progression of human disease.9 Existing literature indicates that certain mitochondrial genes exhibit abnormal expression in the fibroblasts of keloid patients.10 These genes, such as H19, may influence key processes such as cell proliferation, apoptosis, and ECM synthesis by participating in specific signaling pathways and metabolic processes, thereby promoting the formation of keloid.11 Therefore, exploring the diagnostic value of the aforementioned DEGs holds significant clinical implications for various diseases, including keloid. In recent years, bioinformatics analysis techniques have been widely applied in dermatology. For example, Ma et al. found that PTPRC, TYROBP, and CXCR4 were closely related to the pathogenesis of dermatomyositis and atherosclerosis based on bioinformatics analysis.12 Besides, Xian et al. found through bioinformatics analysis that CHL1 and MBNL2 might participate in the occurrence of psoriasis and nonalcoholic steatohepatitis by regulating hsa-miR-1305.13 Moreover, Zhang et al. identified eight key genes in psoriasis and ulcerative colitis through machine learning and integrated bioinformatics, which helped to identify occultive ulcerative colitis in patients with psoriasis.14 Machine learning techniques have demonstrated immense potential in uncovering disease diagnostic genes, with notable advancements, particularly in the realm of keloid-related diagnostic genes. Algorithms such as least absolute shrinkage and selection operator (LASSO) regression, random forest (RF), and support vector machine (SVM) can effectively identify pivotal diagnostic genes from vast biological datasets.15 These algorithms, by processing high-dimensional data and intricate gene expression patterns, unveil specific genes associated with keloid formation.16 Particularly in studies involving fibroblast mitochondrial-related genes, machine learning methods can efficiently sift through genes with potential diagnostic and therapeutic value for diseases, aiding in the comprehension of these genes' specific roles in disease progression.
In this study, we explored the distribution of fibroblasts between the keloid sample and control sample based on GEO datasets and identified differentially expressed genes (DEGs) related to fibroblasts and mitochondria. Subsequently, signature genes were screened through machine learning, and their diagnostic value was validated. Moreover, the targeted drugs and related transcriptional regulation of these genes were analyzed. Finally, the verification analysis was performed on signature genes using qPCR analysis. Via systematically analyze the molecular mechanisms and diagnostic value of fibroblast-related mitochondrial genes in keloid by integrating machine learning and bioinformatics analysis, we hope to further elucidate the pathological mechanisms of keloid, offering novel targets and strategies for diagnosis and treatment.
2 MATERIAL AND METHODS
2.1 Data source and preparation
The microarray datasets GSE7890 (5 keloid samples and 5 control samples),17 GSE44270 (9 keloid samples and 3 control samples),18 and GSE145725 (9 keloid samples and 10 control samples)19 in the GEO database were enrolled in the current study as the training datasets. In addition, the microarray datasets GSE113619 (16 keloid samples and 10 control samples)20 in the GEO database were enrolled as validation datasets in this study. Based on the probe expression matrix and the annotation file, probes not corresponding to Gene symbols were excluded. For genes with multiple corresponding probes, their average expression value was calculated to represent the gene's expression level. The SVA package (version: 3.36.0) in R software21 was then employed to eliminate batch effects from the training set expression profile data, which were subsequently combined for further analysis.
2.2 Analysis of differential fibroblast distribution and gene expression between group
Based on the training dataset, the IOBR package was used to calculate fibroblast content by using three algorithms: MCPcounter, xCell, and EPIC.22 The differences in fibroblast distribution between keloid and control groups in the training dataset were explored using the Wilcoxon test. Then, the limma package23 in R was applied to explore DEGs in keloid versus control. The Benjamini & Hochber (BH) adjusted P-value < 0.05 and |log2FC| > 0.263 were selected as the thresholds for DEGs investigation. Finally, the results were visualized using a volcano plot and heat map.
2.3 Enrichment analysis on DEGs
The enrichment analysis was performed based on the cluster Profiler package (version: 4.0.5) in R.24 The GO functions include biological processes (BP), cellular components (CC), and molecular functions (MF). The adj. P < 0.05 was used as the cut-off value. The result of GO and KEGG enrichment was visualized using a bubble plot and tree diagram.
2.4 Weighted Gene Co-expression Network Analysis (WGCNA) investigation
The analysis began by conducting variance analysis, which was used to identify the TOP5000 genes exhibiting high variation among samples. WGCNA25 (version 1.72-5) was employed to reveal the modules of the gene set characterized by significant co-expression patterns. First, the soft thresholding approach was applied to transform the adjacency matrix into a continuous scale ranging from 0 to 1, ensuring the constructed network adhered to a power law distribution, thereby reflecting biological network properties more accurately. In this study, a soft threshold of 0.85 was selected for network construction, as it was the first instance to meet this criterion (minModuleSize = 50; mergeCutHeight = 0.25; MEDissThres = 0.25). Next, we constructed a scale-free network using the blockwiseModules function, and then a module partition analysis was performed, followed by an investigation of the fibroblast-related genes.
2.5 PPI network and enrichment analysis based on fibroblast-related genes
STRING (Version: 11.5) is a biological database and web resource of known and predicted PPI.26 In this study, STRING was used to predict the interactive relation associated with DEGs (species: homo). The result of the PPI network was visualized by Cytoscape software, followed by the enrichment analysis.
2.6 Signature genes investigation
A total of 1136 Mitochondrial (mt)-genes in Human MitoCarta3.0 were obtained from the human Mitochondrial Genome Database (mtDB). Then, the Venn plot analysis was performed on DEGs, fibroblast-related genes, and mt-genes to obtain common(co)-genes by using Venny software. Moreover, totally three machine learning algorithms were performed on co-genes to obtain diagnostic signature genes for keloid. Briefly, based on LASSO Cox regression, co-genes were analyzed with 10-fold (nfold = 10 s) cross-validation analysis provided by the glmnet package (version: 4.1.3) in R.27 Based on the SVM in R,28 co-genes were analyzed by using the RFE algorithm. Moreover, the RF algorithm in the randomForest package of R29 was performed on co-genes. Finally, the signature genes of keloid were explored by integrating common genes in all algorithms.
2.7 The diagnostic evaluation for signature genes
Based on signature gene expression between two groups in both the training dataset and validation datasets, the receiver operating characteristic (ROC) investigation was applied in the current study to explore the area under the curve (AUC) value for each signature gene using pROC package (version: 1.12.1) in R.30 Then, the diagnostic biomarkers were used for nomogram establishment by rms package in R.31 A nomogram was constructed using the value nomoScore of all genes by using the rms package (version: 6.3-0)32 in R, followed by the high-risk group and low-risk group obtained. We compared the differences between the two groups and calculated the survival rate. Subsequently, we conducted calibration curve, decision curve analysis (DCA), and clinical curve analyses to test the diagnostic efficiency of the nomogram.
2.8 Immune infiltration and correlation analysis
The differences in the immune microenvironment between keloid samples and control samples in the training dataset were explored. Briefly, a total of 28 types of immune cells were enrolled to reveal the infiltration scores by using ssGSEA.33 Then, combined with different grouping, the Wilcox test was used to calculate the P-value of differences between the two groups. Then, the correlation between feature genes and immune cells was analyzed using the Pearson correlation coefficient using the corr.test in the psych package of R.34 The results were visualized using the pheatmap.
2.9 PPI and drug-gene analysis based on feature genes
Based on GeneMANIA database,35 the PPI network was established with feature genes and associated 20 interacting genes. The result was visualized by using Cytoscape software. Then, the drug-target gene interaction was further explored based on the Drug Signatures Database (DSigDB)36 to reveal the relationship between feature genes and drugs.
2.10 The miRNAs-mRNA-TF network investigation
The miRWalk (version: 3.0)37 was applied in the current study to predict miRNAs targeting feature genes obtained above, followed by the miRNA-mRNA relations screening for further analysis. Moreover, based on hTFtarget database,38 the transcription factors (TFs) of miRNAs in mRNA-miRNA interactions were predicted to establish TF-miRNA interactions. Finally, based on the miRNA-mRNA and TF-miRNA interactions, TF-miRNA-mRNA regulated by the same miRNA were screened. The result was visualized by using Cytoscape software.
2.11 The qRT-PCR analysis
To further investigate the expression of biomarkers (ACSF2, ALDH1B1, OCIAD2, and SIRT4), a verification study was performed based on cultured keloid cells and normal dermal fibroblasts purchased from Lonza (cat. no. PT-5025. Basel, Switzerland). Total RNAs were isolated from hDPCs using TRIZOL reagent (Invitrogen, USA) and converted to cDNA with the RevertAidTM First Strand cDNA Synthesis Kit (Thermo Fisher Scientific) following the provided protocols. PCR amplification was conducted on an ABI7500 machine (Applied Biosystems, USA). All primers used in this study are detailed in Table 1. The PCR cycle parameters were 95°C for 5 min, followed by 35 cycles of 95°C for 30 s and 52°C for 30 s. Relative gene expression levels were determined using the 2 −ΔΔCt method.39
| Primer | Sequence(5′−3′) |
|---|---|
| ACSF2-F | CGTTCAGTCCAGAAGCCAAA |
| ACSF2-R | CTCCACAGCCTTCTCCTTCA |
| ALDH1B1-F | GGTGACAGAGGTGACGTTGA |
| ALDH1B1-R | ACGCTCTGTGCTGTTGTGAT |
| OCIAD2-F | AGCGTCTTCCAGGAGGTTTC |
| OCIAD2-R | CTGCTGAGGAGGCTGAAGAT |
| SIRT4-F | GGAAAGACGCTTGATGAGCA |
| SIRT4-R | CTGCCACACTGGCTTCTGTA |
| GAPDH-F | GTCTCCTCTGACTTCAACAGCG |
| GAPDH-R | ACCACCCTGTTGCTGTAGCCAA |
- Abbreviation: GAPDH, glyceraldehyde 3-phosphate dehydrogenase.
3 RESULTS
3.1 Fibroblast distribution analysis between keloid samples and the control samples
By using the MCPcounter, xCell, and EPIC algorithms, the differences in content between the two groups were revealed (Figure S1). The results indicated that the content of fibroblasts was dramatically different between the two groups based on all three algorithms.
3.2 DEGs between groups and associated enrichment analysis
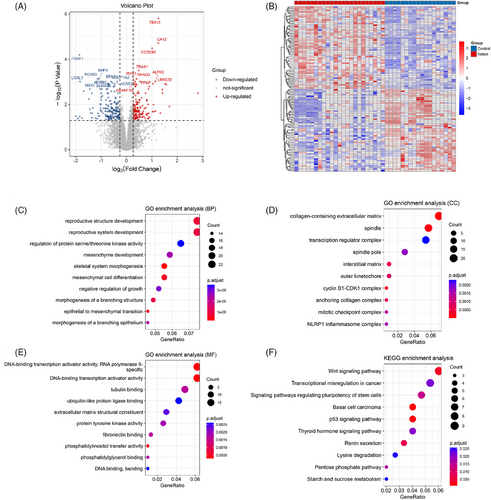
With P < 0.05 and |log2FC| > 0.263, a total of 329 DEGs including 144 up- and 185 down-regulated genes were explored between keloid samples and the control samples (Figure 1A). The result of heatmap analysis for the Top 50 DEGs showed that all DEGs could be well separated by groups (Figure 1B). These 329 DEGs were mainly assembled in functions like reproductive structure development (BP, GO:0048608) (Figure 1C), spindle (CC, GO:0005819) (Figure 1D), and DNA-binding transcription activator activity (MF, GO:0001216) (Figure 1E). Moreover, pathways like the Wnt signaling pathway (hsa04310) were significantly enriched by these DEGs (Figure 1F).
3.3 Feature genes revealed by WGCNA
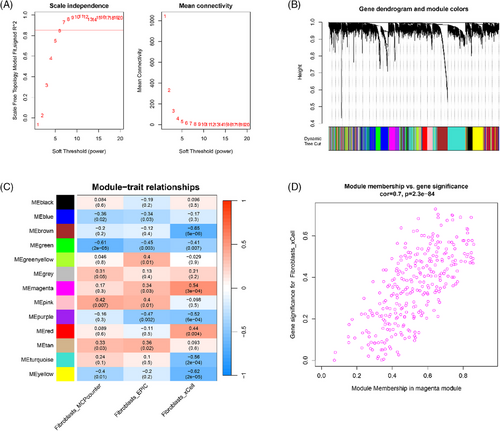
The WGCNA analysis was performed on all DEGs. The soft threshold for network construction was chosen to be 6, with the scale-free topology model fitting degree being 0.85. Consequently, this network adhered to the power-law distribution and closely resembled the actual biological network state (Figure 2A). The result showed that a total of 12 modules (Figure 2B), such as MEmagenta, MEblue, and MEblue, were explored. The correlation analysis between modules and traits (different groups) showed that magenta (containing 258 genes) is the module with the highest correlation with each trait (Figure 2C). Thus, the genes in magenta were used as fibroblast-related genes for subsequent analysis. The correlation between module membership in module and gene significance for fibroblasts is shown in Figure 2D. The result showed that there was a positive correlation between module membership in module and gene significance for fibroblasts.
3.4 PPI and enrichment analysis based on fibroblast-related genes
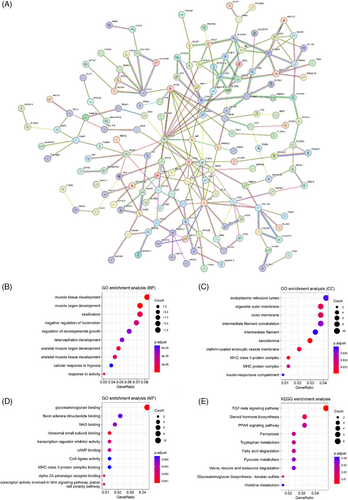
A total of 114 nodes and 256 interactions were finally enrolled for the establishment of the current PPI network (Figure 3A). These fibroblast-related genes were mainly assembled in muscle tissue development (BP, GO:0060537) (Figure 3B), sarcolemma (CC, GO:0042383) (Figure 3C), and glycosaminoglycan binding (MF, GO:0005539) (Figure 3D) function. Meanwhile, pathway analysis showed that these fibroblast-related genes were mainly enriched in pathways like the TGF-beta signaling pathway (hsa04350) (Figure 3E).
3.5 Signature genes analysis
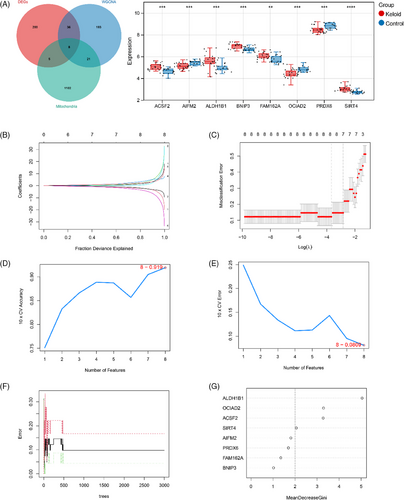
A total of eight co-genes including, ACSF2, SIRT4, ALDH1B1, OCIAD2, AIFM2, BNIP3, FAM162A, and PRDX6 were revealed based on DEGs, fibroblast-related genes, and mt-genes (Figure 4A). The results showed that all these four co-genes were differentially expressed between keloid samples and control samples. Then, three machine learning algorithms were performed on co-genes to obtain diagnostic signature genes for keloid. LASSO regression pinpointed eight significant genes (Figure 4B,C). SVM-RFE identified eight genes (Figure 4D,E). The RF algorithm revealed the top four genes based on a MeanDecreaseGini threshold of >2, among which were SIRT4, ACSF2, OCIAD2, and ALDH1B1 (Figure 4F,G). Finally, a union of the genes selected by these diverse algorithms resulted in a consolidated list of four feature genes: ACSF2, ALDH1B1, OCIAD2, and SIRT4, which are considered signature genes for further keloid research (Figure S2).
3.6 Diagnostic evaluation based on signature genes
Based on the expression of signature genes between keloid samples and control samples in both the training dataset and validation datasets, the ROC curve analysis was conducted to explore the AUC value for each signature gene. For the training dataset, the result showed that except for OCIAD2, ACSF2, ALDH1B1, and SIRT4 expression in the keloid group were dramatically up-regulated when compared with the control group (Figure 5A). The AUC value for all four genes was larger than 0.814, which showed a well diagnostic value for these signature genes (Figure 5B). The trend of the results in the validation dataset was basically consistent with that in the training dataset (Figure 5C,D). The nomogram analysis is shown in Figure 5E. Each variable was assigned a score on a point scale axis, allowing for a total score to be calculated by summing individual scores to assess the risk of pulpitis. The results demonstrated that the current nomogram was effective in estimating the risk of keloid. Additionally, the calibration curve showed minimal discrepancy between actual and predicted disease risk, indicating high predictive accuracy for keloid (Figure 5F). The DCA analysis revealed that the curve was above the gray line curve, suggesting superior clinical benefits of the patient column chart (Figure 5G). Furthermore, the clinical impact curve analysis based on the DCA curve indicated that the “Number high risk” curve closely matched the “Number high risk with event” curve when the high-risk threshold ranged from 0.6 to 1, demonstrating the nomogram's strong predictive capability (Figure 5H).

3.7 Immunological correlation analysis with signature genes
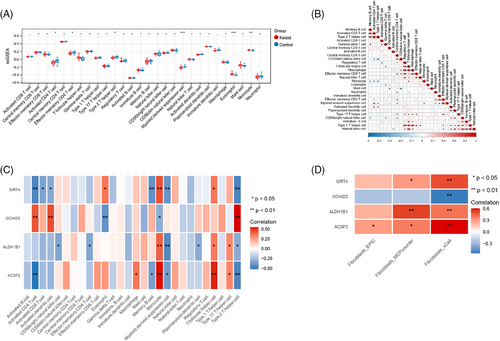
The results obtained based on ssGSEA analysis the percentages of activated CD4+ T cells, effector memory CD4+ T cells, type 2 T helper cells, and myeloid-derived suppressor cells were climatically suppressed in the keloid group than the control group (all P < 0.05), while eosinophil and monocyte were significantly stimulated in keloid group (all P < 0.05) (Figure 6A). These findings indicated distinct immune cell profiles associated with the different groups. Then, the correlation among immune cells, as well as between signature genes and immune cells were shown in Figure 6B,C, respectively. The result showed that monocyte and type 2 T helper cells were two immune cells that significantly correlated with all four signature genes (all P < 0.05). Furthermore, the correlation analysis based on fibroblast content and signature genes showed that the fibroblast content based on xCell algorithms was significantly associated with all four signature genes (all P < 0.01) (Figure 6D).
3.8 PPI investigation and drug-gene analysis based on signature genes
In this study, a PPI network was generated using the GeneMANIA database, incorporating 4 signature genes and 20 interacting genes (Figure S3). The findings indicated that the genes exhibited co-localization, co-expression, and shared protein domains, suggesting their potential involvement in regulating the inflammatory response. Then, the drug-gene interaction was investigated by using DSigDB (Table 2). For example, SIRT4 and ACSF2 were all sensitive to rifabutin, HC toxin, Decitabine, Cyclosporin A, and Vorinostat.
| Term | P-value | Combined score | Genes |
|---|---|---|---|
| rifabutin MCF7 UP | 0.001046629 | 510.9346839 | SIRT4;ACSF2 |
| HC toxin MCF7 UP | 0.001612384 | 383.1915069 | SIRT4;ACSF2 |
| Decitabine CTD 00000750 | 0.002715298 | 179.5245878 | SIRT4;OCIAD2;ACSF2 |
| 4-Hydroperoxycyclofosfamide CTD 00000594 | 0.003196351 | 2551.238662 | ALDH1B1 |
| cyclosporin A CTD 00007121 | 0.003384174 | 345300.7753 | ALDH1B1;SIRT4;OCIAD2;ACSF2 |
| nadide CTD 00006363 | 0.004592351 | 1629.201456 | ALDH1B1 |
| vorinostat MCF7 UP | 0.005400915 | 165.6509109 | SIRT4;ACSF2 |
| ACROLEIN BOSS | 0.007181036 | 938.416342 | ALDH1B1 |
| methylglyoxal BOSS | 0.00817534 | 799.3430733 | ALDH1B1 |
| hydrogen peroxide CTD 00006118 | 0.008584486 | 92.62204407 | ALDH1B1;SIRT4;OCIAD2 |
3.9 The miRNA-mRNA-TF interaction network analysis
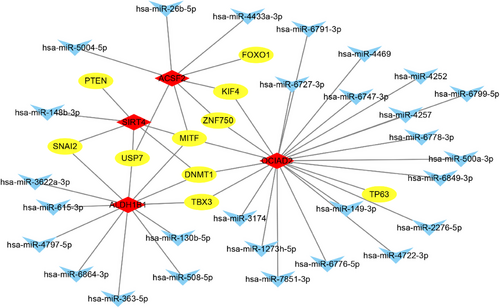
Based on 4 signature genes, the miRNA-mRNA-TF interactions that are regulated by the same miRNA were used to construct the current miRNA-mRNA-TF network. The result showed that there were 49 interactions, 10 TFs, 28 miRNAs, and 4 mRNAs in the current network (Figure 7).
3.10 The qRT-PCR analysis
The relative expression of ACSF2, ALDH1B1, OCIAD2, and SIRT4 in cultured keloid cells and normal dermal fibroblasts were investigated using qPCR. The expression of ACSF2, ALDH1B1, and SIRT4 were all significantly increased in the keloid group when compared with the normal group (all P < 0.01). Meanwhile, the expression of OCIAD2 in the normal group was dramatically higher than that in the keloid group (P < 0.01). The expression levels of the four signature genes in the validation analysis matched the results of our current bioinformatic study, confirming the reliability of our findings. A bar chart illustrating the expression of these signature genes across different groups is presented in Figure 8.

4 DISCUSSION
Keloid is a challenging clinical fibrotic disease. Although fibroblasts and mitochondrial genes play roles in keloid, the detailed diagnostic value and molecular mechanism of fibroblast-related mitochondrial genes in keloid remains unclear.10 In this study, we found significant differences in the distribution of fibroblasts between keloid and control groups, followed by 329 DEGs revealed. Then, a total of 258 fibroblast-related genes were revealed, which were primarily enriched in pathways related to muscle tissue development. By using machine learning, we screened four signature genes (ACSF2, ALDH1B1, OCIAD2, and SIRT4) based on 8 fibroblast-related mitochondrial genes. Nomogram and validation analyses confirmed the well-diagnostic performance of these four genes in keloids. Immune infiltration and drug correlation analyses showed that SIRT4 was significantly associated with immune cell type 2 T helper cells (Th2) and molecular drug cyclosporin. All these findings provided new perspectives for the clinical diagnosis and therapy of keloid.
The function of fibroblasts and their mitochondrial activity are often focal points of interest in the study of fibrotic diseases, as mitochondrial dysfunction can lead to alterations in cellular energy metabolism, thereby affecting cell proliferation, differentiation, and fibrotic responses.40 Thus, investigating mitochondrial genes associated with fibroblasts that have diagnostic value is highly important for the clinical diagnosis and treatment of scar tissue. Sirtuin 4 (SIRT4) is a mitochondrially localized gene with functions in regulating insulin secretion, lipid metabolism, and apoptosis.41 It has been proved that Sirtuin family members can influence the fibrosis process by modulating the function and activity of fibroblasts.42 Its expression in fibroblasts may affect the metabolic state and energy balance of cells, thereby impacting the development and maintenance of diseases including hypertrophic scars and keloid.43 SIRT4 has significant diagnostic and therapeutic potential in various diseases. For instance, in diabetes, SIRT4 plays a role by inhibiting insulin secretion and lipid metabolism.44 In tumors, the expression levels of SIRT4 are associated with apoptosis and metabolic reprogramming, potentially serving as a biomarker and therapeutic target.45 Ovarian Carcinoma Immunoreactive Antigen Domain Containing 2 (OCIAD2) is a gene that plays a crucial role in cell adhesion, migration, and the proliferation and invasion of cancer cells.46 The high expression of OCIAD2 in cancers has been extensively studied, and it is considered a diagnostic and prognostic marker.47 However, the related study for OCIAD2 in fibroblasts and keloid formation is very rare. Aldehyde Dehydrogenase 1 Family, Member B1 (ALDH1B1) is one of the family members involved in the metabolism of acetaldehyde. The expression level of ALDH1B1 in fibroblasts is directly associated with mitochondrial function, influencing cellular metabolic status.48 Studies have found that ALDH1B1 may play a crucial role in scar formation by regulating mitochondrial redox status and antioxidant capacity.49 Despite being identified as a potential biomarker in human diseases such as colorectal cancer,50 its role in fibrotic diseases like scar formation remains elusive. Acyl-CoA Synthetase Family Member 2 (ACSF2) is an acyl-CoA synthetase crucial for cellular energy metabolism, fatty acid β-oxidation, and lipid storage. It has been demonstrated that ACSF2 can influence the fibrosis process by regulating lipid metabolism and energy balance in fibroblasts.51 The expression levels of ACSF2 in human tissue is associated with metabolism disorders and resistance, making it a potential diagnostic marker.52 In this study, we identified four fibroblast-related mitochondrial genes, SIRT4, OCIAD2, ALDH1B1, and ACSF2, with diagnostic value through machine learning and diagnostic analysis. The diagnostic value analysis indicated that all four genes exhibit good diagnostic performance in keloid. Importantly, the qPCR analysis showed that the expression of four signature genes was consistent with the findings of our current bioinformatic study, affirming the reliability of our results. Therefore, we speculated that SIRT4, OCIAD2, ALDH1B1, and ACSF2 may be involved in the expression and functional regulation of fibroblasts in keloid, representing new signature genes for keloid. Further in-depth research into the mechanisms of these genes in disease may provide new insights and methods for the clinical diagnosis and treatment of keloid.
The normal development of muscle tissue involves complex regulatory mechanisms including, cell proliferation, differentiation, and tissue remodeling. However, in keloid disease, these mechanisms may be disrupted, leading to abnormal formation and excessive growth of scar tissue.53 It has been proved that aberrant signaling pathways (such as cGMP-PKG signaling pathway) or gene (such as BMP4, MSX1, and HAND2) expression during muscle tissue development may influence the occurrence of keloid formation.54 Disruptions in this process can lead to aberrant fibroblast activity, further contributing to keloid pathogenesis. In keloid, certain genes associated with muscle tissue development may be abnormally expressed, leading to hyperactive fibroblasts and aberrant collagen accumulation.55 For example, the TGF-β (transforming growth factor-beta) pathway is overactivated in keloid formation, and genes closely related to muscle tissue development are also regulated by this pathway.56 In fact, fibroblasts play important roles in both muscle tissue development and scar formation, participating in processes such as cell proliferation, extracellular matrix synthesis, and cell signaling.57 Additionally, mitochondrial dysfunction may impact the signaling pathways that govern fibroblast behavior during muscle tissue development.58 For instance, the impaired bioenergetics in fibroblasts can result in a shift towards anaerobic glycolysis, promoting a pro-fibrotic environment through enhanced collagen synthesis and secretion.59 This metabolic shift could be a driving force behind the persistent and exaggerated fibrotic response observed in keloid. In this study, the GO analysis showed that fibroblast-related genes were mainly assembled in pathways related to muscle tissue development function. Thus, we speculated that muscle tissue development function might play an important role in the progression of keloid. A further investigation on muscle tissue development may help inhibit the abnormal behavior of fibroblasts, thereby reducing the formation and expansion of keloid.
Inflammatory response and persistent immune cell infiltration promote fibroblast proliferation and collagen synthesis through the release of various cytokines and growth factors, leading to excessive fibrous tissue growth and keloid formation.60 Th2 cells are a subtype of T cells that regulate immune responses primarily through cytokine secretion.61 The main cytokines secreted by Th2 cells include IL-4, IL-5, IL-10, and IL-13, which are highly expressed in keloid.62, 63 They can directly act on fibroblasts, promoting their proliferation and collagen synthesis, thereby playing a crucial role in keloid formation.64 Interestingly, both SIRT4 gene and cyclosporin drug can affect T cell function by regulating cell metabolism. SIRT4 primarily regulates T cell function through metabolic pathways, while cyclosporin exerts its effects on T cells by inhibiting calcineurin.65, 66 During metabolic stress, the regulation by SIRT4 might affect the immunosuppressive efficacy of cyclosporin. Actually, SIRT4 has already proven to be a useful drug target in various diseases like Parkinson.67 In the current study, the drug-target gene analysis for keloid showed that SIRT4 was the target gene of the molecular drug cyclosporin. Meanwhile, the immune infiltration investigation showed that immune cell Th2 was significantly correlated with all four signature genes. Thus, we speculated that cyclosporin might influence the biological function of Th2 cells via targeting SIRT4, which further contributes to the therapy of keloid. Nonetheless, this study had limitations, including a small sample size and the absence of animal validation tests. Therefore, a validation study with a larger sample size is warranted to confirm all conclusions drawn in our research.
5 CONCLUSION
In conclusion, the fibroblast-related mitochondrial genes including SIRT4, OCIAD2, ALDH1B1, and ACSF2 were novel signature genes for keloid diagnose. The muscle tissue development function might play a vital role in the development of keloid. The drug cyclosporin might influence the biological function of Th2 cells via targeting SIRT4.
ACKNOWLEDGMENTS
This work was supported by Weifang Municipal Health Commission Scientific Research Project, Grant/Award Number: WFWSJK-2023-111.
CONFLICT OF INTEREST STATEMENT
The authors declare no conflicts of interest.
Open Research
DATA AVAILABILITY STATEMENT
The data that support the findings of this study are available on request from the corresponding author. The data are not publicly available due to privacy or ethical restrictions.


