Mobile snapshot hyperspectral imaging device for skin evaluation using diffractive optical elements
Abstract
Objective
A mobile handheld snapshot hyperspectral imaging device was developed and tested for in vivo skin evaluation using a new spectral imaging technology.
Methods
The device is equipped with four different LED light sources (VIS, 810 nm, 850 nm, and 940 nm) for illumination. Based on a diffractive optical element (DOE) combined with a CMOS sensor chip, a snapshot hyperspectral imager is achieved for the application on human skin. The diffractive optical element (DOE) consists of a two-dimensional array of identically repeated diffractive microstructures. One hyperspectral image for all wavelength regions is taken within a few seconds. Complex recalculation of the VIS spectral distribution and image information from the received DOE image requires several minutes, depending on computing performance. A risk assessment on the irradiation sources shows no risk of harm due to the LED radiation.
Results
Skin tone color patches experiments reproducibly deliver images and spectra of different skin tones. First in vivo use of the device identified pigmentation changes within the field of view.
Conclusion
We present a working mobile snapshot hyperspectral imaging tool based on diffractive optical elements. This device or future developments thereof can be used for broad skin evaluation in vivo.
1 INTRODUCTION
Reflection spectroscopy is known as a non-invasive technology for the evaluation of healthy1-5 and diseased human skin.6, 7 Recently, for both applications, the combination of spectroscopy and imaging within one device was introduced as hyperspectral imaging.8 The goal of spectral imaging (SI) is to obtain the spectrum for each coordinate in the image of a scene by a single shot. Several acquisition techniques and applications of hyperspectral imaging were described.9 There are four basic techniques for acquiring the three-dimensional (x, y, λ) dataset of a hyperspectral cube: spatial scanning, spectral scanning, non-scanning, and spatio-spectral scanning.9 The choice of technique depends on the specific application, seeing that each technique has context-dependent advantages and disadvantages. Various main applications are described, including agriculture, food processing, mineralogy, or surveillance and environment. Furthermore, various HSI systems for medical applications are described differing in acquisition technology, wavelength range, data processing, and image analysis.10 Medical applications are cancer diagnosis in various tissues, including skin.10, 11 However, skin applications also include wound characterization,12, 13 bruises,14 and systemic sclerosis.15 More recently, skin evaluation was even conducted using “pseudo”-hyperspectral images recalculated from RGB smartphone images.16
A diffractive optical element (DOE) employs microstructure patterns to use diffraction for selecting the wavelength.17, 18 Suitable microstructures, once properly designed, manipulate the light to almost any desired intensity profile or shape19 and especially in dependence on the wavelength. This property can be employed for hyperspectral imaging.
Conclusively, the task is to develop a new handheld snapshot, non-scanning, hyperspectral imaging device20 for skin analysis, combining a LED illumination ring with a spectral detector based on a diffractive optical element (DOE). A prototype was established, and in vitro tests and initial in vivo examinations were performed.
2 MATERIALS AND METHODS
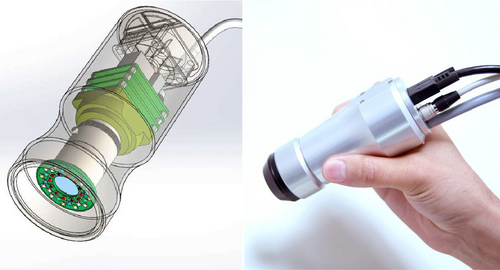
The prototype concept of a DOE-based spectral imager consists of two main components, the illumination ring and the DOE-based detector unit (Figure 1).
2.1 Illumination ring
In order to get an illumination for the VIS and NIR region, a white light LED in combination with LEDs of 810 nm, 850 nm, and 940 nm was integrated into an illumination ring. The ring was positioned at the front of the device and adjusted to cover an object field of ~10 mm × 10 mm with a regular irradiation profile. The VIS part of the illumination spectrum is covered by a ring of 12 broadband white light LEDs (inner ring in Figure 2), while the NIR support is provided by three 810 nm, six 850 nm, and three 940 nm LEDs (outer ring, see Figure 2). The diametrical arrangement of each LED type is capable to secure a sufficiently homogeneous field of illumination, as was tested with a homogeneously reflecting surface.
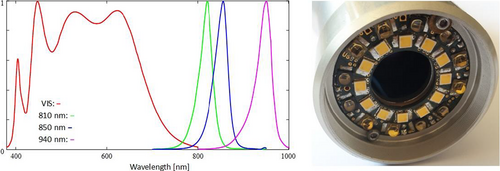
The customized circuit board allows software control of all LEDs in the irradiation ring. The wavelength regions can be accessed and activated individually, and a matching electronic module allows strobing all switchable LEDs at programmable frequencies and on/off ratios for average brightness control. Furthermore, the activation is fully synchronized with the set exposure time regime of the camera. This is essential for temperature management of the light source and the device altogether, as well as providing the necessary illumination intensity. An estimation of the photobiological safety (regarding all relevant damage mechanisms of skin and eye) based on the specifications of the LED illumination showed that the illumination was safe for exposure times of more than 10 s until the exposure limits according to DIN EN 62 471 are reached. This was obtained assuming continuous illumination. However, the LEDs were pulsed such that irradiation occurs only in 5% of the total measurement time, which increases the safety limits further. Exposure times during test measurements were 2s or less.
2.2 Detector unit
- By the diffraction performance of the DOE, combined with the sampling accuracy of the diffraction pattern (ratio of the number of camera pixels per single diffractive microstructure), and
- By the quality of the calibration.
2.3 Calibrating the DOE-CMOS sensor assembly for the VIS spectral region
A core task for the detector unit's functionality lies in the exact positioning of the DOE/pinhole stack in relation to the front of the CMOS sensor chip. For this, a combined alignment and calibration stand was developed and realized (Figure 3). In a dust-free housing, the uncovered camera is bracket-mounted at a fixed position, while the DOE-stack can be precisely positioned in front of it along six axes, for translation, (cardan) tilt, and rotation. The stand is capable of sub-μm step width adjustments. The translational movement is realized in two velocity stages, with rough stepper motors, and with piezo-electric transducers (PZT).
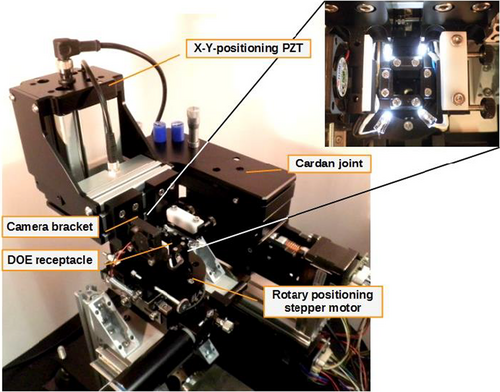
The ideal distance of the DOE to the camera is defined by the DOE layout and fixed at <100 μm, by comparing real obtained diffraction patterns of the DOE with simulated data from the DOE design. This assembly distance is a design parameter of the respective single, periodically repeated microstructure, providing maximum spectral resolution (distinguishable diffraction patterns) in a desired spectral region.
After assembly, the DOE has to be calibrated in relation to the CMOS sensor chip. The calibration step consists of recording the monochromatic response of the DOE over the whole CMOS sensor chip, including the designated objective for the final device. In the VIS range, the DOE-CMOS objective assembly is illuminated by a range of single narrowband wavelengths, generated from the broadband emission of a bright Xe arc lamp in combination with a monochromator. Thus, the pixelated diffraction patterns of each single microstructure at a given wavelength are recorded as a set of digital images. This image data set is preprocessed and optimized in order to serve as a mathematical base for the spectral reconstruction.
Temperature stability is critical in terms of relative positioning in the assembly. Therefore, heat management was optimized. Furthermore, remaining inaccuracies are overcome in the reconstruction step by experimentally correcting to a white normal. The overall performance of the assembly is based on the combination of spectral sensitivity of the CMOS sensor chip, as well as the illumination intensity of the calibration and illumination light sources. All together allow a reliable reconstruction for wavelengths of 430 nm to 700 nm, in steps of 10 nm.
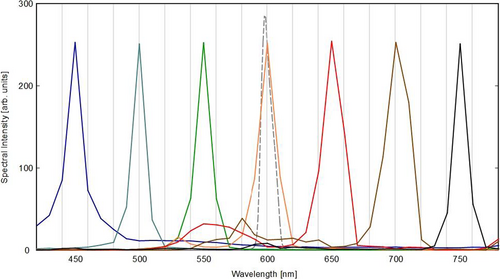
The spectral reconstruction algorithm—outlined below—was developed and optimized for maximum spectral accuracy. Figure 4 shows the fidelity of the obtained spectral results reconstructed from 7 calibration images over the whole VIS range. Also shown for comparison is the exemplary line shape of the original 600 nm calibration output of the monochromator.
2.4 Reconstruction of spectra and images from DOE-CMOS sensor recordings
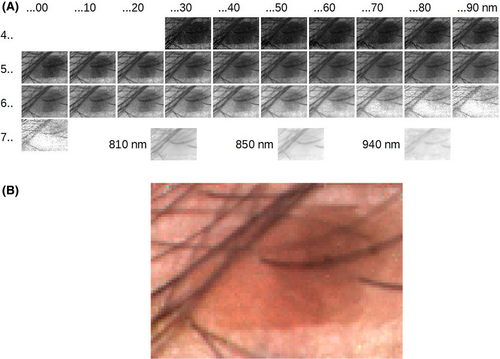
For optimal reconstruction of spectral data, one has to find the weighted fractions of reflected light from every spectral pixel of the observed surface, resolved for VIS-range wavelengths. Mathematically, the challenge is to find for every spatial image coordinate (ie, every single diffractive microstructure) the best fit of composition of the object diffraction pattern, constructed with a base of 28 single wavelength diffraction patterns from the calibration. The weighting must be evaluated taking into account the particular spectral response of every single microstructure, the spectral and spatial emission characteristic of the calibration and illumination light sources, and the spectral sensitivity of all camera pixels of the CMOS sensor. This evaluation of the best fit composition of wavelengths was developed as a two-stage algorithm. The first-approximation spectral shape is obtained by an evolutionary approach. The second stage comprises an analytical parameter-adjustable refinement of the first-approach results. It also includes a mathematical constraint for consistency and plausibility of physically meaningful spectral shapes. An example is shown in Figure 5.
The spectral correction for the light sources is realized by performing the above-described reconstruction on the DOE diffraction image of a white normal, using the obtained information as weighting factors for the target object diffraction pattern. In order to cope with short-term temperature influences on the sensitivity of the CMOS sensor chip and the mechanical state of the DOE-CMOS sensor assembly, the corresponding white normal image must be taken immediately after recording of the target image, which is controlled and managed by the operation software.
The images in the NIR region are taken as particular images with illumination by each single (rather more broadband) wavelength. They only consider the light amount that passes each respective DOE, rather than the shape of the diffraction pattern, and are thus not considered in the above-described reconstruction algorithms. This strategy was chosen because of the disjointed character of the available illumination spectrum (Figure 2), but also due to the vastly different sensitivities of the CMOS sensor in the VIS and the NIR range. The developed software thus allows extensive control over conditions such as illumination and exposure times, selective for all spectral ranges. Besides the spectral reconstruction, it also incorporates the presentation of the evaluated results, including the images per spectral channel as shown in Figure 5B, and the spectral distribution at single spectral pixels or selectable regions.
3 RESULTS
3.1 Accuracy and reproducibility of the device prototype
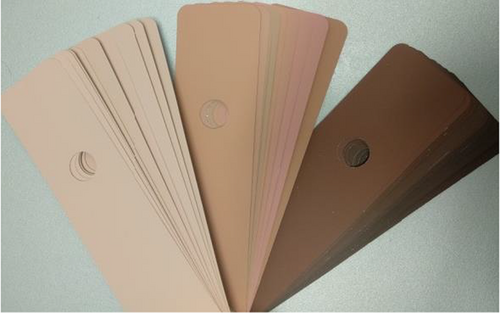
In order to quantify the reproducibility and the accuracy of the device, various defined skin colors assembled to a guide (Pantone SkinTone™ Guide, Pantone) were used (Figure 6).
First, we investigated the robustness of the measurement procedure due to changes in the exposure time. The optimum value of the exposure time, that is, the longest possible exposure time at which no camera pixel is saturated, was first compared with shorter exposure times. Longer exposure times lie even further in the saturation range and are thus not reasonable. Using the example of light (Pantone SkinTone™ Guide: 1Y01) and dark (Pantone SkinTone™ Guide: 4R15) color cards it could be shown in the examined area that the spectra up to approx. 660 nm are independent of the (optimal) exposure time (Figure 7A and Figure 7B). The system is robust here and therefore tolerates certain deviations from the optimal value, which is important for later use on the skin, because it is less uniform than a color card. At longer wavelengths, the difference between the spectra increases beyond approx. 660 nm, since the illuminance of the LED is already decreasing here. In addition, the repeat measurements (duplicates, as shown in Figure 7) carried out showed a high reproducibility of the measurement results and the stability of the system (Figure 7). Comparable results were obtained multi-centrally with measurements from four partners.
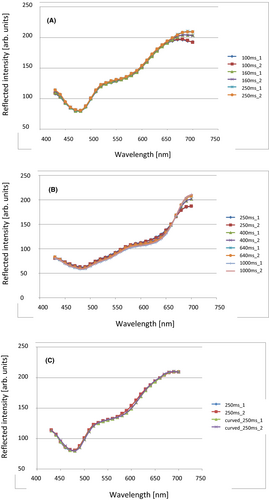
To simulate more realistic conditions, the constancy of the measurements was also checked on a slightly curved surface (analogous to, for example, a human arm). A slight curvature had no significant influence on the spectral shape of the example measurements (Figure 7C).
A spectral image taken in one snapshot of two combined, bright (1Y01) and dark (4R15), skin color cards is shown in Figure 8. It is shown that it is reproducibly possible to differentiate between the darker and brighter colored pixels, only between 450 nm and 480 nm a spectral difference for the light color sheet is noticeable. For a better comparison of the spectra, only values normalized to 1 were compared, as the darker color is obviously a lot less reflecting within the visible spectrum than the bright color.
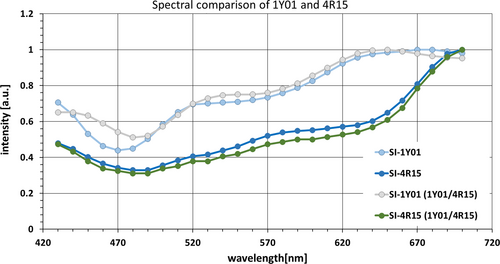
Despite a certain variety in the spectral reconstruction for each single spectrometer channel, the reliability and reproducibility in classifying related skin tones are significant, if spectral pixel averages over greater areas are considered.
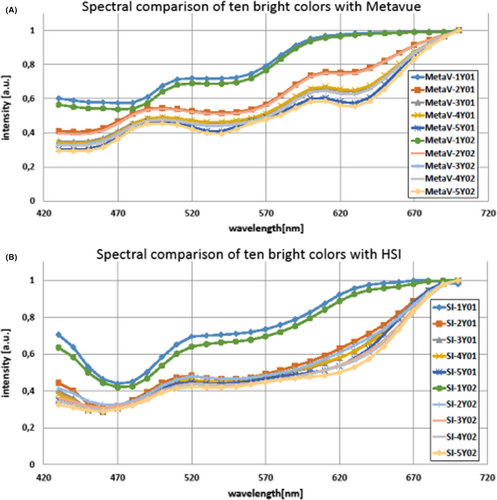
For further evaluation, we compared the spectra of optically nearly indistinguishable skin color cards with each other. For this, the first ten bright colors of the pantone skin color scale, from 1Y01 to 5Y02, were examined. Furthermore, a comparison of our hyperspectral device with a “gold standard” device, a spectral device that is already in use as a standard (Metavue xrite 2000), was conducted (Figure 9). Two skin colors indicated by the green and the blue lines in Figure 9 seem to be spectrally more distinct from the others and can be identified as 1Y01 and 1Y02 with both devices. However, there are some differences in the spectra of our snapshot hyperspectral imaging device in comparison with the gold standard device. Still, the overall spectral correlation of both devices is high. The existing deviations can possibly be eliminated in the future by an even more sophisticated spectral calibration of our device.
3.2 In vivo skin recordings
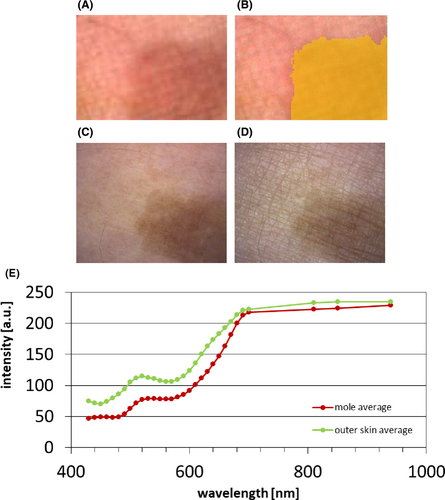
Two examples of in vivo skin recordings are described below. The first one demonstrates the imaging capabilities on the example of a mole on the skin of one author.
Figure 10 shows the color image of one author's skin with pigmented lesion as compared to a color camera (Visioscope PC 35). The spatial resolution is reduced compared with a conventional color image due to the use of multiple pixels for a simultaneously acquired spectrum; however, the resolution is still sufficient in order to recognize skin features. The resulting average spectrum of the pigmented lesion shows a decreased intensity as compared to the average spectrum of the surrounding skin, as would be expected from the optical properties of melanin.
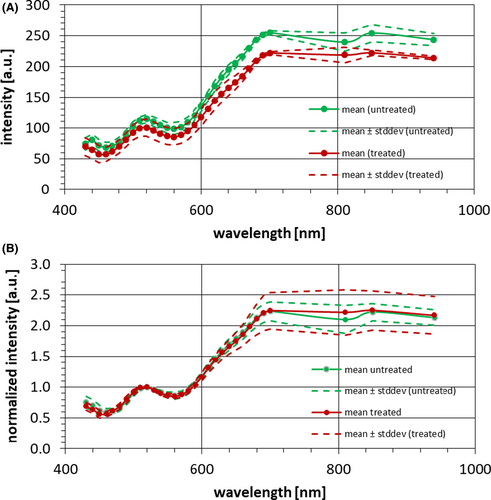
The second example of in vivo application is a small study (N = 7) taking spectra on the forehead of the volunteers before and after cleaning with alcohol wipes. In parallel, the forehead was measured using a Sebumeter SM 815 (Courage & Khazaka). Before cleaning a mean Sebumeter value of 11 was found. After cleaning the value dropped to a mean of 0.4.
In Figure 11, the mean spectra and their standard deviations are shown of forehead measurements before and after cleaning the forehead with an alcohol wipe. Figure 11A shows the spectra without further normalization. Figure 11B shows the same mean spectra and their standard deviation normalized to a value of 1 at an arbitrary wavelength, here 520 nm. This normalization eliminates global shifts, which correspond to a change of reflectivity that is uniform over the whole spectral range. Thus, differences in particular wavelengths or sections of the spectrum can be compared more readily.
4 DISCUSSION
There is a need to develop fair-priced, miniaturized on-site diagnostic systems that enable uncomplicated, quick, and precise diagnostic of the skin.21 The multi-wavelength, spectral imaging device developed is a step to reliable, precise, mobile, and inexpensive devices that can be used in dermatology, cosmetics, and research, and may help to improve medical care.
The system developed was qualified using Pantone color cards (Pantone SkinTone™ Guide). The results of this qualification showed a high level of reproducibility of the spectral information and insensitivity to different lighting conditions (using the example of suboptimal exposure time). In addition, the customized software works fine and is user-friendly. Furthermore, the color card experiment shows that the system can be used to capture different light or dark areas in the same image. This is of crucial importance for a clinical application for the detection of different pigmentation on the skin.22 A comparison with spectra taken with a gold standard device23 and our snapshot hyperspectral imaging device showed a good correlation using bright color cards as exemplary test object. Furthermore, these experiments show that a spectral differentiation is possible even with skin tones that are hardly distinguishable by eye. More sophisticated calibrations will likely lead to an even better match of the spectral details with the gold standard spectra.
The example image of an author's pigmented lesion shows potential applications. The color image has a reduced spatial resolution but is still sufficient to recognize skin features, while providing spectral differences simultaneously. The trend of the spectral differences is plausible due to the absorption properties of melanin. However, a more detailed analysis for further interpretation of spectral differences is necessary.
The sebum study on a small group of volunteers indicates that the shine of the sebum is quantifiable with the hyperspectral imaging device. Without cleaning the skin the mean spectrum showed higher intensities over the whole wavelength range. However, significant differences within the spectra, for example, due to the sebum's own spectral properties could not be seen. Further studies with more subjects and comparison measurements with other devices are needed to be able to distinguish the various amount of sebum on skin.
However, it has already been clearly shown from the literature that spectral analysis is suitable for various applications in dermatology and can also be used for medical diagnostics. This opens up a wide range of applications for the SI device qualified in this study.
5 CONCLUSION
Summarizing, we explored a highly innovative spectral imaging device for in vivo skin evaluation for various applications. The developed snapshot hyperspectral handheld imaging device with the above-mentioned technical specifications is mobile, small, and light enough for easy handling during skin evaluation.
ACKNOWLEDGEMENT
This research has been funded by the Federal Ministry of Education and Research of Germany as part of the DermaSpec project (number 13N13840-4). We thank S. Jaspers for helpful discussions and H. Wenck (Beiersdorf AG) for manuscript reviewing.


