IL-6 is associated with expansion of myeloid-derived suppressor cells and enhanced immunosuppression in pancreatic adenocarcinoma patients
Funding information
This study was financially supported by the intramural research grant of the Post Graduate Institute of Medical Education and Research (PGIMER), Chandigarh, India (71/2-EDU-16/1166)
Abstract
Chronic inflammation favours the expansion of myeloid-derived suppressor cells (MDSCs) by secreting pro-inflammatory mediators. The role of MDSCs in mediating immunosuppression in pancreatic adenocarcinoma and in defining a premalignant route from chronic pancreatitis remains unclear. We aimed to study the immunosuppressive potential of all subsets of MDSCs and their correlation with inflammatory cytokines in pancreatic adenocarcinoma and chronic pancreatitis. Relative frequencies of MDSCs, immunosuppressive markers arginase-1 (ARG-1), programmed death-ligand 1 (PD-L1), reactive oxygen species (ROS) and cytokines in circulation and surgically resected local pancreatic tissue of chronic pancreatitis and pancreatic adenocarcinoma patients were analysed by multicolour flow cytometry and cytokine bead array, respectively. Levels of cytokines involved in MDSCs activation were analysed by ELISA, and the immunosuppressive nature of MDSCs was confirmed by T-cell suppression assay. Frequencies of circulating MDSCs and ARG-1, PD-L1, and ROS were significantly higher in pancreatic adenocarcinoma than healthy controls and showed a significant positive correlation with MDSCs burden in cancer tissue. Serum levels of cytokines IL-6, IL-8 and IL-10 were significantly elevated in pancreatic adenocarcinoma. IL-6 serum levels showed a significant positive correlation with frequencies of circulating MDSCs in pancreatic adenocarcinoma patients, and MDSCs mediated suppression of T-cell proliferation in vitro was associated with elevated IL-6 levels in the cell culture medium. Collectively, our results suggest that IL-6 plays a crucial role in the expansion of MDSCs and activating their immunosuppressive nature in pancreatic adenocarcinoma. The relative frequency of MDSCs in circulation can be used as a potential diagnostic biomarker for pancreatic cancer.
1 INTRODUCTION
Pancreatic ductal adenocarcinoma (PDAC) is the fourth most dreadful type of cancer and accounts for 90%-95% of total pancreatic cancer (PC) cases reported worldwide.1 The overall survival rate of patients with PC in both sexes is very low, that is <5% survival after five years.2 Despite significant advances in cancer biology, PC incidence and mortality rates rise continuously every year.3 As per GLOBOCAN 2020 data, it was estimated that its incidence and mortality rate would increase many times in coming years4 and will surpass breast cancer to become the third leading cause of cancer-related deaths by 2025.5 During chronic inflammation, such as chronic pancreatitis, pancreatic stroma secretes various pro-inflammatory mediators (IFN-γ, IL-6, IL-8, TNF-α, IL-1β, IL-12 and reactive oxygen species), which pave the way towards malignant transformation in the pancreas.6 Pancreatic tumour stroma possesses a highly heterogeneous milieu comprised of various immune cells such as tumour-associated macrophages (TAM), T regulatory cells (Tregs), myeloid-derived suppressor cells (MDSCs) and stellate cells (cancer-associated fibroblasts), and tumour cells. The interplay among these cells generates a highly resistant tumorigenic microenvironment for anti-cancer therapies by secreting numerous growth factors such as IL-6, TGF-β and GM CSF and by overexpressing mesenchymal transition activator genes such as N-Cadherin, Vimentin, ZEB-1 and Snail.7-9 Presently, there is increased curiosity in knowing how chronic inflammation interact with tumour microenvironment and influence host anti-tumour immunity by causing immune suppression through MDSCs.
The MDSCs are defined as immature cells of myeloid lineage (hematopoietic system) that start accumulating due to abnormal myelopoiesis under inflammatory conditions. As per the latest classification strategy, human MDSCs are classified as granulocytic MDSCs (G-MDSCs) and monocytic MDSCs (M-MDSCs) based on the presence of CD15 and CD14 marker, respectively, along with Lin−(CD3/19/56) HLA-DRlow/− CD11b+ CD33+ markers. Another subset characterized as HLA-DRlow/− CD11b+ CD33+ CD14− CD15− is referred to as early MDSCs (E-MDSCs).10 Earlier, few studies have indicated the presence of immunosuppressive MDSCs in an experimental model of mice with pancreatic carcinoma11-13 and PDAC patients14, 15 during tumour progression. These MDSCs are heterogeneous regarding their phenotype and can vary with the cancer type, inflammatory status and disease severity.16-19 Therefore, it is imperative to study the percentage and functional importance of each subset of MDSCs in pancreatic adenocarcinoma patients. Incessant secretion of pro-inflammatory cytokines during chronic inflammation might stimulate the accumulation and expansion of MDSCs, thereby inhibit normal T-cell-mediated anti-tumour immunity and lead to malignant transformation.20-22 MDSCs were found to display their immunosuppressive activity through ARG-1,23, 24 inducible nitric oxide synthase (iNOS),20 PD-L1,25 cyclooxygenase 2 (COX2)26 and by ROS production.27 Inflammatory tumour stroma can alter the normal immune cell phenotype and encourage the differentiation of immature myeloid cells (IMCs) into MDSCs, thereby leading to immunosuppression.28 Therefore, MDSCs might be synergistically related to inflammatory cytokines during malignant transformation of PDAC. It would be interesting to determine their key role in the generation of immunosuppressive and resistant tumour microenvironment in PDAC patients. In addition to this, MDSCs mediated immunosuppression might vary with cancer grade and stage; therefore, studying the correlation of different subsets of MDSCs with clinicopathological features of patients will aid in novel anti-cancer therapies. Therefore, we planned to characterize every potential subset of MDSCs in pancreatic adenocarcinoma and chronic pancreatitis patients and determine their immunosuppressive potential. Along with this, we have evaluated the inflammatory status of PDAC patients by studying various cytokines and then extend our findings by studying their correlation with frequencies of different MDSCs subsets in order to decipher their involvement in MDSCs accumulation and activation and suppression of anti-tumour immunity.
2 MATERIAL AND METHODS
2.1 Patients and healthy donors
The study cohort comprises of 20 pancreatic adenocarcinoma patients [median age 56.50 (46.25-65.75) years] and 10 chronic pancreatitis patients [median age 39 (33-60) years], admitted for the surgery of PC (pancreatoduodenectomy—Whipple's procedure) and chronic pancreatitis (Frey's procedure) respectively between 2017 and 2019 at the Department of General Surgery (Surgical Gastroenterology), Postgraduate Institute of Medical Education and Research (PGIMER) Chandigarh, India. Patients recruited were diagnosed for the first time and had not taken any previous medications, including radiotherapy and chemotherapy. Sixteen healthy control participants [median age 36 (32-41) years] having no significant medical history were also recruited. The study protocol was approved by the institutional ethical committee (Approval No. INT/IEC/2017/1282), and written informed consent was taken from each subject recruited for this study. The clinicopathological features of recruited subjects relevant to this study are mentioned in Table S1.
2.2 Sample collection and processing
Peripheral blood (7-8 mL) was collected from all the CP and PDAC patients (prior to surgery) and healthy controls in heparinized vials. Blood samples were processed to obtain peripheral blood mononuclear cells (PBMCs) using HiSepTM LSM 1077 (LS001, HiMedia Laboratories Pvt. Ltd.) through ficoll density gradient centrifugation for phenotypic characterization of MDSCs by flow cytometry. Additionally, 4-5 mL blood samples were collected in plain vials, and serum was isolated from them and stored in a deep freezer (−80°C) for studying inflammatory cytokine by cytometric bead array. Pancreatic tumour tissue samples (n = 20), peritumoural tissue samples (n = 6) about 2 cm away from cancer margin and chronic pancreatitis tissue samples (n = 10) were collected in sterile falcon containing RPMI-1640 culture medium (A10491-01, Gibco) supplemented with Antibiotic-Antimycotic 100X solution (10 000 U Penicillin, 10 mg Streptomycin and 25 µg Amphotericin B per mL in 0.9% normal saline, A002A; HiMedia Laboratories Pvt. Ltd., India) and immediately transported to the laboratory in the icebox. Surgically resected tissue samples after thorough washing with sterile D-PBS (TL1022; HiMedia Laboratories Pvt. Ltd.) were minced and incubated overnight in RPMI-1640 media containing 1 mg/mL of enzyme collagenase hyaluronidase cocktail (TCL118; HiMedia Laboratories Pvt. Ltd.) in an incubator shaker (150 rpm, 37°C). A single-cell suspension was obtained using a 70 µm cell strainer (TCP025; HiMedia Laboratories Pvt. Ltd.) and was used to characterize MDSCs through flow cytometry. Cell suspension supernatant was kept for evaluation of cytokines through cytometric bead array.
2.3 Antibodies for flow cytometry
Various anti-human monoclonal antibodies (mAbs) such as anti-CD3 FITC (555339, clone HIT3a), anti-CD4 APC (551980, clone L200), anti-CD19 FITC (555412, clone HIB19), anti-CD56 FITC (562794, clone B159), anti-HLA-DR APC-H7 (561358, G46-6), anti-CD11b BV421/PacBlue channel (742637, clone D12), anti-CD33-BV510/AmCyan-A channel (744351, clone HIM3-4), anti-CD14 PerCP-Cy5.5 (550787, clone M5E2), anti-CD15 PE-Cy7 (560827, clone HI98) and anti-CD274/PD-L1 APC (563741, clone MIH1) were purchased from BD Biosciences while anti-CD3 PE (300308, clone HIT3a) from BioLegend and anti-human ARG-1 PE (IC5868P) from R&D systems.
2.4 Phenotypic characterization of MDSCs by flow cytometry
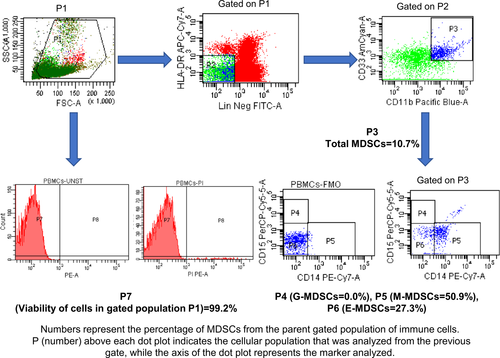
For flow cytometric analysis, PBMCs and single-cell suspension were stained with mAbs directed against CD14, CD15, CD11b, CD33, HLA-DR and Lin (CD3, CD19 and CD56). The stained cells were detected using BD FACS CantoII flow cytometer and analysed by FACSDivaTM software v.6.1.3 (BD Biosciences, CA, USA). Through appropriate gating strategy, Lin− (CD3/19/56) HLA-DRlow/− CD11b+ CD33+ cells were referred to as total MDSCs. The monocytic and granulocytic subsets of MDSCs were identified by surface expression of CD14 and CD15 markers, respectively, while another subset that did not show positivity for CD14 and CD15 markers were designated as early MDSCs. The relative frequency of each subset of MDSCs was determined in all the recruited subjects using unstained and fluorescence minus one (FMO) tube as a negative control for gating of positive cells. Gating strategy in this regard has been shown in Figure 1.
2.5 Detection of ARG-1 and PD-L1 expression in MDSCs by flow cytometry
For determining the immunosuppressive activity of MDSCs ARG-1 (PE) and CD274/PD-L1 (APC), mAbs were used. The quantity of antibodies used was standardized for each 100µl of the sample used in the experiments, and samples were processed as per established protocol. Briefly, the cell suspension and PBMCs were incubated with various antibodies of MDSCs [CD14, CD15, CD11b, CD33, (Lin-CD3, CD19 and CD56) and HLA-DR] and anti-PD-L1 for 30 minutes in the dark at room temperature and washed with PBS (M1866; HiMedia Laboratories Pvt. Ltd.). The pellet so obtained was suspended in 200 µL of 1X fixation buffer (00-8222-49; Invitrogen) followed by a 15-minute incubation at 4°C in the dark and then permeabilized by 1 mL permeabilization buffer (00-8333-56, Invitrogen). Samples were labelled with ARG-1 mAb for intracellular assessment of arginase in MDSCs, followed by 30 minutes incubation in the dark at 4°C. Lastly, the pellet was resuspended in 300 µL PBS for analysis. The per cent expression of ARG-1 and PD-L1 was measured on the parent population of G-MDSCs, M-MDSCs and E-MDSCs through flow cytometry (BD FACS CantoII flow cytometer and FACSDivaTM software v.6.1.3; BD Biosciences). Gating strategy in this regard has been shown in Figure S1.
2.6 Determination of ROS production by MDSCs
For analysing ROS production by MDSCs, PBMCs and cell suspension were incubated separately with 5 µM cell-permeable oxidation sensitive molecule 2, 7-dichlorofluorescein diacetate (DCFDA), (D6883, Sigma-Aldrich) in RPMI 1640 media at 37°C for 10 minutes followed by washing twice with cold FACS buffer. The cells were stained with human monoclonal antibodies directed against CD15, CD14, CD11b, CD33 and HLA-DR. ROS production by G-MDSCs, M-MDSCs and E-MDSCs was detected using BD FACS Canto II flow cytometer in terms of intensity of dichlorofluorescein compound (FITC channel) produced inside the cells after cleavage of DCFDA by cellular esterases. Gating strategy in this regard has been shown in Figure S2. The data were analysed using BD FACS Diva software v.6.1.3 (BD Biosciences) in terms of median fluorescence intensity (MFI), which represents ROS production by MDSCs.
2.7 Analysis of inflammatory cytokines by cytometric bead array
Various cytokines (IL-1β, IL-6, IL-8, IL-10, IL-12 and TNF-α) relevant to the generation of MDSCs were evaluated in the serum samples from PDAC, CP patients, and healthy controls and cell suspension supernatant samples from PDAC and CP patients using Human Inflammation cytometric bead array kit (551811, BD Biosciences). In brief, 50 µL of serum or cell suspension supernatant samples and 50 µL of mixed capture beads were added to assay tubes and incubated at room temperature for 1.5 hours, followed by washing. Subsequently, 50 µL of PE detection reagent was added to all the assay tubes and incubated for another 1.5 hours. Assay tubes were acquired on the FACS Canto flow cytometer (BD Biosciences), and the data were generated, which was analysed using FCAP ArrayTM software v3.0 (BD Biosciences). Results were expressed as pg/mL.
2.8 Assessment of immunomodulatory function of MDSCs by T-cell suppression assay
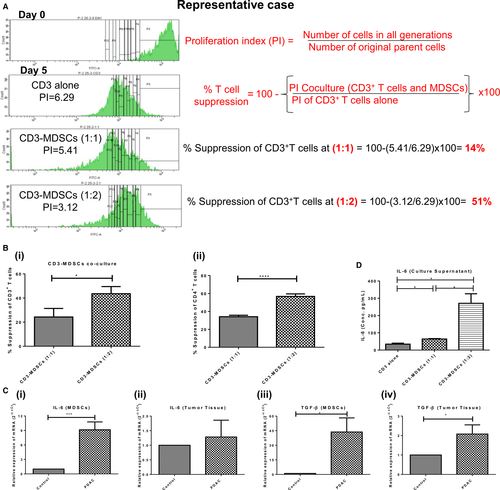
For investigating the immunosuppressive function of MDSCs, a co-culture assay of CD3+ T cells with Total circulating MDSCs was performed. For this purpose, CD3+ T cells were sorted through BD FACS ARIA (BD Biosciences). 5 × 10⁴ CD3+ T cells /well were seeded in a 96-well culture plate and were stained with 5 μM CFSE fluorescent cell staining dye (C34554, CellTraceTM CFSE cell proliferation kit; Invitrogen) and incubated at 37°C for 20 minutes. The unbound CFSE was quenched by adding 10% RPMI media supplemented with FBS (10438-026; Gibco), and subsequently, cells were washed with sterile D-PBS. 1.5 x10⁵ autologous MDSCs were isolated from PBMCs by sorting and co-cultured with purified T cells in three different ratios (CD3 only, 1:1, 2:1). Co-cultured cells were stimulated with 30 IU/mL human recombinant IL-2 (11011456001; Sigma) and 5 μg/mL Phytohemagglutinin-L (PHA-L), (11249738001, Sigma) for inducing T-cell proliferation. T-cell proliferation was determined after five days using BD FACS Canto II flow cytometer and analysed by the BD FACS Diva software v.6.1.3 (BD Biosciences). The proliferation index and % suppression of total CD3+ and CD4+ T cells were determined as previously described by McMurchy and Levings.29
2.8.1 Determination of gene expression of IL-6 and TGF-β in sorted MDSCs by qRT-PCR
The mRNA expression of various tumour inflammatory mediators such as IL-6 and TGF-β in sorted MDSCs of PDAC patients (through BD FACS ARIA) and tumour tissue of PDAC patients was determined by qRT-PCR. Briefly, total RNA was isolated from MDSCs and tumour tissue using TRIzol (15596026; Ambion by Life Technologies) according to the manufacturer's instructions. The yield and purity of RNA were assessed by measuring absorbance at A260/280 through Epoch™ 2 Microplate Spectrophotometer (Bio Tek). Total RNA was converted into cDNA using iScriptTM cDNA synthesis kit (1708891; BIO-RAD) as per the manufacturer's instructions. The sequence of primers (designed using Primer3 software) for IL-6, TGF-β and 18S are IL-6 (forward: 5′-CGTCATTTAACCCCAGCACT-3′, reverse: 5′-GGTAGGCAGTGGGACCTACA-3′), TGF-β (forward: 5′-TATCGACATGGAGCTGGTGA-3′, reverse: 5′-CCTCCTTGGCGTAGTAGTCG-3′) and 18S (forward: 5′-GTAACCCGTTGAACCCCATT-3′, reverse: 5′-CCATCCAATCGGTAGTAGCG-3′). Relative expression of IL-6 & TGF-β wrt control was determined by qRT-PCR using DyNAmo Flash SYBR Green qPCR kit (F-416L, Thermo Fisher Scientific). Ct values obtained from each test and control sample were used to determine relative expression (2−ΔΔCt) of each gene after normalization with housekeeping gene of test & control samples.
2.8.2 Evaluation of IL-6 levels in CD3-MDSCs co-culture supernatant by ELISA
For investigating the involvement of IL-6 in MDSCs activation, the concentration of IL-6 cytokine in the culture supernatant of CD3-MDSCs co-culture for CD3 alone and CD3-MDSCs (1:1, 1:2) was determined by using Human IL-6 ELISA Kit (88-7066-22; Invitrogen by Thermo Fisher Scientific, USA) according to the manufacturer's directions. The absorbance of all samples and standards in the 96-well plate was studied on 450 nm and 570 nm wavelength using Epoch2 spectrophotometer (BioTek, USA). The samples were run in duplicates, and the IL-6 concentration was interpolated from the standard curve (Figure S5). The final results were expressed as pg/mL.
2.9 Statistical analysis
The frequencies of various subsets of MDSCs in all the study groups were compared and correlated with the presence of inflammatory cytokines. Statistical evaluation was performed using GraphPad Prism 6.0 software (GraphPad Software Inc). All the data were checked for normal distribution using recommended test D'Agostino-Pearson omnibus normality test and the Shapiro-Wilk test. The difference between the two study groups was determined using a two-tailed unpaired student's t test (Mann-Whitney test) and in multiple groups by one-way ANOVA (Kruskal-Wallis test). The data were represented as Median ±Interquartile Range for non-parametric tests and Mean±SEM for parametric tests. The non-parametric Spearman test determined any correlation between clinicopathological features of patients and MDSCs frequencies. P-value≤0.05 was considered statistically significant.
3 RESULTS
3.1 Increased frequency of MDSCs in PDAC patients
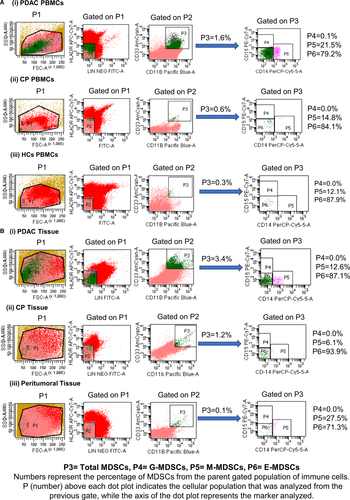
The relative frequency of various subtypes of MDSCs varies depending upon the type of cancer, inflammatory status and severity. Lack of definite markers for their identification accounts for heterogeneity in MDSCs classification. We characterized MDSCs as per widely recommended criteria: total MDSCs [Lin− (CD3/19/56) HLA-DRlow/− CD11b+ CD33+], Monocytic MDSCs [Lin− (CD3/19/56) HLA-DRlow/− CD11b+ CD33+ CD14+ CD15−], Granulocytic MDSCs [Lin− (CD3/19/56) HLA-DRlow/− CD11b+ CD33+ CD15+ CD14−] and early MDSCs [Lin− (CD3/19/56) HLA-DRlow/− CD11b+ CD33+ CD14− CD15−].10 Representative flow cytometry dot plots of HCs, CP and PDAC patients are shown in Figure 2A,B in which numbers represents the percentage (relative frequency) of MDSCs from originally gated population of total immune cells (100%).
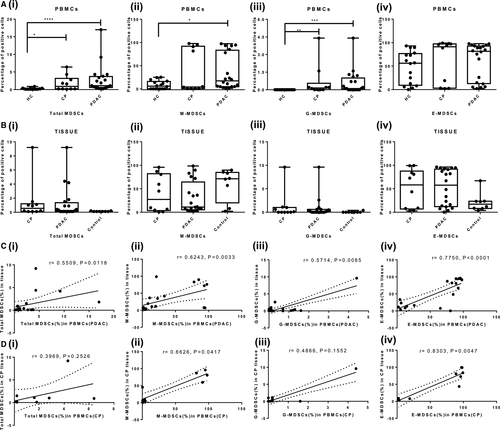
The frequency of circulating total MDSCs was significantly higher in PDAC and CP patients compared with HCs [PDAC vs HCs, (P < .0001) and CP vs HCs, (P = .0327)], while there was no statistically significant difference between PDAC and CP (P = .7831) [Figure 3A(i)]. Irrespective of the study groups, early MDSCs were the predominant subtype, followed by M-MDSCs and G-MDSCs. Both M-MDSCs and G-MDSCs were significantly higher in PDAC than HCs (M-MDSCs, P = .0359; G-MDSCs, P = .0004) [Figure 3A(ii, iii)]. In CP, only G-MDSCs were higher than HCs (P = .068) [Figure 3A(iii)]. Though E-MDSCs were the predominant subset, their frequencies did not show significant differences among PDAC, CP patients and HCs [PDAC vs HCs, (P = .6499); CP vs HCs, (P = .48); and PDAC vs CP, (P >.99)] [Figure 3A(iv)]. Overall, all the subsets of MDSCs were only slightly higher in PDAC than CP (Table 1). Analysis of tissue derived from PDAC, CP and peritumoural region showed no significant difference in the relative frequency of any of the MDSCs subsets (Table 2) [Figure 3B(i-iv)].
| MDSCs subset | PDACa | CPa | HCa |
P-value A = (PDAC vs HC); B = (CP vs HC); C = (PDAC vs CP) |
| Total MDSCs | 1.1 (0.6-3.7) | 0.9 (0.2-3.17) | 0.1 (0.1-0.35) | A < 0.0001, B = 0.032, C = 0.7831 |
| M-MDSCs | 17.25 (4.65-83.25) | 4.05 (0.5-91.93) | 5.75 (0-15.98) | A = 0.0359, B = 0.6139, C > 0.999 |
| G-MDSCs | 0.1 (0-1.0) | 0.15 (0.0-0.55) | 0.1 (0.0-0.1) | A = 0.0004, B = 0.068, C > 0.999 |
| E-MDSCs | 81.50 (12.75-92.70) | 91.15 (3.02-97.25) | 56.15 (9.2-76.68) | A = 0.6499, B = 0.4866, C > 0.999 |
Note
- Abbreviations: CP, chronic pancreatitis; HC, healthy controls; PDAC, pancreatic ductal adenocarcinoma.
- a Data values are in the form of median and IQR; bold P-values are significant.
| MDSCs SUBSET | PDACa | CPa | Peritumoural tissuea |
P-value A = (PDAC vs Peritumoural tissue); B = (CP vs Peritumoural tissue); C = (PDAC vs CP) |
| Total MDSCs | 0.25 (0.1-1.35) | 0.55 (0.10-1.2) | 0.1 (0.1-0.17) | A = 0.18, B = 0.100, C > 0.99 |
| M-MDSCs | 11.10 (5.125-64.48) | 27.25 (3.6-82.08) | 71.35 (20.10-84.80) | A = 0.5232, B = 0.8478, C > 0.99 |
| G-MDSCs | 0.1 (0-0.6) | 0.05 (0.0-1.02) | 0.1 (0.1-0.2) | A = 0.2055, B = 0.2355, C > 0.99 |
| E-MDSCs | 57.70 (12.03-91.75) | 58.15 (6.97-87.68) | 17.20 (8.07-23.43) | A = 0.28, B = 0.64, C = 0.99 |
Note
- Abbreviations: CP, chronic pancreatitis; PDAC, pancreatic ductal adenocarcinoma.
- a Data values are in the form of median and IQR.
The frequency of circulating MDSCs showed statistically significant positive correlation with MDSCs infiltrating diseases tissue in both PDAC and CP patients. The correlation between MDSCs of circulation and tumour tissue was significant for total MDSCs (r = .5509, P = .0118); M-MDSCs (r = .6243, P = .003); G-MDSCs (r = .5714, P = .008); and E-MDSCs (r = .7750, P < .0001) of PDAC patients [Figure 3C(i-iv)]. In chronic pancreatitis, frequency of M-MDSCs (r = .6626, P = .0417) and E-MDSCs (r = .8303, P = .0047) showed significant positive correlation while correlation for total MDSCs (r = .3969, P = .2526) and G-MDSCs (r = .4866, P = .1552) was positive but statistically insignificant [Figure 3D(i-iv)].
3.2 Increased ARG-1 expression on MDSCs of PDAC patients
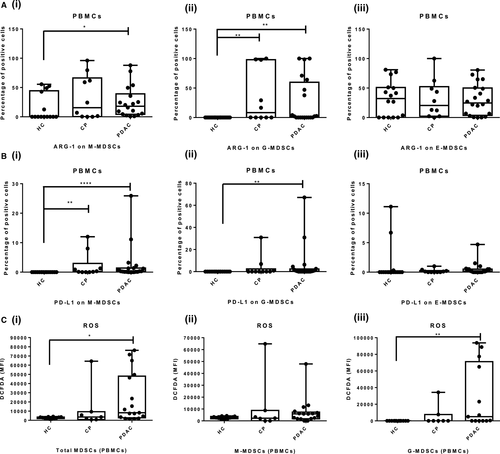
The elevated ARG-1 expression was found in both M-MDSCs and G-MDSCs of PDAC and CP patients, which indicates their immunosuppressive nature. ARG-1 expressing M-MDSCs in PBMCs of PDAC patients [13.10%, (2.52%-33.06%)] were significantly higher compared with HCs [0.1% (0%-51.73%), P = .0441]. ARG-1 expressing M-MDSCs in CP patients [15.60% (0.32%-66.25%)] did not differ significantly from HCs (P = .295). The difference between ARG-1 expressing M-MDSCs of PDAC and CP patients was also statistically insignificant (P >.99) [Figure 4A(i)]. Relative percentage of ARG-1 producing G-MDSCs was significantly higher in PDAC and CP patients, that is 2.05% (0%-59%) and 8.35% (0%-98%) compared with HCs (0.1%) (PDAC vs HCs; P = .0013, CP vs HCs; P = .0045) [Figure 4A(ii)]. There was no significant difference in ARG-1 producing E-MDSCs among PDAC, CP patients and HCs (P >.999) [Figure 4A(iii)]. Additionally, no significant difference was observed in ARG-1 expressing MDSCs subsets of tumoural and peritumoural tissue of PDAC patients and CP tissue (Figure S3A). A detailed description of ARG-1 expressing MDSCs in PBMCs and tissue of PDAC and CP patients and HCs have been given in Tables S2 and S3.
3.3 Increased PD-L1 expression on MDSCs of PDAC patients
The PD-L1 expressing M-MDSCs were significantly raised in PBMCs of PDAC and CP patients, that is 0.30% (0.1%-1.37%) and 0.20% (0.0%-2.95%) respectively compared with 0.0% (0%-0.4%) in HCs [PDAC vs HCs (P < .0001); CP vs HCs, (P = .0037); PDAC vs CP, P >.99) [Figure 4B(i)]. Furthermore, we have found that PD-L1 expressing G-MDSCs was significantly raised in PDAC patients [0.35% (0%-2.37%)] compared with HCs [0.1% (0.0%-0.2%) (P = .0022), while difference with CP patients was not significant [0.10% (0%-2.4%), (P = .734)] [Figure 4B(ii)]. There was no significant difference in PD-L1 producing E-MDSCs among PDAC, CP patients and HCs (P = .0692) [Figure 4B(iii)]. Similar to circulation, tissue infiltrating PD-L1+ M-MDSCs and G-MDSCs did not differ significantly among CP and PDAC patients (M-MDSCs, P = .22 and G-MDSCs; P = .57 respectively). Also, there was no significant difference between PD-L1 expressing E-MDSCs in pancreatic tissue of PDAC and CP patients (P = .471) (Figure S3B). These results indicate that monocytic and granulocytic subsets of circulating MDSCs possess significant immunosuppressive potential. A detailed description of PD-L1 expressing MDSCs in PBMCs and tissue of PDAC and CP patients and HCs have been given in Tables S4 and S5.
3.4 ROS generation by MDSCs
We found that ROS generation in circulating total MDSCs of PDAC patients was significantly higher than that of HCs (PDAC MFI = 8216 vs HCs MFI = 2736, P = .0264), while ROS generation among CP and HCs was not statistically significant (CP MFI = 3559 vs HCs MFI = 2736, P >.99). The level of ROS in circulating total MDSCs of PDAC and CP patients was also not statistically significant (P = .3519) [Figure 4C(i)]. Similarly, subset M-MDSCs of PDAC and CP patients did not show a significant difference in ROS levels than controls [Figure 4C(ii)]. The ROS production by circulating G-MDSCs of PDAC patients was significantly higher than HCs (P = .0039), while insignificant with CP patients (P = .3855). The difference in ROS production by circulating G-MDSCs of CP patients and HCs was negligible (P = .6815) [Figure 4C(iii)]. The ROS production by MDSCs displays their potential to suppress normal immune functions.
Similarly, ROS production by tissue infiltrating MDSCs of PDAC did not differ significantly from CP and peritumoural control tissue (Figure S3C). A detailed description of ROS production by circulating and tissue infiltrating MDSCs of PDAC and CP patients and HCs has been given in Table S6.
3.5 Inflammatory cytokines are associated with MDSCs accumulation
The levels of cytokines in the cell suspension supernatant and serum samples were measured in all the study groups using a cytokine bead array. The levels of cytokines IL-6, IL-8, IL-10 and IL-1β, which are critical for immunosuppressive functions of MDSCs, were significantly higher in the serum of PDAC patients compared with the healthy controls [IL-6, (P < .0001); IL-8, (P < .0001); IL-10, (P < .0001); and IL-1β, (P = .018)] (Figure 5A). Whereas in CP, the systemic level of only IL-6 cytokine was significantly raised compared with HCs (P = .043) [Figure 5A(iv)]. Comparison between PDAC and CP showed that levels of IL-8 were significantly higher (P = .0028) in the former [Figure 5A(vi)]. The rest of the cytokines studied were marginally higher in PDAC patients than the CP patients (Table S7). Similarly, these cytokines (IL-6, IL-8, IL-10 and IL-1β) were marginally raised in the local tissue environment, and the difference compared with CP was not statistically significant (Figure S4, Table S8).

The level of IL-6 cytokine was found to be significantly and positively correlated with the frequency of total MDSCs (r = .5730, P = .0278), M-MDSCs (r = .7158, P = .0004) and G-MDSCs (r = .5293, P = .0164) in PDAC patients [Figure 5B(i-iii)]. The local and systemic inflammatory environment of PDAC forms the basis of MDSCs expansion, and IL-6 plays a crucial role in MDSCs accumulation.
3.6 MDSCs suppress anti-tumour immunity by inhibiting CD3+ and CD4+ T cells proliferation
Co-culture assay reveals that with the increase in the frequency of MDSCs, the proliferation index of total CD3+ and CD4+ T cells decreases. The per cent suppression of T cells in the presence of MDSCs was calculated from the proliferation index of total CD3+ and CD4+ T cells in co-culture (Figure 6A). It was found that in a co-culture of CD3+ T cells and MDSCs at 1:2 and 1:1 ratio, per cent suppression of total CD3+ T cells was 43.57 ± 5.97% and 24.27 ± 7.1% respectively (P = .0162), while per cent suppression of CD4+ T cells was 56.75 ± 1.15% and 34.13 ± 0.67% (P < .0001). These results indicate that increased accumulation of MDSCs significantly suppresses anti-tumour immunity by inhibiting the proliferation of total CD3+ and CD4+ T lymphocytes. This confirms the immunosuppressive nature of MDSCs [Figure 6B(i, ii)].
3.6.1 Sorted MDSCs of PDAC patients exhibit upregulated mRNA expression of inflammatory markers IL-6 and TGF-β
As the IL-6 was significantly upregulated in the serum of PDAC patients and correlated with the expansion of MDSCs, we looked for the expression of IL-6 at mRNA level in cancer tissue and sorted MDSCs of PDAC patients. The relative mRNA expression of the IL-6 cytokine was significantly higher in sorted MDSCs (9.14 ± 1.63, P = .0002) of PDAC patients [Figure 6C(i)]. Relative expression of TGF-β was significantly upregulated in both sorted MDSCs (43.66 ± 14.52, P = .0108) and tumour tissue (2.07 ± 0.47, P = .0324) of PDAC patients [Figure 6C(iii, iv)]. These results point towards the possible involvement of the IL-6 mediated inflammatory axis in MDSCs activation.
3.6.2 IL-6 cytokine is associated with the expansion of MDSCs
Since IL-6 was significantly raised in PDAC patients and was positively correlated with the percentage of total MDSCs, to further confirm its association with MDSCs expansion, IL-6 level was measured in the supernatant of MDSCs-CD3+ T-cell co-culture. The IL-6 level markedly increased with the increase in MDSCs in co-culture experiment, that is 34.41 ± 5.70 pg/mL in CD3 alone to 64.03 ± 2.38 pg/mL in CD3-MDSCs co-culture at ratio 1:1 (P = .01) and 270.7 ± 55.4 pg/mL at ratio 1:2 (P = .02) (Figure 6D).
As earlier, we found that per cent suppression of T cells was higher at 1:2 ratio of CD3-MDSCs co-culture; this experiment, in continuation with other findings, suggests that IL-6 plays a crucial role in the expansion and functional activation of immunosuppressive MDSCs in PC patients.
3.7 Correlation of circulating MDSCs frequencies with clinicopathological features
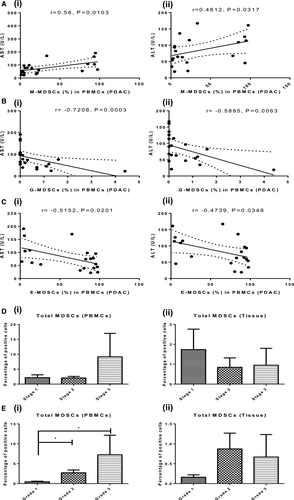
A non-parametric Spearman test was performed to determine the correlation of frequencies of MDSCs with clinicopathological features of PDAC and CP patients (Table S1). In CP and PDAC patients, we observed abnormal levels of pancreatic markers and liver function test (LFT) markers; however, only aspartate aminotransferase (AST) and alanine aminotransferase (ALT) levels were significantly correlated with circulating MDSCs of PDAC patients. The frequency of M-MDSCs, the predominant immunosuppressive MDSCs, showed a significant positive correlation with the levels of liver enzymes AST (r = .56, P = .0103) and ALT (r = .48, P = .0317) [Figure 7A(i, ii)]. G-MDSCs showed negative correlation with AST (r = −.7208, P = .0003) and ALT levels (r = −.5885, P = .0063) [Figure 7B(i, ii). Circulating E-MDSCs shows significant negative correlation with AST (r = −.5152, P = .0201) and ALT levels (r = −.4739, P = .0348) [Figure 7C(i, ii)]. This indicates that inflammation or necrosis in the hepatobiliary region can influence MDSCs accumulation in pancreatic carcinoma. We did not see a significant correlation of frequency of MDSCs with tumour stage [Figure 7D(i, ii)], cancer markers such as CA19-9, and other clinical features of patients mentioned in Table S1. However, interestingly, circulating MDSCs were found to increase significantly, with increasing histopathological grades of the tumour (Grade 1 vs Grade 2, P = .0289; Grade 1 vs Grade 3, P = .0242), which suggests their possible role as a potential biomarker [Figure 7E(i)].
4 DISCUSSION
Since the last decade, MDSCs have gained considerable attention from scientists due to their role in cancer and inflammatory conditions and emerged as potential mediators of resistance to cancer immunotherapy. In most of the studies reported so far, there is variability in the characterization of MDSCs in different tumour settings, and all the subsets of MDSCs have not been analysed.10, 19 G-MDSCs were the major MDSCs subset, found elevated in renal cell cancer30 and oral squamous cell carcinoma,22 whereas M-MDSCs were primarily upregulated in hepatocellular carcinoma,31 melanoma32 and prostate cancer.33 Differences in the degree of inflammation, severity, stage and disease grade may account for the variability in the predominance of one particular subtype of MDSCs in different studies.19 Another reason could be the lack of specific markers to human MDSCs, variability in the protocols and gating strategies applied for the characterization of MDSCs.19, 34 Furthermore, in most studies, data are derived from the analysis of MDSCs in only blood samples.35 We studied all the subsets of MDSCs in both blood and pancreatic tissue samples and found a significant elevation in relative frequencies of total MDSCs, M-MDSCs and G-MDSCs in peripheral blood of PDAC patients compared with healthy controls.
Like our study, Khalid et al18 studied both G-MDSCs and M-MDSCs in circulation and tumour tissue of PDAC and CP patients. Unlike our results, they found a significant increase in only G-MDSCs of peripheral blood and tumour tissue, and infiltration of these cells in the cancer tissue was higher than in the blood. In our study, though the frequency of MDSCs in tissue was lower than in circulation, interestingly, we noticed a significant positive correlation of MDSCs in circulation with those in the tumour tissue. As most of the cases (17/20) we studied had well to the moderately differentiated PC, it might be possible that infiltration of MDSCs in tumour tissue increases with the advancement of the tumour grade. Our data showed a significant increase in MDSCs in the blood with increasing tumour grade (grade 1 vs grades 2 and 3). However, the increment in the percentage of MDSCs infiltrating tumour tissue with increasing grade was not significant. This might be due to inherent heterogeneity in tumours, and small tissue samples are unlikely to represent the entire tumour.30 Previously, a positive correlation of peripheral blood G-MDSCs with increasing tumour grade was observed by Najjar et al30 in renal cell cancer and Zhong et al22 in oral squamous cell carcinoma. Arihara and colleagues reported similar observations for M-MDSCs in hepatocellular carcinoma31 and Xiao-Dong Xu and colleagues 2016 in PDAC.17 Gabitass et al35 identified MDSCs as an independent prognostic marker in PC, gastric cancer and oesophageal cancers as increased MDSCs percentage was associated with a higher risk of death.
In our study, E-MDSCs were the most abundant subset in circulation and local pancreatic tissue of all study groups; however, their frequency did not vary significantly. So far, E-MDSCs have not been paid much attention and analysed in a handful of studies. Similar to our observations, Ma et al36 did not find any difference in the frequencies of E-MDSCs in the blood of healthy controls, colon adenoma and colon cancer patients. These observations suggest that probably the disease state does not influence E-MDSCs, and these cells might be in the transition state of differentiation into monocytic and granulocytic subsets of MDSCs.10
In chronic pancreatitis, the frequency of circulating MDSC was significantly higher than in the healthy controls. This observation was in concordance with Meyer et al37, who found that chronic inflammation promotes MDSCs accumulation. MDSCs infiltrating the chronic pancreatitis tissue did not show a significant difference from the cancer tissue. This could be because 90% (18/20) of cancer tissues were in histopathological stage 2 or lower. In CP, like PDAC, M-MDSCs outnumbered G-MDSCs; thus, the trend observed was similar in both groups. Like our study, Ma et al36 compared MDSCs in benign and malignant conditions. They did not find any significant difference in frequency of circulating MDSCs in benign intraductal papillary mucinous neoplasm (IPMN) and colon adenoma compared with PC and colon cancer patients, respectively. These observations indicate that the relative frequency of MDSCs increases steadily with the advancement of the cancer stage. In our scenario, procurement of non-diseased control pancreatic tissue samples was not feasible. In many studies, peritumoural tissue has been used as a control, and on the same ground, we collected tissue 2 cm away from the tumour margin as a control.38 The frequency of MDSCs in this part of tissue did not differ significantly from PDAC tumour tissue and CP tissue; thus, peritumoural tissue might not be ideal control due to possible infiltration of tumour-associated inflammatory cells. Similar observations were pointed out in some previous studies where the authors emphasized that normal-appearing tissue harvested from surgery of existing inflammatory or malignant conditions does not represent control tissue in the true sense.28, 39
MDSCs impair the functionality of immune cells and anti-tumour immune response via diverse mechanisms.14 In this regard, the binding of PD-1 receptors of T cells to PD-L1 of MDSCs increases the threshold for T-cell activation, thereby impairs the establishment of robust immunological response against tumour cells.25, 40 In our study, PD-L1 expression on both G-MDSCs and M-MDSCs was significantly higher in PDAC patients than in healthy controls. Another mechanism of immunosuppression is the secretion of arginase (ARG-1), which depletes L-arginine, a critical amino acid required for T-cell proliferation.24, 41 We observed higher intracellular ARG-1 expression in both circulating M-MDSCs and G-MDSCs of PDAC patients. MDSCs also showed higher ROS production, which further adds to their immunosuppressive potential. Additionally, we observed higher per cent suppression of proliferation of CD3+ and CD4+T lymphocytes with an increase in MDSCs in the CD3-MDSCs co-culture experiment, which confirm the immunosuppressive potential of MDSCs in PC. Trovato et al15 found that the gene cluster of ARG-1 is present on M-MDSCs, which via signal transducer and activator of transcription 3 (STAT-3) activation inhibit T-cell proliferation, although the suppressive ability of G-MDSCs and M-MDSCs might not be the same.20, 42
It is well established that chronic inflammation is a hallmark of PC. The role of cytokines GM-CSF, IFN-γ IL-1β, IL-8 and IL-6 in MDSCs expansion by triggering STAT3 pathway has been suggested by various previous studies.28, 43, 44 In our study, levels of cytokines IL-6, IL-8, IL-10 and IL-1β were significantly higher in the serum of PDAC patients in comparison with healthy controls. The serum cytokine load in our study groups was in the order of HC<CP<PDAC, and the same trend was observed for the frequency of MDSCs in all the groups. Interestingly, we observed a significant positive correlation between serum levels of IL-6 and circulating total MDSCs, M-MDSCs and G-MDSCs of PDAC patients. Earlier, Tobin et al44 found that only M-MDSCs had a significant positive correlation with IL-6 levels in melanoma patients. Similar to our results, Oh et al45 found that IL-6 signalling in breast cancer cells promotes metastasis by activating MDSCs. These observations suggest that IL-6 could be the critical cytokine associated with the differentiation of myeloid precursors into MDSCs and can promote their expansion. On the contrary, Najjar et al30 emphasized the role of IL-8, IL-1β and CXCL5 in the accumulation of MDSCs in renal cancer. Various evidences suggest that classical signalling of IL-6 (activation of gp130 via the membrane-bound IL-6R) activates anti-tumour functions primarily through T helper cells, neutrophils, macrophages and by promoting differentiation of Th17 cells. While Trans-signalling of IL-6 (activation of gp130 via the IL-6/ soluble IL-6R) has a pro-inflammatory role, which leads to modulation of anti-tumour immunity.46 Both classical and trans-signalling converge on common pathways involving intracellular signalling mediator STAT3, which regulates IL-6-dependent inflammatory responses, cancer cell proliferation and metastatic dissemination.47 Th17 has been reported to exhibit a dual role in tumour growth.48-50 In this context, He et al51 observed that the accumulation of Th17 cells in pancreatic tumour is associated with increased angiogenesis and poor survival of patients. Salazar et al52 found that when primary human lung cancer cells were exposed to IL-17, the gene signature of epithelial-mesenchymal transition and cancer cell migration was induced. Gnerlich et al53 differed in their view and found that differentiation of CD4+ T helper cells into Th17 cells inhibits tumour growth and promotes survival in a mouse PC model. In normal circumstances, the anti-tumour function of Th17 is orchestrated by regulatory T cells and antigen-presenting cells, which are disrupted during the diversion of normal myelopoiesis to form MDSCs.54, 55
IL-6 has multidimensional roles and contributes directly and indirectly to the progression of the tumour. It contributes to invasiveness and metastasis of cancer by augmenting the expression of matrix metalloproteinases and vascular endothelial growth factors in tumours.47 Besides acting directly on the tumour cells, IL-6 in association with MDSCs weakens the immune response by inhibiting the maturation of dendritic cells and promotes the activation of immunosuppressive M2 macrophages, which halts the priming of tumour-specific T cells. Furthermore, IL-6 inhibits the Th1 differentiation of CD4+ T helper cells, which reduces their ability to activate DCs and CD8+T lymphocytes.54 It also directs the MDSCs to produce immunosuppressive molecule arginase and facilitate tumour progression. We observed that expansion of MDSCs in CD3-MDSCs co-culture markedly suppresses T-cell proliferation, which was associated with an increased level of IL-6 in the culture medium, indicating that the IL-6 cytokine is activating the suppressive nature of MDSCs for inhibiting the proliferation of total CD3+ and CD4+ T cells.
According to a recent review, IL-12 family cytokines (IL-12, IL-27, IL-27, and IL-35) have emerged as another critical cytokine having tumour-promoting potential.56 Wang et al57 found that tumour-derived IL-35 stimulates the accumulation of MDSCs and promotes tumour growth by angiogenesis. Mirlekar et al58, 59 showed that IL-35 causes exhaustion of CD8+ T cytotoxic cells in STAT3 dependent manner, and targeting IL-35 aids in increasing response to anti-PD-1 immunotherapy in PC. This strengthens the hypothesis that dysregulated chronic inflammation plays a vital role in tumour initiation and progression. CP is considered as a premalignant condition; however, the mechanism of malignant transformation is still unclear. According to our results, the frequency of MDSCs and expression of immunosuppressive markers in CP patients were intermediate between healthy controls and PDAC. In CP, M-MDSCs significantly expressed only PD-L1, while G-MDSCs significantly expressed ARG-1. These observations suggest that MDSCs in CP are less immunosuppressive than in PDAC; however, they generate a favourable niche that can support tumour growth. One of the limitations of our study was an inability to get normal pancreatic tissue due to technical and ethical issues. Furthermore, we could not investigate the change in relative frequencies of circulating MDSCs after surgery or chemotherapy and their interaction with various signalling networks governing immunosuppression which could enhance the overall outcomes of this study.
In conclusion, IL-6 cytokine plays a crucial role in mediating the expansion of MDSCs and activating their immunosuppressive nature in PDAC patients. The expansion of MDSCs was profoundly associated with immunosuppression in PDAC than CP. All the subsets of MDSCs were associated with immunosuppression in PC patients; still, M-MDSCs and G-MDSCs predominantly show immunosuppression via increased expression of ARG-1, PD-L1 and ROS activity. The frequency of MDSCs in circulation might act as a potential biomarker to predict the underlying pathological status of PC. These findings regarding MDSCs in PC can be helpful while developing novel target-based anti-cancer strategies.
ACKNOWLEDGMENT
We are thankful to our patients and families. The author Vinit Sharma would also like to acknowledge Indian Council of Medical Research (ICMR, New Delhi, India) for providing a research fellowship (3/1/3-JRF-2016/HRD).
CONFLICT OF INTEREST
The authors declare no conflicts of interest.
AUTHOR CONTRIBUTIONS
VS and AA involved in concept of the study. VS, AA, VG, NS, RN, JJ and DS involved in sample collection, data acquisition and interpretation. VS, NS and AA involved in correction of manuscript and approval of final version.
Open Research
DATA AVAILABILITY STATEMENT
The data that support the findings of this study are available from the corresponding author upon reasonable request.


