Enhancing safety feedback to the design of small, unmanned aircraft by joint assessment of impact area and human fatality
Abstract
Advantages of commercial UAS-based services come with the disadvantage of posing third party risk (TPR) to overflown population on the ground. Especially challenging is that the imposed level of ground TPR tends to increase linearly with the density of potential customers of UAS services. This challenge asks for the development of complementary directions in reducing ground TPR. The first direction is to reduce the rate of a UAS crash to the ground. The second direction is to reduce overflying in more densely populated areas by developing risk-aware UAS path planning strategies. The third direction is to develop UAS designs that reduce the product in case of a crashing UAS, where is the size of the crash impact area on the ground, and is the probability of fatality for a person in the crash impact area. Because small UAS accident and incident data are scarce, each of these three developments is in need of predictive models regarding their contribution to ground TPR. Such models have been well developed for UAS crash event rate and risk-aware UAS path planning. The objective of this article is to develop an improved model and assessment method for the product In literature, the model development and assessment of the latter two terms is accomplished along separate routes. The objective of this article is to develop an integrated approach. The first step is the development of an integrated model for the product . The second step is to show that this integrated model can be assessed by conducting dynamical simulations of Finite Element (FE) or Multi-Body System (MBS) models of collision between a UAS and a human body. Application of this novel method is illustrated and compared to existing methods for a DJI Phantom III UAS crashing to the ground.
1 INTRODUCTION
Unmanned Aircraft System (UAS) technology has the potential to replace manned aircraft and aerial platforms. This potential is of particular interest for commercial UAS-based taxi services, parcel delivery services, medical aid services, etc. The advantages of commercial UAS-based services also come with third party risk (TPR) for overflown population on the ground. Especially challenging is that the imposed level of ground TPR typically increases linearly with the density of potential customers of UAS services. As shown through initial studies (Clothier et al., 2018; EASA, 2021), awareness of the potential negative effects of overflying commercial UAS services is slowly increasing among human society. Because regulation poses significant limitations on the operation of commercial UAS services in rural areas, human society is hardly exposed to ground TPR. The limited exposure also slows down the traditional approach of safety learning from incidents and accidents. The alternative in providing effective safety feedback to the design and flight operations of UAS, is to make use of model-based safety risk assessment methodology.
Regulation typically poses an upper bound on the expected number of ground fatalities per UAS flight hour (EASA, 2021; EC, 2021; FAA, 2016; ICAO, 2011; JARUS, 2017), and supports the use of model (1.1) to demonstrate compliance to this upper bound. As is well explained in JARUS (2022, 2023), regulation supports baseline use of conservative models for each of the terms in (1.1), while at the same time offers an open door for the potential use of improved ground TPR assessment models and methods.
Equation (1.1) shows that during the design of a commercial UAS service there are three complementary directions in reducing . The first direction is to reduce by: i) Improving the reliability of the UAS design (Petrioli et al., 2018); ii) Identification and mitigation of various other hazards that may lead to a ground crash (Clothier et al., 2018; Plioutsias et al., 2018); and iii) Improving the interaction with other UAS or other low flying object (la Cour-Harbo and Schioler, 2019; Kallinen and McFadyen, 2022; Kim, 2019). The second direction is to reduce the effect of by applying risk-aware UAS path planning and emergence landing strategies (Ancel et al., 2019; He et al., 2022; Hu et al., 2020; Ippolito, 2019; Oh et al., 2020; Primatesta et al., 2020). The third direction is to reduce the effect of by improving physical UAS design in shape and material. The objective of this article is to develop an enhancement in the modelling and assessment of the latter product.
The ground TPR model for commercial aviation also involves the product (Ale & Piers, 2000). In contrast to UAS operations, in conventional aviation sufficient accident data are available to quantify both terms. Hence, for ground TPR of UAS, non-statistical parametric models have been developed in literature. Overviews by Melnyk et al. (2014) and Washington et al. (2017) have shown that there is a significant diversity in the parametric models for and for Washington et al. (2017) argue that the current level of diversity leads to an undesired variability in the risk assessment outputs. An extra limitation of these existing models is that they do not take into account that the fatality for a person in the impact area may vary depending on the offset between the crash center and the location of a human in the impact area.
To improve this situation, a recent development is to replace parametric models for by a dynamical simulation of a finite-element (FE) or a multi-body-system (MBS) model of UAS collision with a human body (Arterburn et al, 2019; Koh et al., 2018; Rattanagraikanakorn et al., 2019, 2020a,b, 2022; Weng et al., 2021). The basis for this dynamical simulation approach stems from car crash research in automotive industry (MADYMO, 2017a,b; THUMS, 2015, 2018). For UAS impact on human body, validation of this dynamical simulation approach is accomplished by showing that detailed simulated results correspond with dynamical impact measurements under laboratory controlled UAS collisions with human dummies (Arterburn et al., 2017, 2019; Campolettano et al., 2017; Koh et al., 2018) and with human cadavers (Stark et al., 2019).
The dynamical simulation based assessments by Arterburn et al. (2019), Koh et al. (2018), Rattanagraikanakorn et al. (2019, 2020a,b, 2022), and Weng et al. (2021) cover cases where the crash center of the UAS coincides with the center of the human head. The straightforward multiplication of this value by an value, implicitly adopts the assumption that a centered value also applies when the crash center of a UAS has an offset with the center of the human head. The objective of this article is to enrich both the ground TPR model (1.1) and the dynamical simulation model with such an offset parameter. The effectiveness of this novel ground TPR assessment approach is demonstrated for a small UAS impacting a human body.
The article is organized as follows. Section 2 provides a literature overview of models for and for , including an illustration of the large variety in resulting values for a UAS of 1.21 kg crashing to the ground. Section 3 develops the enrichment of Equation (1.1), and subsequently shows how this enriched model can be numerically evaluated by using dynamical simulations of a UAS collision with a human body. Section 4 evaluates the enriched model through the evaluation of a validated dynamical simulation model of the 1.21 kg UAS, and compares the obtained results with existing models of section 2. Section 5 draws conclusions.
2 EXISTING MODELS FOR AND
Subsections 2.1 and 2.2 outline parametric models for and respectively. Subsection 2.3 outlines dynamical simulation model for . In subsection 2.4, these models are used to quantify and compare the product for the scenario of a vertical drop of a DJI Phantom III on the head of a standing human.
2.1 Parametric models for Aimpact
From overviews (JARIUS, 2022; Melnyk et al., 2014; Washington et al., 2017), there are three main types of parametric models for impact area : Gliding area model, Planform area model, and Aircraft mass based model.
(JARUS, 2022) adopts for the Gliding area Equation (2.1) of RTI, though assumes that satisfies the NAWCAD model.
The aircraft mass based model satisfies (Ale and Piers, 2000): , with the maximum take-off weight in kg, and the statistically fitted coefficient value
2.2 Parametric models for
There are various injuries models for human under impact. These models consider different injuries sources, such as from blunt force (Raymond et al., 2009; Sturdivan et al., 2004), from debris (Feinstein et al., 1968; Montgomery & Ward, 1995), and from explosion (Hardwick et al., 2009). The models also differentiate depending on the human body parts that are exposed, such as head (Hutchinson et al., 1998; Schmitt et al., 2019), neck (Klinich et al., 1996; Parr et al., 2012), thorax and abdomen (Lau & Viano, 1986; Viano et al., 1989).
- RCC model
- BC model
| Parameter | Head | Thorax | Abdomen |
|---|---|---|---|
| a (Joules) | 74.8 | 59.8 | 130.6 |
| b | 0.2802 | 0.3737 | 0.4335 |
Next, AIS level is converted to by using the transformation curve of single injury AIS scale to probability of fatality (Gennarelli & Wodzin, 2006).
2.3 Dynamical simulation models for
Human injury modelling and simulation is a well-developed topic in automotive research; with emphasis on consequences for humans involved in a car crash. As a result of this research dynamical simulation models have been developed and validated for collisions involving human and human crash dummies that are used in car crash testing. Examples of well-developed and validated simulation platforms are: (THUMS, 2015, 2018) and (MADYMO, 2017a,b). The former makes use of FE models of human body or crash dummy involved in a car collision, while the latter makes use of MBS models. Dynamic simulation of a collision yields detailed acceleration curves over time of various parts of the human body or crash dummy involved. These results are subsequently translated into well-developed injury scales. The commonly used injury scales are head injury criteria (HIC), neck injury criteria (Nij), and viscous criteria (VC) for injuries to head, neck and other body parts respectively. HIC takes the effect of sudden head acceleration into account (Hutchinson et al., 1998; Schmitt et al., 2019). Nij considers the consequences of head movements on neck forces and movements (Klinich et al., 1996; Parr et al., 2012). VC takes into account that injury to soft tissue injury is compression and rate dependent (Lau & Viano, 1986; Viano et al., 1989).
For dynamical simulation of UAS collision with human body or a crash dummy, a validated model of the UAS type considered has to be developed and integrated in one of these platforms. In addition, there is need for a transformation of assessed injury levels to . For integration in the THUMS (2015) platform, FE models have been developed by Arterburn et al. (2019, Annex B) of UAS types: DJI Phantom III, Sensefly eBee+ and Precision Hawk MK III. These models have been validated against acceleration measurements of drop tests on the head of a human dummy. Weng et al. (2021) developed and integrated an FE model of DJI Phantom III in THUMS (2018); this model has been validated against acceleration measurements of the head of a human cadaver (Stark et al., 2019). For integration in the MADYMO platform, Rattanagraikanakorn et al. (2019, 2020a) developed the MBS model of DJI Phantom III. As is shown in Figure 1, this MBS model consists of multiple body part masses that are connected via restraint joints, with ellipsoid surface to realistically represent external surfaces.

In Rattanagraikanakorn et al. (2020a) this MBS model has been validated against head acceleration measurements of drop tests on a crash dummy (Arterburn et al., 2017). In Rattanagraikanakorn et al. (2022) a comparison is also made between MBS dynamical simulation of DJI Phantom III falling down on the head of a crash dummy versus the head of human body. This comparison showed significant differences both in HIC values and Nij values. Most significant is the finding that for a human body, Nij value is negligible relative to HIC value.
In Rattanagraikanakorn (2021, pp. 149–150) a systematic comparison has been made of MBS simulated HIC values for a human body and those measured during hittings of human cadavers by a DJI Phantom III (Stark et al., 2019); this showed that the MBS model underestimated the measured HIC value on average by 11%. To compensate this estimation bias, in the sequel MBS dynamical simulation based HIC values are increased by 11%. Subsequently, the corresponding value is obtained by a conversion of an unbiased HIC values to percentage of life-threatening injury (Touger et al., 1995). For thorax and abdomen, the VC (Viscous Criterion) injury level (Lau & Viano, 1986) is obtained during MBS dynamical simulation. The VC level is then converted to in two steps: first a conversion curve from VC level to AIS level (Sturdivan et al., 2004), and then a conversion curve from AIS level to (Gennarelli & Wodzin, 2006).
2.4 Comparison for a DJI Phantom III UAS
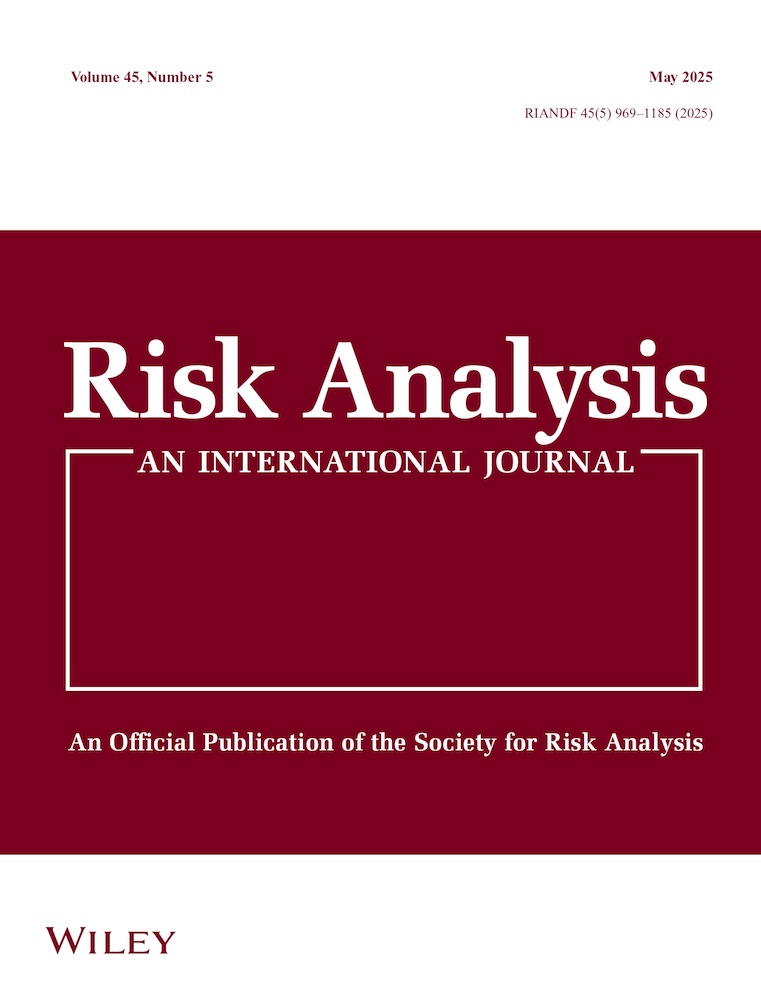
In this subsection we evaluate the existing models for and for a DJI Phantom III; a small UAS of weight 1.21 kg, width of 0.25 m; length of 0.25 m. Under a free fall, the drag-gravity equilibrium descent speed is 18 m/s (Arterburn et al., 2019, Annex A). Table 3 presents the calculated values for four models of and three models of and their relevant products. The unit of such product is . Following Equations (1.1), this is compensated by the unit 1/m2 of population density, and the unit of 1/hour of ground crash event rate.
 |
- The Dynamical Simulation result is obtained for a vertical drop on the center of human head, with UAS in upside-down attitude to avoid energy absorption by the camera gimbal.
The evaluated impact area models are: Planform area, the extrapolation of the MTOW based area (Ale and Piers, 2000), and the Gliding area model of RTI (Montgomery and Ward, 1995) for at descent angles of 90° and 60°, respectively. These values are shown in the left column of Table 3. The evaluated models for are, the BC model, the dynamical simulation model, and the RCC model. In the dynamical simulation based assessment of , the scenario of (Koh et al., 2018) is followed, that is, the DJI Phantom III makes a vertical drop in an upside-down attitude, on the center of a head of a standing standard male human. The upside-down attitude avoids energy absorption by the camera gimbal. The values obtained are shown in the top row of Table 3. The other locations in Table 3 show the product values for the 4 × 3 combinations.
- The dynamical simulation based value is 30% lower than the RCC value of 1.0, and a factor 3.7 higher than the value of the BC model.
- The RTI based value under a descent angle of 60° is a factor 3 higher than under 90°.
- In addition to the latter factor 3, the other values for vary by a factor 5 ( = 0.332 / 0.063), with the MTOW based area size value in between.
The dynamical simulation based value has been assessed for the case of vertical descent such that the mass center of the UAS coincides with the mass center of the human head. The straightforward multiplication of this value by an value, implicitly adopts the assumption that a centered value also applies when the crash center of a UAS has an offset with the center of the human body. The objective of the next section is to enrich the ground TPR model with such an offset parameter.
3 ENRICHED GROUND TPR MODEL
This section starts by showing that in ground TPR Equation (1.1), the product can be replaced by an integration of fatality probability values over different horizontal locations of the center of a UAS relative to the human center location. Subsequently, the effects of human face direction and drone velocity at impact are taken into account, and a numerical integration procedure is presented for the evaluation of the enriched model using a dynamical simulation model.
3.1 Enriched ground TPR model
The definition in (3.6) makes explicit that the ground TPR model enrichment consists of a dual exact characterization of the product . For the derivation of this dual characterization we have made use of a “hypothetical” delta definition in a horizontal plane at ground level. In the sequel we assume that the dual characterization (3.6) also applies if the integration over the “hypothetical” delta is replaced by an integration over a simulated delta that is defined at the moment the drone passes a horizontal plane that is well above the human head, instead of the horizontal plane at ground level.
3.2 Incorporating face direction, and drone velocity and attitude at impact
The idea is to obtain estimates by conducting dynamical simulations of an MBS model, for each relevant offset value Δ, rather than the “hypothetical” offset definition of subsection 3.1. To assure that this dynamical simulation starts shortly before a possible hitting of a human, the starting time of this dynamical situation is defined as the first moment that the drone center reaches a horizontal level that is above top of human head, where is the maximum range from drone center to drone edges. Figure 2a,b shows the situation at this moment . Offset Δ is defined as the 2-dimensional horizontal offset between center of drone and center of human head at this moment (see Figure 2b).

In addition to this offset Δ, human injury level also depends on the drone impact speed, course, descend angle, and attitude, as well as the human face direction at this time moment . We assume that human face does not look up or down; hence human face direction may vary in horizontal direction only.
As is shown in Figure 2b, by defining human face direction relative to the course of the drone, there is no need for drone course as a model parameter. Hence the impact model parameters are: 2-dimensional offset (defined at moment ), horizontal face direction , drone speed , descent angle , and 3-dimensional drone attitude (pitch, roll, yaw).
Comparison of Equation (1.1) to Equation (3.5) shows that the product in (1.1) is replaced by in (3.5). This is characterized in Equations (3.8-3.9) as a probabilistic integrations over the full range of possible ways a human on the ground can be hit by a drone. Equation (3.9) characterizes as an integration of impact offset Δ-dependent human fatality over all possible offsets Δ between drone crash center and the center of human head. Equation (3.8) characterizes the in Equation (3.5) as the averaged for possible variations in drone speed , descent angle , attitude and face direction Hence, in case of Dirac densities for then the results obtained for also apply for . The next subsection explains how the numerical integrations in Equations (3.8) and (3.9) can be combined with dynamical simulation of an MBS model to assess for relevant values of .
3.3 Numerical integration of the enriched ground TPR model
Accurate evaluation of Equation (3.12), typically asks for a very large number NMC of MC runs. The same level of accuracy can be reached by making use of appropriate variance reduction technique, such as Latin Hypercube Sampling, for example, Helton and Davis (2003).
4 EVALUATION OF ENRICHED MODEL THROUGH DYNAMICAL SIMULATION
This section numerically evaluates the enriched model of section 3 for a DJI Phantom III impacting a standing 50th percentile male human body. In line with Equation (3.6), this comes down to conducting novel numerical evaluation of , and comparing this with the results in subsection 2.4. For the numerical evaluation use is made of a validated MBS dynamical simulation model of Rattanagraikanakorn et al. (2020a,b) for a DJI Phantom III UAS. This validated MBS model assumes that UAS movement abruptly stops upon hitting the ground, which means it does not evaluate cases where human impact happens after a preceding ground hit (bounce or slide).
First, subsection 4.1 considers a vertical descent scenario, where head is always hit first. Next, subsection 4.2 considers non-vertical descent, as a result of which other parts of human body may be hit first by the drone. Subsection 4.3 compares the newly obtained results to the results for the existing model combinations in section 2 (Table 3). Subsection 4.4 assesses the effect of varying drone attitude. Subsection 4.5 assesses the effect of changing human face direction relative to drone course. Subsection 4.6 demonstrates that the novel method can also take well into account that UAS attitude and human face direction have densities that are uniform functions rather than Dirac functions, Subsection 4.7 discusses the results obtained.
4.1 Scenario A: Vertical descent
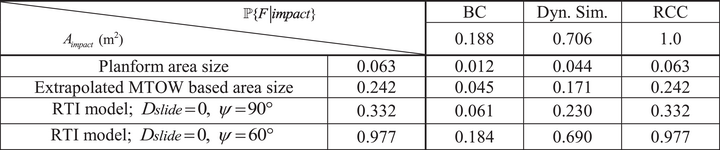
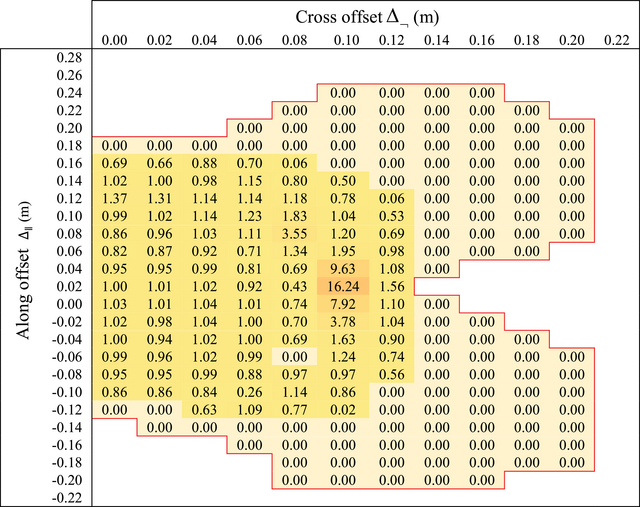
MBS simulations are conducted with offsets ΔP and varying over the Δ-grid, for face direction , for scenario A, of a pure vertical drop, that is descent angle . Similar to section 2, the UA impact speed of DJI Phantom III is set at . Simulation results of for varying offsets ΔP and are shown in Table 4, for pitch , yaw , roll , and face direction . Offset grid step is 0.02m; due to face direction results are symmetrical for positive and negative cross offset values. Figure 3 shows, for scenario A, impact at the center of gravity of the human head, that is, Δ = (0,0).
 |
- , , , , and face direction . Red line shows the boundary outside which the UAS does not touch human body. Integration over Δ and Dirac densities for yields .

For scenario A, the head is always first contacted by the drone. In case of an initial hit of human head, a drone may start to tumble, as a result a second hit on thorax or abdomen could happen. Such drone tumbling is also captured in the simulations. The simulation results for scenario A show no hit (first or second) on thorax or abdomen. The maximum of is at the center of the head. For off-centered combinations where the head is first contacted by the drone arm, typically limited impact energy is transferred to the human, due to the bending of arm and subsequent tumbling of the drone. Integration of the values in Table 4 yields
4.2 Scenario B: Non-vertical descent
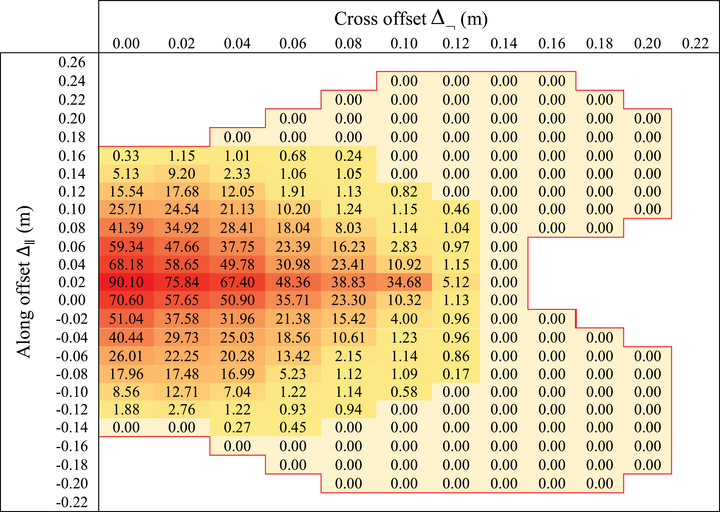
The following non-vertical impact scenario B is considered: Descent angle ψ = 60°, pitch , yaw , roll , impact speed MBS simulations are conducted with offsets and varying over the -grid, for face direction . Simulation results of for varying offsets and are shown in Table 5. Figure 4 shows a case of first hit on the abdomen.
 |
- Outside the red line, the UAS does not touch human body. For , first hits are on thorax and abdomen. Offset values that have a second hit on thorax/abdomen have a black border. Integration over Δ and Dirac densities for yields .

As is shown in Table 5, Scenario B simulations includes a large variety of first hits on thorax or abdomen. Table 5 also includes three offset combinations where first hit is on the head and the second hit happens on thorax/abdomen (these are marked by thick black borders). This illustrates that contributions of second hits to are very small.
Due to hits on thorax and abdomen in scenario B, contributions to come from a much larger area than for Scenario A (Table 4). Another difference is that the values near the central area of the head are for scenario B (Table 5) significantly lower than for scenario A (Table 4). The explanation is that for central hit under a descent angle of 60° the drone starts to tumble instead of the bouncing back that happens under a descent angle of 90°. Start of tumbling after first contact leads to less energy transfer to the head than bouncing back. Integration of the values through Equation (3.10) yields for scenario B, which is slightly lower compared to the for scenario A. This means that for scenario B, the additional risk contributions from hits on thorax and abdomen, do not compensate the significant smaller contributions to from hits around the center of the head.
4.3 Comparison versus existing models
In the literature on existing TPR assessment models, and also in the earlier Table 3, scenarios A and B are typically considered. In these scenarios, the DJI Phantom III descends in upside-down attitude (pitch is 180°). This upside-down attitude avoids possible energy absorption by the camera gimbal.
The for scenario A (Table 4) novel obtained is equal to value that was obtained in Table 3 for the existing model combination of Planform area and BC model. From the results for in Table 4, it can be assessed that the size of the area with non-zero values is . Taking into account that there is a similar area for negative cross offsets, the area size doubles to , which is almost equal to the size of the planform area in Table 3. This means that the BC model predicted , in Table 3, is also almost equal to the mean of in the area with non-zero values in Table 4.
All other combinations in Table 3 yield values for that are more than 3x as high. The closest result is for the combination Planform area size and Dynamical simulation. The more than 3x increase is due to the implicit assumption that , which yields for scenario A. The results in Table 4 show that it makes great sense to take the dependency of non-zero into account.
- For Scenario A (descent angle ), the obtained is almost a factor 5 lower than the value that was obtained in Table 3 for the combination of RTI model for and the BC model. Table 4 shows that most parts in the underlying map produce none or marginal contributions to this
- For Scenario B (descent angle ), the obtained in Table 5 hardly differs from for Scenario A. This is in large contrast to the factor 3 increase of the product in the RTI row in Table 3 relative to the row; this is purely due to a factor 3 increase of . A similar factor 3 increase is also seen by comparing the sizes of the hitting areas of in Table 5 and in Table 4. The results in Table 5 also show that the contributions from the enlarged area part are zero or marginally low.
This comparison shows that the novel approach has significant advantages in assessing scenarios A and B on TPR risk. In the next subsections, we will show that the novel approach also provides capabilities in assessing other relevant scenarios, and that these results may differ significantly from those obtained for scenarios A and B.
4.4 Varying UAS attitude
Figure 5 presents as a function of varying pitch, for four descent angles, that is with the other parameters the same as in scenarios A and B. The values vary from 0.013 to 0.001 m2; with highest values for and and lowest values for and . At pitches halfway, that is at or , the values also are halfway. Figure 5 shows that variation in descent angle yields a significantly lower variation in than the variation in pitch does. Due to the symmetrical shape of DJI Phantom III, the effect of varying roll on is similar to the effect of varying pitch.

For a better understanding of the much lower value when UAS pitch is zero, Table 4 shows the map of for scenario A1, which is the same as scenario A, with the exception of pitch .
Figure 6 illustrates both a centered and an off-centered impact situation in Table 6. Comparison of results in Table 6 with those in Table 4, shows that for areas where is close to 0, values are significantly lower under than under . The physical explanation is that for centered hit at pitch , the first contact is between camera and human head (e.g., in Figure 6.a). In such case, the camera gimbal, at the bottom of the drone, absorbs a significant part of the impact energy. Such absorption of energy is avoided when the drone is flipped upside down. The peak values for appear to be in an off-center area; that is, where the drone firstly contacts head with its main body and therefore transfers more impact energy directly to the head (e.g., in Figure 6.b). For other offset combinations, either camera or drone arm contacts headfirst, which reduces impact energy to be absorbed by human head.

 |
- Red line shows the boundary outside which the UAS does not touch human body. Integration over Δ and Dirac densities for yields .
Figure 7.a-b show the relative contributions to of first and second hits on thorax/abdomen for and respectively. For descent angle , the contribution of first and second hits on thorax and abdomen is on average 5.8% and 1.9% respectively, though with peaks of 20.5% and 12.3%, respectively.

Due to the symmetrical shape of DJI Phantom III, the effect of varying roll on is similar to the effect of varying pitch. Figure 8 shows examples of two specific combinations of roll and pitch during centered hits of human head, under vertical descent: a) Pitch and roll ; b) Pitch and roll . In Figure 9.b arm absorbs significant part of impact energy compared to Figure 8.a, which results in a much lower central impact value, that is, in Figure 8.b versus in Figure 9.a.


4.5 Varying face direction
Figure 9 presents the simulation results of as a function of face direction, for the four descent angles, and for , that is, the pitch value that yields the highest risk under non-vertical descends.
The results in Figure 9 show that is symmetrical for face direction [0, 180] and [−180, 0] degrees. They also shows that varying face direction leads to less than a factor 1.3 variation in
Remark: Whereas the MBS dynamical simulation model of Rattanagraikanakorn et al. (2020a,b, 2022) can handle head impacts under any face direction, it can only handle impacts on thorax and abdomen for zero face direction. Therefore, to obtain Figure 9, it is assumed that contributions to from hits on thorax and abdomen are for all face directions the same as for face direction .
4.6 Effect of uniform densities for pitch and face direction
So far we have evaluated scenarios where the densities for drone attitude and face direction are Dirac functions. As has been shown in Equation (3.8), can also be assessed in case of arbitrary density shapes. Because face direction and UAS pitch may adopt various values, in this subsection we evaluate under uniform densities for UAS pitch and human face direction, and compare these results with results obtained for cases A, A1 and B. The novel scenarios considered are A2 and B2. To improve comparison of results, also a scenario B1 is evaluated, which is a combination of scenario A1 and B. All these six scenarios are specified in Table 7, and with the assessed values given in the right-hand column. For the assessment of scenarios A2 and B2, grid base versions of these Uniform pdf's are used to evaluate grid-based version (3.11) of Equation (3.8).
| Comb. | [m2] | ||||
|---|---|---|---|---|---|
| A | Dirac(18m/s, 90°) | Dirac(180°) | Dirac(0°, 0°) | Dirac(0°) | 0.012 |
| A1 | Dirac(18m/s, 90°) | Dirac(0°) | Dirac(0°, 0°) | Dirac(0°) | 0.001 |
| A2 | Dirac(18m/s, 90°) | Uniform(0,360°) | Dirac(0°, 0°) | Uniform(0,360°) | 0.0047 |
| B | Dirac(18m/s, 60°) | Dirac(180°) | Dirac(0°, 0°) | Dirac(0°) | 0.010 |
| B1 | Dirac(18m/s, 60°) | Dirac(0°) | Dirac(0°, 0°) | Dirac(0°) | 0.0014 |
| B2 | Dirac(18m/s, 60°) | Uniform(0,360°) | Dirac(0°, 0°) | Uniform(0,360°) | 0.0062 |
Comparison of values obtained for scenarios A and A1 shows that due to energy absorption by the camera gimbal, human risk is reduced by a factor 12, under 0° human face direction. Scenario A2 takes into account that UAS pitch and human face direction are not under control, as a result of which the assessed value lies somewhere in between the values assessed for scenarios A and A1.
Although the values obtained for scenarios B, B1 and B2 show a similar effect as for scenarios A, A1 and A2, there also are remarkable differences: i) the value for scenario B is 16% lower than for A; ii) the value for scenario B1 is 40% higher than for A1; and iii) the value for scenario B2 is 30% higher than for A2.
4.7 Discussion of results for DJI Phantom III
Section 4 illustrates the application of the method from Section 3 to a DJI Phantom III UAS, which is a small UAS of weight 1.21 kg. For the dynamical simulations the validated MBS model of Rattanagraikanakorn et al (2020a, b) has been used. Overall, the obtained results show that the novel approach provides a much more detailed assessment of the effect of various UAS design choices on ground TPR than existing models can do.
Subsections 4.1 and 4.2 showed that strongly depends on the horizontal offset , for descent angles of 90° and 60° respectively. Subsection 4.3 compared the results obtained for the proposed approach to those from the existing model combinations of section 2. The newly assessed values for the product appear to be an order in magnitude lower than the values produced by the existing methods. It was also shown that this difference is largely due to the fact that existing models implicitly assume that the fatality probability of a head-centered hit also applies for all other offset values in .
Subsections 4.4 and 4.5 showed the influences of attitude of the descending drone and of human horizontal face direction on these results. The effect of horizontal face direction appears to be relative low, that is, less than a factor 1.3 variation. The effect of UAS attitude has a significant larger influence on the assessed values, with largest effect from varying drone pitch. The physical explanation is that under zero pitch and near-centre hits, the camera gimbal has a strong damping effect on the risk. Also, when the camera gimbal is not involved in the impact, for example, pitch 90°–270°, the variation remains significant.
Because face direction and UAS attitude are not typically not under control, in subsection 4.6 an assessment is conducted for cases of uniform densities for face direction and UAS pitch. This shows that the novel method can take the effects of such uncontrolled parameters well into account in TPR risk assessment.
5 CONCLUSIONS AND FOLLOW-ON RESEARCH
A challenge for commercial UAS-based services is that the imposed level of ground TPR increases linearly with the density of potential customers of UAS services. This challenge asks for the development of complementary directions for improving safety feedback to the design and use of UAS. Two of these directions in enhancing safety feedback have received significant attention in literature: i) To reduce the rate of a UAS crash to the ground by hazard identification and mitigation; and ii) To reduce overflying of more densely populated areas by developing risk-aware UAS path planning strategies. This paper addressed the complementary direction of enhancing safety feedback to the design of drone shape and materials used.
5.1 Conclusions
Section 1 has explained that the design of drone shape and materials used have a strong influence on two of the five product terms in the ground TPR model, that is, the size of the “crash impact area”, and the probability of fatality for an unprotected person in the “crash impact area”.
Section 2, has shown that in literature, model development and assessment of and has evolved along separate routes, which leads to a combinatorial number of combinations for their product. Section 2 also showed, for a well-studied UAS of 1.21 kg, existing models yield a significant range of possible values for each of the two terms. This explains why regulation tends to adopt conservative values for both terms, for example, JARUS (2019), and at the same time offers an open door for UAS developers to develop and apply dedicated safety assessments, for example, JARUS (2022, 2023).
Section 3 developed an integrated approach to the modelling and assessment of the product . First, subsection 3.1 has shown that in the commonly adopted model for ground TPR, this product can be replaced by an integration of over horizontal offset value , between the center of UAS crash location and center of human head. This integration approach forms the basis for the development of a dynamical simulation-based assessment of the product of the two terms. Subsection 3.2, captures the dependency of on other encounter parameters, such as drone speed, descent angle, drone attitude, as well as human face direction relative to the UAS course. In subsection 3.3 a numerical method is developed for the assessment of through conducting dynamical simulations with an MBS model of a UAS hitting a human.
Section 4 applied the method from Section 3 to a DJI Phantom III UAS, which has a weight of 1.21 kg. For the dynamical simulations, the validated MBS model of Rattanagraikanakorn et al. (2020a,b) has been used. The obtained results demonstrate that the approach from Section 3 is able to assess the effect on TPR of various model parameters that are not covered by existing models. This includes parameters for the shape and material properties of the UAS, as well as parameters for horizontal offset , attitude of the descending drone, and human horizontal face direction. The dynamical simulation results obtained for the DJI Phantom III UAS, demonstrate that the enriched ground TPR model and the dynamical simulation method of section 3 yields three improvements. Firstly, there is no longer a need to adopt a separate model for . Secondly, the novel approach takes into account that off-center fatality probabilities may differ from the head centered fatality probability. Thirdly, the novel approach is able to take the effect of UAS shape and material design aspects into account.
These results support the overall conclusions that the dynamical simulation method of section 3 offers an innovative method that fits within the commonly used ground TPR model in use by safety regulation, and at the same time provides a more detailed safety feedback to the design of UAS shapes and materials. This step-change in safety feedback to UAS design also stimulates various directions along which the novel approach of section 3 can be further developed and applied.
5.2 Follow-on research
The refined ground TPR model of Section 3 includes the situation that a UAS hits the ground prior to reaching human. However, the validated MBS model of DJI Phantom III UAS assumes that upon hitting ground, the UAS simply stops instead of making a bounce or slide. To also include the effect of preceding hit(s) on the ground, it is worthwhile to develop MBS models for ground and for ground contact, and include these in the dynamical simulations.
The use of the developed method has been illustrated for a small UAS of 1.21 kg. This raises the question if it can also provide effective safety feedback to the design of a parcel delivery UAS, the weight of which is an order in magnitude higher. In such case, for the larger part of the “crash impact area” a hit by such larger UAS will be fatal for human; this means that the factor reduction of the product will no longer be an order in magnitude. This would mean that commercial use of larger UAS in areas with the highest density of customers might remain out of scope, unless innovative UAS design directions are developed. The method of section 3 provides the means to significantly enhance safety feedback in the modelling and assessment of such innovative design directions. An example is to mitigate ground TPR by equipping a UAS both with a parachute and an airbag (Manta Air, 2023). In car-crash dynamical simulation, FE model of an airbag is used to assess the mitigating effect of an airbag (MADYMO, 2020). The approach of Section 3 makes it possible to follow a similar approach for the impact of a UAS equipped with airbag.
The dynamical simulation model used in section 4 is a validated MBS model of the UAS considered integrated in the MADYMO platform. It also is possible to use a validated FE model of the UAS considered integrated in the THUMS platform. Use of an FE-based model may yield a slightly higher level of precision than an MBS-based model (Fahlstedt et al., 2016). To manage the significantly higher computational demand of an FE model, a valid approach is to take advantage of variance reduction through the use of Latin Hypercube sampling (Helton & Davis, 2003).
So far, common practice is to consider UAS collision with a 50-percentile standing male human. However, higher injury levels are expected for UAS collision with woman and children. Because both the MADYMO platform and the THUMS platform include validated dynamical simulation models of woman and children, this extension is relative straightforward once a validated MBS or FE model of the UAS considered has been integrated in the corresponding platform.
ACKNOWLEDGMENTS
The authors thank anonymous reviewers for their valuable suggestions in improving an initial version of this paper. This research did not receive any specific grant from funding agencies in the public, commercial or not-for-profit sectors.