Assessing Climate Change Impacts on Wildfire Exposure in Mediterranean Areas
Abstract
We used simulation modeling to assess potential climate change impacts on wildfire exposure in Italy and Corsica (France). Weather data were obtained from a regional climate model for the period 1981–2070 using the IPCC A1B emissions scenario. Wildfire simulations were performed with the minimum travel time fire spread algorithm using predicted fuel moisture, wind speed, and wind direction to simulate expected changes in weather for three climatic periods (1981–2010, 2011–2040, and 2041–2070). Overall, the wildfire simulations showed very slight changes in flame length, while other outputs such as burn probability and fire size increased significantly in the second future period (2041–2070), especially in the southern portion of the study area. The projected changes fuel moisture could result in a lengthening of the fire season for the entire study area. This work represents the first application in Europe of a methodology based on high resolution (250 m) landscape wildfire modeling to assess potential impacts of climate changes on wildfire exposure at a national scale. The findings can provide information and support in wildfire management planning and fire risk mitigation activities.
1. INTRODUCTION
Wildfires pose a growing threat to ecosystems1, 2 worldwide and are frequently responsible for human casualties and substantial economic losses.3 The occurrence of wildland fires in the Mediterranean area is mainly related to human activities,4, 5 whereas area burned is dependent on many factors such as climate and weather, topography, vegetation and land use, urban sprawl, and fire policies.6, 7 A number of studies have highlighted that climate and weather conditions are key factors to understand fire spread and behavior, and directly affect spatiotemporal patterns in wildfire exposure and risk.8-11 It is widely recognized that wildfire risk and exposure could be exacerbated by climate change.12-20 According to the most recent Intergovernmental Panel on Climate Change (IPCC) report,21 temperatures in southern Europe are expected to increase, resulting in more frequent heat waves and droughts.22-24 Fire activity is expected to increase in terms of both area burned and fire occurrence, although climate change impacts will be variable around the region.12, 14-18, 25 However, most studies investigating climate change effects on wildfires are based on a coarse scale (>1 km grid data) and therefore did not capture the local drivers of fire behavior and risk (e.g., fuels, weather, topography). For instance, previous studies on future fire risk and danger in the Mediterranean basin used coarse scale fire danger indices such as the Canadian Forest Fire Weather Index (FWI)26 or statistical models of climate and vegetation.16, 18, 27-31 The fine scale patterns in fire behavior are important from a risk standpoint, and can be assessed with a number of innovative approaches developed in the last decade for estimating and mapping wildfire risk and exposure.5, 32-36 These approaches use quantitative wildfire risk assessment 34 and employ a number of relatively new large fire modeling systems. Wildfire risk assessment includes two main factors: fire behavior probabilities and fire effects. In this article, we focused on the first component, also called exposure analysis, which is based on the estimation of the potential wildfire intensity and on the burn probability.37 Fire spread modeling is a necessary component for wildfire exposure assessment.38 Landscape fire spread and behavior models such as FSim,39 FlamMap,40 and its command line version Randig allow simulating thousands of fires and generating burn probability and intensity maps based on the minimum travel time (MTT) algorithm.41 The models have been tested and applied in a number of fire systems in the United States, Canada, Portugal, and the Mediterranean basin.41-48 However, these models have not been fully leveraged
To analyze the potential future impacts of climate change on wildfire behavior and spread at national scale.49-51 For instance, Arca et al.49 performed fire simulations for Sardinia, Italy (24,000 km2) to assess the impact of future (2070–2100) climate changes on spatial variations of burn probability and intensity. Mitsopoulos et al.50 analyzed climate change impacts (from 1991 to 2100) on fire intensity and probability using the MTT algorithm for an area of about 100 km2 in Greece. More recently, Kalabodikis et al.51 combined future climate data and the MTT algorithm to assess variations on burn probabilities, fire size, and intensity in Messinia, Greece (3,000 km2).
In this study we apply fine scale simulation modeling to assess the impact of climate change on fire exposure at a national scale (covering a total area of about 310,000 km2) using a wildfire modeling approach based on the MTT algorithm. This work demonstrates the feasibility of the overall approach for assessing future climate change impacts on fire exposure (250 m) while considering fine scale risk factors (e.g., topography, fuels) that influence landscape wildfire spread and behavior. The methodology and results contribute to local mapping of climate-induced changes in fire regimes that can help fire managers respond to potential increased risk with improved management guidelines, risk mitigation, and prevention policies.
2. METHODS
2.1. Study Area
The study area is located in the Euro-Mediterranean region, and consists of the entire country of Italy as well as the French island of Corsica (Fig. 1). It is located between 35° 29’ and 47° 05’ N latitude and 8° 13’ and 18° 31’ E longitude, and covers about 310,000 km2.
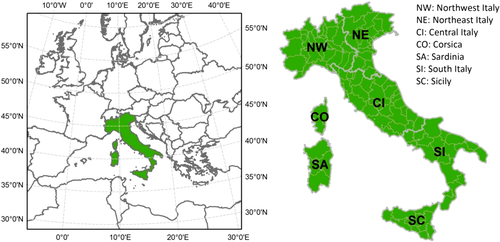
To ensure reasonable computational times for both climate change analysis and wildfire modeling phases, the study area was divided into the following seven subareas (Fig. 1; Table II): Northwest Italy (NW), Northeast Italy (NE), Central Italy (CI), South Italy (SI), Sicily (SC), Sardinia (SA), and Corsica (CO). The general criteria for the division into subareas were based on administrative limits (using provincial boundaries), climate and wildfire history.
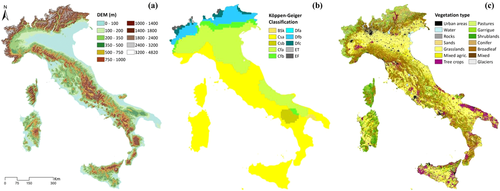
The two main mountain ranges of the Italic peninsula are the Alps, as natural northern border, and the Apennine Mountains, which cross Italy from north to south (Fig. 2a). Flat areas are mainly concentrated in coastal zones and in the Po river area. According to the updated Köppen–Geiger climate classification (Fig. 2b),52 most of the study area is characterized by a temperate climate (87.5% of the total area). The semi-arid climate can only be found in a small area on the southern coast. Cold climate types without dry season can be found in the Alps, whereas the highest zones are characterized by polar climate. The vegetation distribution within the study area is not uniform (Fig. 2c).53 The most extended vegetation type is “grasslands” (Table I),53 mostly situated in flat areas. Forests are mainly concentrated in hilly and mountain areas. Although shrublands (Mediterranean maquis and garrigue) represent less than 10% of the total study area, some regions like Sardinia and Corsica are mainly covered by this vegetation type. Vineyards and orchards are concentrated in some areas, such as the eastern areas of southern Italy and in Sicily, whereas herbaceous pastures are scattered along hills and mountains.
| Fuel Types | CLC Codes | Reference Fuel Models Used | Area (km2) | Incidence (%) |
|---|---|---|---|---|
| Urban and anthropic area | 1 | NB156 | 14,861 | 4.80 |
| Water | 4; 5 | NB856 | 4,007 | 1.29 |
| Rocks | 332 | Mod 1 (reduced load 50%)55 | 4,722 | 1.53 |
| Sands | 331 | Mod 155 | 758 | 0.24 |
| Grasslands | 211; 212; 213; 231 | Mod 155 | 88,579 | 28.62 |
| Mixed agricultural | 241; 242; 243; 244 | Mod 155 | 48,211 | 15.58 |
| Vineyard and orchard | 221; 222; 223 | Mod 255 | 21,610 | 6.98 |
| Pastures | 321 | CM 2757 | 15,521 | 5.02 |
| Garrigue | 333; 334 | CM 2957 | 4,840 | 1.56 |
| Mediterranean maquis | 322; 323; 324 | CM 2857 | 24,880 | 8.04 |
| Conifer forests | 312 | TL656 | 13,259 | 4.28 |
| Broadleaf forests | 311 | TL356 | 56,693 | 18.32 |
| Mixed forests | 313 | TU156 | 11,107 | 3.59 |
| Glaciers | 335 | NB856 | 405 | 0.13 |
| Code | Regions Included | Total Area (km2) | Inhabitants (million) | Average Annual Number of Fires | Average Annual Area Burned (ha) | Average Annual Area Burned/Total Area (%) | |
|---|---|---|---|---|---|---|---|
| Corsica | CO | Corsica | 8,716 | 0.32 | 302 | 6,053 | 0.69 |
| Sardinia | SA | Sardegna | 23,909 | 1.66 | 1,019 | 9,898 | 0.41 |
| Sicily | SC | Sicilia | 25,552 | 5.09 | 639 | 14,990 | 0.64 |
| South Italy | SI | Basilicata, Calabria, Campania, Puglia | 58,435 | 12.52 | 3,154 | 32,043 | 0.55 |
| Central Italy | CI | Abruzzo, Lazio, Marche, Molise, Toscana, Umbria | 73,395 | 13.72 | 1,628 | 14,561 | 0.20 |
| Northwest Italy | NW | Emilia-Romagna (west part), Liguria, Lombardia, Piemonte, Valle d'Aosta | 68,926 | 18.10 | 1,434 | 15,203 | 0.26 |
| Northeast Italy | NE | Emilia-Romagna (east part), Friuli-Venezia, Giulia, Trentino-Alto Adige, Veneto | 50,992 | 9.69 | 420 | 2,479 | 0.05 |
| Entire study area | ST | 309,925 | 61.10 | 8,597 | 95,226 | 0.30 |
2.2. Input Data for Fire Simulations
2.2.1. Topography and Fuels Data
We obtained information on fuels and topography to produce a landscape file, as required by RANDIG, the command line version of FlamMap used for the wildfire simulations in the study. The landscape file is composed of eight layers: elevation, slope, aspect, fuel models and canopy cover, canopy bulk density, canopy base height, and stand height. All layers included in the landscape file were set at 250 m resolution in UTM projection (WGS84 datum).
Input data for elevation, aspect, and slope layers were obtained from digital elevation data (90 m resolution),54 which were resampled by bilinear interpolation to 250 m resolution. To define fuel type and canopy cover layers, we reclassified the Corine Land Cover map of 2006 (250 m resolution)53 following the methodology proposed by Salis et al.45 From the original 44 Corine land cover categories present in the study area, 14 main fuel types were defined (Table I; Fig. 2c). Standard55, 56 or custom fuel models were attributed to each fuel type of the study area (Table I). The custom fuel models were developed as part of previous wildfire research45, 57 and were applied to shrubland vegetation (Mediterranean maquis and garrigue). To each fuel model, a canopy cover class was also assigned: we used class 4 (75–100% of canopy cover) for all pixels identified as “Forests” (coniferous, broadleaf, and mixed forests), while we used class 1 (1–25% of canopy cover) for the cells classified as “Mediterranean maquis.” The canopy fuel layers (canopy bulk density, canopy base height, and stand height) were finally built using average values derived from the Italian Inventory of Forests and Forest Carbon Sinks.58
2.2.2. Climate Projections
The CMCC-CLM climate data set associated to the A1B IPCC emissions scenario59 was used to obtain daily data on air temperature at 2 m, rainfall, relative humidity, and wind speed and direction at 12:00 UTC for the period 1981–2070. Although we used CMIP3 data, according to the IPCC60 the differences between CMIP3 and CMIP5 models in climate projections are quite limited. The climate projections were produced by the Euro-Mediterranean Center on Climate Change (CMCC) within the FUME project (FP7/2007–2013, Grant Agreement 243888) using the CMCC-CLM regional climate model.61 This regional model was implemented over the Euro-Mediterranean area with boundary conditions from the CMCC-MED GCM model.62, 63 The CMCC-CLM model is a climate version of the regional COSMO model,64 an operational nonhydrostatic meso-scale weather forecast model developed by the German Weather Service, which has been updated by the CLM-Community to develop also climatic applications. The climate simulations have been performed for the period 1981–2070 following the IPCC 20C3M protocol for the 20th century part of the integration and the A1B scenario for the 21st century. The climate data set presents a spatial and temporal resolution of 14 km and 6 hours, respectively, thus providing a good representation of the topography for the entire Mediterranean region and contributing to accurately represent weather conditions. Climate data have been split in three 30-year periods: one used as baseline period (1981–2010), and two as future periods (2011–2040 and 2041–2070).
2.2.3. Wind and Fuel Moisture for Fire Simulations
Daily conditions at noon of both wind direction and speed and fuel moisture content for the period 1981–2070 were derived using the climate data set described above. In detail, wind variables were created from U (east-west) and V (north-south) wind components. The frequency of each combination of wind speed and direction values (Annex 1) was calculated for each subarea considering the three 30-year periods. Dead and live fuel moisture were estimated by using the Fine Fuel Moisture (FFMC) and Drought (DC) codes of the FWI as indicators. Both codes have been shown to be good estimators of dead and live surface fuel moisture in previous works.28, 65, 66 To estimate fuel moisture conditions, for each subarea and each 30-year period, we first calculated the 25th, 50th, 75th, 90th, 95th, and 97th percentile of FFMC and DC daily values for each pixel. As a result, 18 raster layers for each moisture code were produced (6 percentiles × 3 periods), which summarized FFMC and DC values for each pixel of the study area. Then, mean values of FFMC and DC of each percentile (raster layer) were calculated within each subarea. Second, FFMC and DC values above the Sardinian 75th percentile, considering the baseline as reference, were labeled as “moderate,” “dry,” “very dry,” or “extreme” moisture categories, as reported in Table III. We associated to the above-mentioned categories specific fuel moisture conditions (Table III), which were used to run the simulations. Finally, for each 30-year period and each subarea, we calculated the percentage of days corresponding to the four fuel moisture categories (moderate, dry, very dry, and extreme).
| Moisture Category Label | Moderate | Dry | Very Dry | Extreme | |
|---|---|---|---|---|---|
| Percentile threshold | 75th–90th | 90th–95th | 95th–97th | >97th | |
| Dead Fuel | 1 h | 11–14 | 9–11 | 7–9 | 5–7 |
| 10 h | 13–16 | 11–13 | 9–11 | 7–9 | |
| 100 h | 15–18 | 13–15 | 11–13 | 9–11 | |
| Live Fuel | Shrubs | 110–90 | 90–80 | 80–75 | 75–65 |
| Forests | 130–105 | 105–100 | 100–95 | 95–85 | |
- Note: The data were derived from the analysis of different FFMC and DC percentile thresholds (75th, 90th, 95th, 97th), using Sardinia as reference.
We used Sardinia as a reference for the entire study area since the relationships among weather conditions, FWI codes, and fuel moisture content were reported in previous works in this area, based on large amounts of field data.28, 67-70 We focused our attention on data above the 75th percentile because this threshold characterizes the driest fuel moisture conditions, which correspond to the fire season periods.
In conclusion, these analyses allowed to create frequency distributions of wind speed and direction (4 wind speed values × 8 wind directions; Annex 1) and fuel moisture conditions (moderate, dry; very dry, and extreme; Annex 2) for each subarea and 30-year period, which were used as input data for the fire spread simulations.
2.2.4. Fire Occurrence Database
For the study area, we used the wildfire database from 1990 to 2008 provided by the JRC (Joint Research Center), which contains the total fire number and area burned per month at province level (European code NUTS3; Fig. 3). The spatial distribution of fire ignition points was produced by randomly assigning ignition coordinates within the province boundaries according to the mean annual number of fires at province level (Fig. 3a). This approach was performed in a GIS environment and allowed to locate random fire ignitions only in burnable areas, thus excluding unburnable fuels.
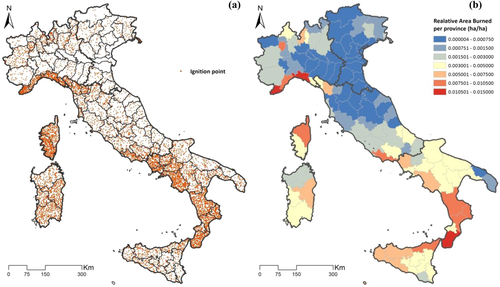
We then built an ignition probability grid by smoothing the fire ignition data using the inverse distance weighting algorithm (ArcMap Spatial Analyst toolbox, ESRI Inc.), with a search distance of 5,000 m. This grid was used as input for the fire spread modeling exercise.
2.3. Wildfire Simulations
Simulations were performed using the minimum travel time (MTT)71 fire spread algorithm, as implemented in RANDIG. This command line version of FlamMap allows simulating a large number of wildfires according to a given ignition density grid. Although each single event is simulated under constant weather conditions, the fire simulations can be informed considering given frequency distributions of wind speed, wind direction, and fuel moisture. This allowed us to compare the effects of the different climate conditions on the simulation outputs, for each subarea and 30-year period. RANDIG is appropriate to model short-duration single-day burn periods (e.g., 10 hours, as used in this study), such as the majority of fires in the Mediterranean Basin, while this approach could have more limitations in areas characterized by multiday large fire events, as, for instance, forests in the northern United States and Canada.72 No suppression efforts were assumed for the simulations. Surface fire spread is predicted by Rothermel's equation73 and crown fire initiation is evaluated according to Van Wagner model74 as implemented by Scott and Reinhardt.75
As previously explained, the input data for the simulations were produced at 250 m resolution; the outputs were also produced at 250 m resolution.
Within each subarea, fuel moisture conditions and wind speed and direction for each event simulation were sampled from the distributions corresponding to each 30-year period, as described above. Wind fields at 250 m resolution were produced running the mass-consistent model WindNinja.76, 77 Furthermore, fire ignition locations were determined for each subarea from the ignition probability grid (as described in “Input data”): this allowed for taking into account the historical spatial patterns of fire occurrence at provincial level. During a single fire event simulation, fuel moisture and wind fields were held constant.
Overall, we simulated 620,000 fire events in the entire study area for each 30-year period (a total of 1,875,000), corresponding to an average of two fire ignitions per square kilometer. This number of simulations resulted in more than 78% of pixels burned at least once and that the total area burned was about 10 times the entire study area. All wildfires were simulated considering a spread duration of 10 hours. We used a fixed fire spread duration of 10 hours since: (1) previous methodologies for fire risk assessment based on fire spread models contemplated the use of fixed burn periods;72 (2) a fixed fire spread duration for all study areas and periods ensured that the differences in wildfire exposure (burn probability, fire size, etc.) were only related to climate effects and not to differences in fire duration; and (3) 10 hours is a common duration of large fires in the Mediterranean basin.46, 68
2.4. Characterizing Wildfire Exposure
The exposure analysis is a part of the risk analysis and quantifies the exposure to risk factors (fire likelihood and intensity).38
To characterize wildfire exposure, we analyzed and processed RANDIG outputs, namely, burn probability, conditional flame length, and fire size, and we also calculated other specific indices such as fire potential index, high flame length burn probability, and high flame length probability.


Another output of RANDIG is the Fire Size (FS, ha) list, which indicates the size of the fire originated by each ignition point. The FS grid for the study areas was produced from the FS list and using the inverse distant weighting tool (ArcMap Spatial Analyst) with a search distance of 2,500 m.


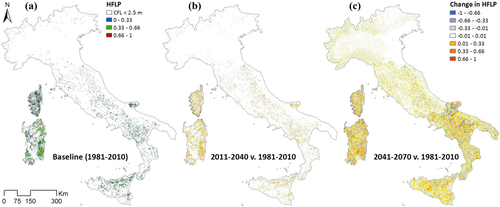
In few words, HFLP is the probability a pixel will burn at high flame length, considering only the fires burning that pixel. This index, in addition to the HFLBP, provides quantitative information about the probability of high fire intensity when the pixel burns.
2.5. Statistical Analysis
The differences between baseline and future periods in terms of wind, fuel moisture, and fire exposure indicators were evaluated by calculating the relative difference between mean values; the analysis was replicated for each subarea (Fig. 4). To assess differences in fire exposure, a one-way analysis of variance (ANOVA), performed by the general linear models method and followed by the post hoc Student–Newman–Keuls test, was used to measure the significance of differences between mean values of the fire exposure indicators (BP, CFL, FS, FPI, HFLP, and HFLBP) for each period and subarea.80 A p-value of 0.01 was used as level of significance for comparisons among means. Statistical analyses were performed with R software (R Development Core Team, 2013).81

3. RESULTS
3.1. Overview of the Projected Changes in Weather Variables
The climate projections highlighted an increase in temperatures for the entire study area, and a decrease in relative humidity and rainfall (data not shown). Moreover, wind speed is expected to decrease in terms of average values as well as in terms of frequency of days with strong winds, particularly in northern Italy (Fig. 4; Annex 1). No relevant variations were observed for wind direction. In the following sections, changes in wind speed and direction and fuel moisture are described in detail since these variables affect directly fire spread modeling.
3.1.1. Changes in Wind Speed and Direction
Referring to the baseline period, the subareas with the highest incidence of the highest wind speed (21–30 and >30 km h−1) were Sardinia and Sicily, followed by South Italy, Corsica and, to a lower extent, Central Italy (Annex 1). On the contrary, the subareas with high frequencies of lower wind speed days (0–10 km h−1) were Northwest Italy and Northeast Italy. With respect to the variation throughout the future periods (Fig. 4; Annex 1), the general trend was an increase in the frequencies of the lowest wind speed class (0–10 km h−1) and a decrease in the highest ones, especially for the class > 30 km h−1. In the 2011–2040 period the lowest wind speed frequencies mainly increased in Sicily, Sardinia, and Corsica. The highest wind speed class frequencies decreased at a different scale for each subarea, showing the larger diminution in Northwest and Northeast Italy and the lower decrease in South and Central Italy. Similar changes were observed for the 2041–2070 period, but in this case slightly higher differences were observed; regarding the 0–10 km h−1 wind class, the differences between the subareas were not particularly marked.
3.1.2. Changes in Fuel Moisture
As described in Section 2, from the climate projections we derived FFMC and DC codes for the baseline period (1981–2010) and for the two future periods (2011–2040 and 2041–2070), and then we used these codes as indicators of fuel moisture.
The analysis of the baseline data (Annex 2) highlighted that the frequency of “moderate” fuel moisture days for both codes was always greater than 50% but with noticeable differences among the subareas. For both codes, Sicily showed the highest values of “dry,” “very dry,” and, especially, “extreme” moisture days (about 10% for dead fuels and 11–12% for live fuels), followed by Sardinia and South Italy. On the contrary, the lowest frequencies of extreme fuel moisture were shown by Northwest and Northeast Italy, the frequency of “moderate” days being more than 95% for both codes. Corsica and Central Italy showed similar fuel moisture frequencies, particularly for fine fuels.
Regarding the variation between the baseline period (1981–2010) and the two future periods (2011–2040 and 2041–2070), in the entire study area the frequency of “moderate” fuel moisture days is expected to decrease for both codes in the two future periods (Fig. 4; Annex 2). The frequencies of the driest categories for FFMC in the 2011–2040 period did not change in Central and Northern areas, while in Sicily, Sardinia, and, to a lower extent, in South Italy, the frequencies of “dry” and “very dry” fuel moisture days slightly increased. However, in the second period (2041–2070), the frequencies of the driest moisture categories increased, except for Northeast and Northwest Italy. The highest increase in the driest categories of FFMC was shown by Sicily followed by Corsica and Central Italy in this second future period.
The changes in DC categories frequencies were in general higher than those in FFMC (Fig. 4; Annex 2). In the 2011–2040 period, the frequency of the days with the highest DC values increased in Corsica and Sardinia and, to a much lower extent, the frequency of “very dry” days in Sicily; the frequency of “extreme” days in Sicily decreased slightly as well as the frequencies of the driest categories in South Italy. The frequencies of the other subareas did not change in this period. In the 2041–2070 period the changes in DC are more evident. The frequencies of the driest categories increased for all subareas except for Northwest and Northeast Italy, where only the “very dry” live fuel moisture frequency increased. In this case, Corsica showed the highest increase followed by Central Italy, Sicily, and Sardinia.
3.2. Changes in Wildfire Exposure
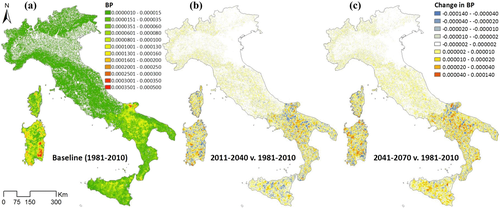
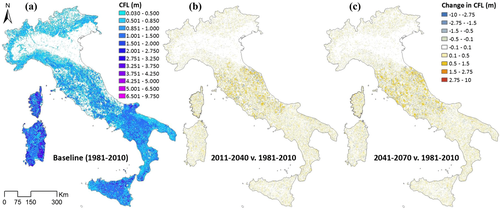
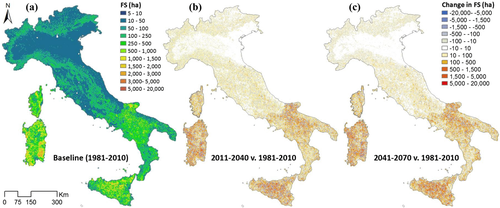
From the outputs of RANDIG simulations, a set of fire exposure indicator maps (BP, CFL, FS; Figs. 5-7) was derived for the different study periods and subareas. The highest values of BP, CFL, and FS were observed in Sardinia, Corsica, and Sicily, while the lowest values were observed in northern areas and Central Italy (Figs. 5-7 and 10; Table IV). Overall, BP and FS changed in a similar way in both future periods and for all subareas (mostly decreasing in the 2011–2040 period and increasing in the 2041–2070 period), whereas the CFL barely varied among periods and subareas (Table IV; Fig. 10).
| CO | SA | SC | SI | CI | NW | NE | ST | ||
|---|---|---|---|---|---|---|---|---|---|
| BP | 1st | 5.1720·10−5 a | 9.0739·10−5 b | 3.9580·10−5 c | 4.4730·10−5 d | 5.0956·10−6 e | 3.0600·10−6 f | 1.0800·10−6 g | 2.2243·10−5 |
| 2nd | 5.0930·10−5 a | 9.0740·10−5 b | 3.8640·10−5 c | 4.4240·10−5 d | 4.9781·10−6 e | 2.9800·10−6 f | 1.0700·10−6 g | 2.2001·10−5 | |
| 3rd | 5.1200·10−5 a | 9.3057·10−5 b | 4.4190·10−5 c | 4.7240·10−5 d | 5.4492·10−6 e | 2.9300·10−6 f | 1.0500·10−6 g | 2.3312·10−5 | |
| CFL | 1st | 1.7158 a | 1.5493 b | 1.1304 c | 0.9499 d | 0.6164 e | 0.3102 f | 0.2527 g | 0.6973 |
| 2nd | 1.7150 a | 1.5440 b | 1.1279 c | 0.9444 d | 0.6157 e | 0.3031 f | 0.2506 g | 0.6934 | |
| 3rd | 1.7413 a | 1.5334 b | 1.1332 c | 0.9482 d | 0.6195 e | 0.3038 f | 0.2480 g | 0.6948 | |
| FS | 1st | 444.7256 a | 743.3677 b | 540.4703 c | 284.2069 d | 78.8086 e | 50.5048 f | 43.2407 g | 205.2689 |
| 2nd | 439.1410 a | 740.7777 b | 525.6507 c | 282.6651 d | 76.9429 e | 48.8820 f | 42.8441 f | 202.5211 | |
| 3rd | 442.3663 a | 759.1505 b | 603.0428 c | 299.8642 d | 84.0047 e | 48.2669 f | 41.8648 f | 215.0340 | |
| FPI | 1st | 38.4007 a | 30.9625 b | 13.0511 c | 13.8969 d | 1.7928 e | 1.4609 e | 0.4047 f | 7.9804 |
| 2nd | 37.7167 a | 30.8614 b | 12.5008 c | 13.7108 d | 1.7644 e | 1.3962 e | 0.4006 f | 7.8509 | |
| 3rd | 38.0890 a | 31.8974 b | 14.5849 c | 14.6820 c | 1.9384 d | 1.3800 e | 0.3885 f | 8.3325 | |
| HFLP | 1st | 2.0180·10−1 a | 1.5031·10−1 b | 5.7811·10−2 c | 2.8831·10−2 d | 9.5917·10−3 e | 7.3840·10−4 f | 6.2250·10−4 f | 2.9893·10−2 |
| 2nd | 2.0305·10−1 a | 1.5128·10−1 b | 5.7589·10−2 c | 2.8489·10−2 d | 9.6256·10−3 e | 3.5930·10−4 f | 6.2960·10−4 f | 3.0493·10−2 | |
| 3rd | 2.0536·10−1 a | 1.4992·10−1 b | 5.9475·10−2 c | 2.9232·10−2 d | 9.7861·10−3e | 5.0400·10−4 f | 6.1130·10−4 f | 3.0632·10−2 | |
| HFLBP | 1st | 3.7389·10−4 a | 1.9050·10−4 b | 5.4760·10−5 c | 7.0500·10−6 d | 4.9239·10−7 e | 4.0000·10−8 e | 4.0000·10−8 e | 3.1049·10−5 |
| 2nd | 3.6356·10−4 a | 1.8900·10−4 b | 5.3070·10−5 c | 6.9600·10−6 d | 4.8936·10−7 e | 2.0000·10−8 e | 5.0000·10−8 e | 3.2161·10−5 | |
| 3rd | 3.6356·10−4 a | 1.8900·10−4 b | 5.3070·10−5 c | 6.9600·10−6 d | 4.8936·10−7 e | 2.0000·10−8 e | 5.0000·10−8 e | 3.2164·10−5 |
- Note: Values followed by the same letter along the row mean that subareas are not significantly different from each other according to the Student–Newman–Keuls test (for p = 0.01); all differences between the baseline and the future time steps are significantly different according to the Student–Newman–Keuls test (p = 0.01).
In particular, in the 2011–2040 period the values of BP and FS with respect to the baseline decreased to a slightly higher extent in Sicily and Central, and Northwest Italy, whereas in Sardinia and South Italy the variation was minor. CFL values decreased slightly in this first future period in all subareas. In the 2041–2070 period, Sicily showed the highest increase for BP and FS followed by Central Italy and South Italy; to a much lower extent, BP and FS increased also in Sardinia. On the contrary, BP and average FS decreased in Northwest Italy and Northeast Italy and slightly also in Corsica. The CFL increased slightly in Corsica in this second future period whereas in Northwest Italy, Northeast Italy, and Sardinia it decreased.
As presented in the Material and Methods section, from the primary fire exposure indicators we derived an extended set of indicators (FPI, HFLP, HFLBP) with the aim to summarize the information on fire probability and severity for the entire study area (Figs. 8 and 9). The evolution of FPI throughout the three studied periods is similar to the evolution of BP or FS (Fig. 10). Regarding the HFLP and HFLBP indicators, results showed limited differences between the three studied periods (Fig. 9; Table IV), except for NE in case of HFLBP and NW in both cases where differences are higher in proportion to their values. The highest mean values of FPI, HFLP, and HFLBP were observed in Corsica and Sardinia (Table IV).
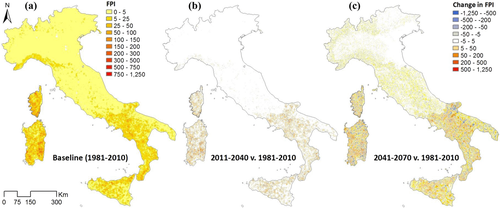


In the 2011–2040 period, FPI decreased in all subareas: in Northwest Italy and Sicily the reduction is higher; in Sardinia the decrease is minor; and in the other subareas it ranges from −1.78 to −1.23%. The changes of this index in the 2041–2070 period are different for each subarea. In this period the value of FPI increases for Sicily, Central Italy, South Italy, and Sardinia and decreases for Northwest Italy, Northeast Italy, and Corsica.
Results provided by ANOVA on all fire exposure indicators (BP, CFL, FS, FPI, HFLP, and HFLBP) have shown that the temporal variations between baseline and future periods were significant for p = 0.01 in all subareas. Regarding the variations among subareas, the results provided by the post hoc Student–Newman–Keuls test showed (Table IV) significant differences (p = 0.01) for all exposure indices except for NW and NE, where FSs predicted for the two future time periods are similar; some significant similarities were observed between NW and CI, regarding HFLP and FPI; similarly, significant similarities were observed between NW and NE, affecting the HFLP.
4. DISCUSSION AND CONCLUSIONS
In this work, we extend our understanding of the potential impact of future climate change on wildfire exposure specifically for the Mediterranean region using a wildfire spread modeling approach. We incorporated projected climate change into a mechanistic wildfire spread modeling system to better represent the effects of fine scale drivers of wildfire propagation on the assessment of climate change impacts. This work is one of the first applications in Europe of a methodology to assess the impacts of climate change on wildfire exposure through a wildfire modeling approach, using both fine resolutions (250 m) and a large assessment scale. Although we used a single climate model rather than an ensemble, the present work contributes methods that can be applied in other areas to analyze different time frames, scenarios, and climate models. The climate projections we used in this study are overall in line with previous works and highlighted an increase in future temperatures and a reduction in precipitation and relative humidity for the entire study area.22-24 This result is also compatible with the conclusions of the fifth IPCC report that forecasted strong warming trends and precipitation decrease in Southern Europe, with marked increase in number of warm days, heat waves, and droughts.21 We also observed a decrease in average wind speed values and in the frequency of days with strong winds in the future periods for the entire study area. According to the fifth IPCC report21 there are uncertainties regarding the projections of future wind speed trends, especially during the summer season.82 However, there is agreement in the decrease of average annual mean wind speed in the study area.82
The analysis of the FWI codes (FFMC and DC) highlighted that the frequencies of the “extreme” fuel moisture categories strongly vary among subareas. In particular, there is a gradient of the “extreme” fuel moisture frequency from south to north the southern subareas being characterized by the highest values. The most relevant variations in FFMC and DC were observed in the 2041–2070 period, and the increase in the frequency of the driest days suggests that the fire seasons will be longer than the baseline. A similar finding for Italy was reported by Bedia et al.,83, 84 who analyzed the future trends in FWI using a multimodel approach considering the SRES-A1B scenario, and observed also a more marked FWI increase in the 2041–2070 period than in the 2011–2040 period. The lengthening in future fire seasons related to the increased frequency of drier days was also highlighted by other studies.16, 27-29, 49, 83
To assess the potential impacts of climate change on wildfire exposure, and to remove possible uncertainties related to future land-use changes and therefore variation in fuel types and characteristics (e.g., load, depth, etc.), the fuel layer was held as constant input for the wildfire simulations of the three periods. For the same reason, we also assumed constant fire ignition numbers, and locations, and we used the historic ignition grids of the period 1990–2008 as a reference for the three study periods.
We observed slight changes in CFL for all periods and for all subareas, primarily because fire intensity is strongly dependent on fuel type, which was held constant. However, climate variations did influence other fire exposure indicators. We found a slight decrease of most of the fire exposure indicators for the first future period and for the entire study area. This was probably related to the decrease in frequency of higher wind speeds. By contrast, in the second future period the values of the fire exposure indicators noticeably increased, probably due to the increase in the frequency of FFMC and DC values associated with extreme conditions. The different trend in the two periods suggests that probably the fuel moisture content is the most important factor for the fire spread in the study area since a decrease in wind speed in the first future period was able to reduce the exposure indices when the dry fuel conditions increase slightly, whereas a decrease of wind speed from the first to second future periods was not able to counteract the increase of extremely dry fuel conditions. However, there was a high variability among responses in subareas, and, for instance, the slight increase in the exposure indices in Sardinia in the second future period (2041–2070) and the decreasing trend in Corsica, Northwest Italy, and Northeast Italy, confirm that in these regions wind does play a key role. Similar results were provided by Arca et al.,49 who studied the fire danger variations in Sardinia using the MTT algorithm and climate data provided by the regional climate model EBU-POM for the IPPC A1B emission scenario. This study showed for the 2071–2100 period an increase in the burn probability associated with an overall increase of the frequency of potential days with extreme fires as measured by the number of days with high values of FWI. Similarly, Kalabokidis et al.51 combined simulations with climate projections from the SRES A1B scenario, in this case derived from simulations of the KNMI regional climate model RACMO2 in Messinia (Greece). They also observed an increase in burn probability at the end of the 21st century.
The differences among subareas are significant for most of the fire exposure indicators. In fact, southern areas and islands showed the highest values for fire exposure variables while northern areas showed the lowest in both present and future periods. These differences were notable even if we used a fixed burn period for all subareas and the number of ignitions was proportional to the size of the study area. Therefore, differences in the fire exposure indicators among subareas are exclusively due to differences in fuel types, fuel moisture, and wind, which are strongly determined by climate conditions.
In conclusion, fire modeling outputs projected an increase in wildfire incidence due to climate change that may lead to several threats in the future. For instance, an increase in greenhouse gas emissions is expected, which in turn favors climate warming.85-87 Moreover, increasing wildfires might cause substantial changes in the existing vegetation composition and distribution or even desertification of some areas and probably a subsequent erosion.88-90 Many Mediterranean plants are adapted to cope with fire, but some Mediterranean ecosystems may be strongly affected by wildfires.86 However, damages in highly valued resources and assets, and human casualties, are the most relevant concern.
The main strategy to prevent or minimize future wildfire damages in the Mediterranean basin will be the fuel load reduction and forest management by traditional silvicultural techniques or by alternative solutions.87, 91-95 This approach requires the identification of major concern areas to prioritize interventions. For this purpose, the outputs from our work can be used as a baseline to support the decision-making process, aiming at fire management planning and risk mitigation activities. Furthermore, the outputs we obtained can be useful to prioritize specific areas of interest taking into account the affected values, the potential fire behavior or the burn probability, or the landscape physical constraints. This may be done combining GIS analysis and fire exposure maps as key information to plan and evaluate the fuel and fire management activities. Innovative tools, modules, and software developed in recent years might also be coupled to fire exposure maps in supporting fire and land managers.96, 72 Further research is now needed to assess how future changes in land cover and ignition patterns will also contribute to increased fire exposure and risk, and how risk governance systems will adapt to the projected future fire regimes.
ACKNOWLEDGMENTS
This work was partially funded by the FUME Project (FP7/2007–2013, Grant Agreement 243888), by the GEMINA Project - MIUR/MATTM n. 232/2011, and by the Project “Modeling approach to evaluate fire risk and mitigation planning actions” (P.O.R. SARDEGNA F.S.E. 2007-2013, Asse IV Capitale umano, Linea di Attività l.3.1). We are grateful to the Join Research Centre for providing the fire database.


