Threshold of lugworm (Arenicola marina) densities for successful transplantation of eelgrass (Zostera marina)
Author contributions: All authors conceived and designed the research; TLB, RCS, TL performed fieldwork; TLB analyzed the data; all authors wrote and edited the manuscript.
Abstract
The global decline of seagrasses has prompted numerous restoration efforts. However, these efforts are challenged by ecological feedbacks and the prevalence of stressors. This study investigated the effects of lugworms (Arenicola marina) in a large-scale eelgrass (Zostera marina) transplanted area. Shoot densities of eelgrass transplants were monitored at a high temporal resolution at specific sites with naturally varying degrees of A. marina density. Arenicola marina density effects and threshold limits on eelgrass net shoot production (performance) were estimated based on shoot counts, revealing a sharp decline in transplant performance with increasing A. marina densities. Transplant performance was negatively impacted even at low A. marina densities, with a threshold of 29 ind. m−2 (22–42 ind. m−2, 95% CI). Transplanted eelgrass performance displayed a high within-site (10–100 m) variation due to the heterogenic spatial distribution of A. marina, suggesting that actively targeting areas with low A. marina densities can improve transplantation success. Monitoring A. marina fecal cast densities proved to be an effective proxy of the negative impact from sediment reworking caused by A. marina's feeding strategy on eelgrass transplants and is an important parameter to consider during site-selection procedures before restoring eelgrass.
Implications for Practice
- Lugworm presence influences eelgrass transplantation performance negatively, even at low densities, and should preferably be avoided.
- Some lugworm presence can be tolerated with a threshold of 29 ind. m−2 (22–42 ind. m−2, 95% CI).
- Heterogenic spatial distribution (10–100 m scale) of lugworms can result in large within-site variability of transplant performance. Therefore, targeting areas with a low lugworm density within these scales can improve transplantation success.
- The colonization of lugworms in former eelgrass habitats that are now bare bottom habitats can limit the potential area available for eelgrass restoration.
Introduction
Seagrass meadows have been drastically reduced in areal extent worldwide due to the impact of anthropogenic stressors (Waycott et al. 2009; Flindt et al. 2024). Seagrasses provide multiple ecosystem functions (Orth et al. 2020; Lange et al. 2022; Steinfurth et al. 2022), and its reestablishment is therefore essential to maintaining those functions. Natural recolonization at many locations is slow or lacking (Valdemarsen et al. 2010, 2011; Moksnes et al. 2018) despite the reduction in nutrient discharge and other stressors related to initial seagrass losses (Carstensen et al. 2012; Riemann et al. 2016). Consequently, active restoration efforts have been implemented at multiple sites to support seagrass recovery (Orth et al. 2020; Govers et al. 2022; Lange et al. 2022). Nevertheless, stressors and ecological feedbacks challenge restoration efforts (Flindt et al. 2016; Cronau et al. 2023; Unsworth et al. 2024). Identifying the most relevant stressors and their thresholds is essential to improving restoration success by refining site selection.
Both eelgrass (Zostera marina) and lugworms (Arenicola marina) are considered ecosystem engineers: they display self-facilitating feedbacks and will exclude each other when either of them occurs in high density and rarely exhibit a stable state of co-occurrence (Philippart 1994; Valdemarsen et al. 2011; Suykerbuyk et al. 2012). The dense rhizosphere of seagrass meadows such as Z. marina prevents the formation of burrows and physically excludes large bioturbators (Berkenbusch et al. 2007; Eklof et al. 2015; Oncken et al. 2022), while the immense bioturbation caused by feeding A. marina excludes seagrasses by burying or uprooting shoots or seeds (Valdemarsen et al. 2011; Suykerbuyk et al. 2012; Cronau et al. 2023). Arenicola marina bioturbation is highly effective and can potentially mix sediment to a depth of 40 cm (Kristensen et al. 2012) with sediment reworking rates in the range 1–40 cm year−1, dependent on density (Riisgård & Banta 1998; Valdemarsen et al. 2011).
Arenicola marina presence impairs the survival of shoots through uprooting, burial by fecal casts, or by trapping and burial in the feeding funnels (Valdemarsen et al. 2011; Sousa et al. 2017). Previous studies suggest that both dwarf eelgrass (Zostera noltii) and Z. marina have a low resilience to burial. Zostera noltii is especially affected by burial due to its short leaves, with 2–4 cm burial resulting in >50% mortality (Cabaco & Santos 2007; Han et al. 2012). Long-leaved phenotypes of Z. marina exhibit drastically increased mortality when buried deeper than 10 cm (Munkes et al. 2015), while short-leaved phenotypes already exhibit mortality of >50% at 4 cm sediment burial (Mills & Fonseca 2003).
Arenicola marina has a high colonization potential (Flach & Beukema 1994) and quickly invades formerly vegetated areas (Valdemarsen et al. 2011). In Odense Fjord, Denmark, areas formerly covered by Z. marina are inhabited by A. marina in densities of 1–8 ind. m−2, with some areas having up to 80 ind. m−2 (Valdemarsen et al. 2011). A model study on the same fjord incorporating multiple stressors found that A. marina combined with wave action and resuspension from drifting macroalgae drastically limited Z. marina recolonization (Kuusemäe et al. 2016). The same study found similar impacts in another Danish estuary, Roskilde Fjord, highlighting the potential for A. marina presence to limit recolonization of Z. marina.
Experience from active Z. marina and Z. noltii restoration projects using seeds or adult transplants has highlighted A. marina as a limiting stressor (Suykerbuyk et al. 2012; Costa et al. 2022; Cronau et al. 2023). Even so, to our knowledge, no density threshold has been identified for screening potential transplant sites. In this study, we investigated the effects of varying A. marina densities on the net shoot production (Performance) of Z. marina transplants through high-temporal monitoring of a large-scale transplantation. Within the transplanted area, A. marina naturally occurred in varying densities, which was used to estimate density effects and threshold limits of successful Z. marina transplantation.
Methods
Study Site
The experiment was conducted in the Danish Estuary, Vejle Fjord. The estuary is West–East facing with a mean depth of 8.3 m, a length of 22 km, a surface area of 109 km2, and is micro-tidal with a tidal amplitude of ±0.5 m. The fjord is affected by eutrophication, but substantial reductions in nutrient load have been achieved from a mean annual load in 1989–1995 of 2,303 ton N year−1 (Skop & Sorensen 1998) to a current load of 930 ton N year−1 (Miljoeministeriet 2023). Even so, the ecological status according to the European Union Water Framework Directive is classified as bad in the inner and poor in the outer part of the estuary (Miljoegis 2024, Danish Environmental Protection Agency). This nutrient reduction has made it possible to successfully restore shallow eelgrass meadows due to improved light availability and reduced epiphytic biomass. However, proper site selection to identify suitable locations for restoration is still required (Flindt et al. 2024).
The study was conducted at the southern shore in the mid-section of the fjord at Sellerup Strand (55.686881°N, 9.679913°E) as part of a large-scale marine restoration project. Between 2019 and 2024, 3.7 ha of eelgrass was transplanted at the study site, Sellerup Strand (Fig. 1). The restored area is 1.0–1.8 m deep at mean sea level and is characterized by sandy sediments.

Transplantation and Experimental Design
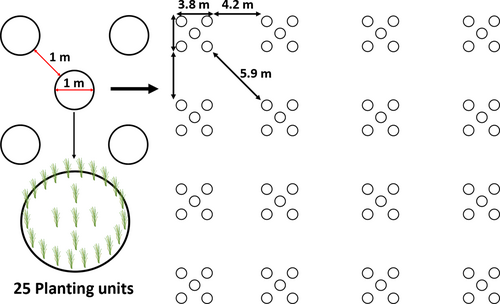
The experimental setup was integrated as part of the monitoring program of the large-scale Z. marina transplants established in 2020 (Fig. 1). A team of freedivers planted all shoots using a variation of the horizontal shoot method (Davis & Short 1997), which has been successfully used throughout the restoration project in Vejle Fjord and at other locations in Denmark (Lange et al. 2022; Flindt et al. 2024). Shoots were harvested from a donor meadow within the fjord (5 km distance) using garden rakes to remove 30 × 30 cm sections of the meadow, which were separated into individual planting units (PUs) consisting of an apical shoot, with 0–2 small lateral shoots. Shoots with rhizomes <4 cm were discarded. Each individual apical shoot was attached to an iron nail (5 g, 80 × 31 mm) with iron wire (0.5 mm thick) as anchorage and shortly thereafter transplanted in pre-defined patterns (Fig. 2).

The transplant pattern was designed as circular (⌀ = 1 m) transplant groups (TGs) consisting of 25 PUs, with 20 PUs divided evenly along the outer edge and 5 planted in the middle (Fig. 2). The TGs were further grouped in clusters of five, which were spread out evenly in a checkerboard pattern (Fig. 2). This design was chosen following: (1) PUs are evenly distributed within each TG and form a small self-protecting eelgrass patch within one to two growth seasons with shoot densities similar to natural meadows within two to three growth seasons; (2) the circular structure of each TG mimics the radial growth pattern of naturally occurring meadows; and (3) sequential levels of interspacing between TGs and transplant clusters allow the formation of resilient patches as TGs expand and connect through vegetative radial growth, while concurrently keeping the number of PUs and labor intensity at a minimum.
Monitoring
Three subplots (Fig. 1, St. 1 to St. 3) within the large-scale transplantation area were chosen to be monitored at a high temporal resolution. The distance between subplots was a maximum of 130 m, and they were subjected to similar depth, light, hydrodynamic exposure, and nutrient-derived stressors (epiphytes, opportunistic macroalgae). Each subplot consisted of 4 × 4 transplant clusters of 125 PUs (Fig. 2). In each subplot, 12 TGs were selected and treated as individual replicates. The replicates were chosen semi-randomly along a diagonal within each subplot and marked with a cable tie embedded in the sediment, ensuring they could be individually identified throughout the study period. A HOBO U26 Dissolved Oxygen Data logger concurrently measuring temperature was placed near subplot St. 3 to identify potential stress related to hypoxic events.
Monitoring of shoot counts started from the time of transplantation in June 2020 and continued throughout the following year. Initial shoot mortality and growth stagnation are common immediately after transplantation, irrespective of stressor levels (Lange et al. 2022; Flindt et al. 2024). Therefore, a period of acclimatization of 6 weeks was applied before monitoring of A. marina densities was initiated. During the growth season, monitoring was conducted bi-weekly to monthly until October, and afterward, the monitoring frequency was reduced to measurements in December, March, and April. During monitoring, a circular quadrat (⌀ = 1 m) was used to monitor the density of shoots and A. marina fecal casts, hereafter referred to as “A. marina density.”
Transplant Performance and Regression Analysis
Sediment Analysis
Sediment analysis was conducted at each subplot to confirm that sediment conditions did not vary and that variations in transplant performance were primarily controlled by A. marina presence. Sediment samples were taken using acrylic core-liners (diameter: 5.2 cm) in November 2020. Samples were analyzed for median grain size and percent silt, clay, and particulate organic matter particles (particle fraction <63 μm). Cores were sampled in triplicate and sliced in the sections 0–1, 1–2, 2–5, 5–10, and 10–15 cm and analyzed using a Malvern Mastersizer 3,000 Particle Size Analyzer.
Statistics
Statistics were performed in the software SigmaPlot 12.5 and tested with an α level of 0.05. The normal distribution of transplant performance and weighted average A. marina density across replicates was tested using Shapiro–Wilk's normality test. The weighted average density of A. marina failed the normality test. As a result, the non-parametric Spearman rank-order correlation was used to test for correlation between transplant performance and weighted average A. marina density.
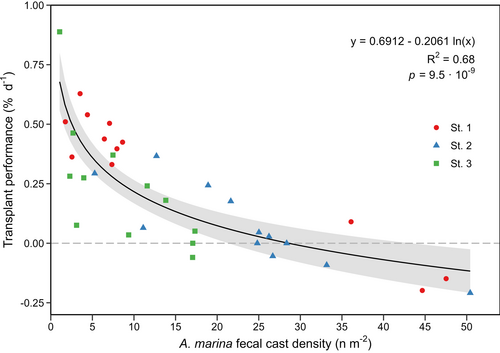
Regression analysis between transplant performance (% day−1) and weighted average A. marina density was performed using a “best-fit” approach using the R2 value to choose the regression model. Logarithmic regression displayed the highest R2 value corresponding well with this type of data, where the change in transplant performance decreases as the number of A. marina increases. The threshold density of A. marina was determined as the regression curve intercept with zero, which describes the threshold between negative and positive transplant performance.
Results
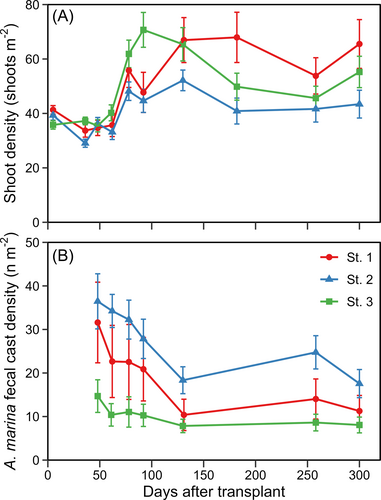
Shoot densities decreased or stagnated the first 60 days following transplantation, after which shoot densities increased in all subplots (Fig. 3A). Shoot densities peaked in the fall 90–130 days after transplantation, after which growth stagnated, or shoot densities decreased during the winter period 130–260 days following transplantation. The density of A. marina was highest initially after transplantation and declined throughout the study period. On average, the A. marina density was highest in subplot St. 2 and lowest in St. 3 (Fig. 3B). Long-term temporal monitoring revealed that shoot densities continued to increase, and 3 years after transplantation, they reached densities like that of natural meadows (Fig. S1).

All subplots were similar in sediment conditions with sandy sediments with a median grain size of 216–284 μm in the top 5 cm, and a low silt/clay fraction of 2–4.7% (Fig. S2). Oxygen levels were generally high throughout the study period with short periods of hypoxia. From July to December 2020, a total of 40.8 hours of moderate hypoxia (<4 mg O2 L−1) and 1 hour of severe hypoxia (<2 mg O2 L−1) were recorded, with the longest consecutive period of sustained moderate hypoxia being 10.7 hours (Fig. S3).
Transplant performance (% day−1) was significantly correlated with the weighted average A. marina density (fecal casts m−2) (Fig. 4). According to the logarithmic regression analysis, A. marina densities explained 68% of the variance in transplant performance. Transplant performance sharply decreased with increasing A. marina density, with a threshold of 29 A. marina m−2 (22–42 A. marina m−2, 95% CI). Transplant performance became negative at A. marina densities above this threshold. The density of A. marina varied considerably between replicates, even within the individual subplots. The subplot St. 1 displayed the highest variation with average densities in the interval 1.8–47.5 A. marina m−2 (Fig. 4).

Discussion
The study confirms that the presence of A. marina in formerly vegetated areas can limit Z. marina transplant success. Transplant performance during the first year was significantly affected by A. marina density. Transplant performance sharply decreased with increasing A. marina densities, demonstrating that even low densities of <5 ind. m−2 negatively impact performance. Similarly, low densities of A. marina have been shown to reduce seedling recruitment drastically in restoration trials employing seed-based methods (Cronau et al. 2023). In our study, the density threshold of A. marina could be identified as 29 ind. m−2, indicating that when transplanting adult plants, some A. marina presence can be tolerated but should preferentially be avoided at those densities. Further, this study demonstrated a large within-site performance variability due to the A. marina spatial distribution heterogeneity, often found at these scales (Boldina & Beninger 2014). When A. marina is the main limiting stressor, the identified A. marina density threshold can guide targeting of the most suitable sites, even on small scales of 10–100 m, thereby increasing the likelihood of transplant success.
Restoration projects are typically more successful when robust site selection procedures are used (Flindt et al. 2016, 2024; Preston et al. 2021), making the best use of available funds. Habitat suitability assessment relies on knowledge of stressors (Flindt et al. 2016; Preston et al. 2021) and an ability to adequately identify their thresholds. This study demonstrates that A. marina fecal cast densities are an effective proxy to estimate the impacts of bioturbation before undertaking restoration efforts. However, it should be expected that the density of fecal casts, on average, underestimates the actual density of A. marina by ~6%, as a fraction of A. marina are inactive and fecal casts are absent (Farke et al. 1979; Flach & Beukema 1994). In practicality, underestimation using fecal casts makes no difference, as both the threshold and applied field measurements for restoration would rely on fecal cast counts to make estimates in a nondestructive and effective manner.
In natural systems, multiple stressors concurrently affect seagrass (Salo & Pedersen 2014; Flindt et al. 2016; Moreno-Marín et al. 2018) and can act either additively or synergistically (Salo & Pedersen 2014; Moreno-Marín et al. 2018). Consequently, a shift in the threshold of individual stressors will likely occur as the number of additional stressors or their intensity increases or decreases. Environmental parameters like depth, light, hydrodynamic exposure, and nutrient-derived stressors were similar across subplots at this study site. This allowed precise estimation of the A. marina threshold as it was the main variance between replicates. At the study site, eutrophication has resulted in nutrient-derived stressors, including increased growth of epiphytes and opportunistic macroalgae, which increase light limitation through shading (Brush & Nixon 2002; Rasmussen et al. 2012; Brodersen et al. 2015). While nutrient-derived stressors were present, the sandy sediment conditions were ideal, oxygen limitation was minimal, and given that the study site is within an estuary, the hydrodynamic exposure was low compared to more open coastlines. Combined, this suggests that this study's A. marina threshold of 29 ind. m−2 reflects an intermediate stressor level. The identified threshold corresponds remarkably with the findings of Oncken et al. (2022), which showed Z. marina was excluded at A. marina densities exceeding 30 ind. m−2. However, the same study also identified an area with a higher threshold of 70 ind. m−2, likely due to fewer accumulated stressors negatively impacting the growth of Z. marina at that location (Oncken et al. 2022).
Engineering solutions like embedding jute and coconut membranes (Sousa et al. 2017; Costa et al. 2022) or shell layers (Suykerbuyk et al. 2012) in the sediment have proved effective in remediating the bioturbation effects of A. marina. Nevertheless, such approaches are cumbersome and add additional costs to restoration activities. Hence, they should only be employed when surpassing the limiting threshold of Z. marina establishment and where alternative restoration sites are unavailable. Alternatively, such engineering solutions can function as tools to establish a few small seed-producing patches, which serve as a foundation for further natural bed development once allowed by the environmental conditions (Sousa et al. 2017). Another option would be to target years with low A. marina densities. Accordingly, in some years, sites relevant for restoration could naturally have A. marina densities below the threshold limit and favorable conditions for Z. marina transplantation.
Reworking activities by A. marina display a non-linear size effect with larger worms reworking sediment with increased intensity relative to their biomass (Valdemarsen et al. 2011). This study did not account for the size of individual A. marina; therefore, the threshold represents a mixture of different size classes and includes seasonal variation in size distribution. When evaluating the restoration potential, the size distribution of A. marina should be considered, as few large adult individuals can exert the same stress equivalence of multiple juveniles. Further, post-larval settling events of A. marina usually occur during spring (Farke & Berghuis 1979) skewing the local size distribution towards small individuals. Similarly, during the course of the year, this size distribution shifts towards larger individuals as juveniles grow and the number of small individuals decreases, shifting the bioturbation intensity and the threshold relative to the density.
Acknowledgments
We thank the Velux Foundation for funding this project in relation to the Danish marine restoration project Sund Vejle Fjord (grant number 29719). We also thank the laboratory technicians in the ecology group at SDU for their help with sediment analyses and scientific assistant Anders Barnewitz for his aid in designing the layout of the presented figures. A special thanks to our project partners from Vejle Municipality, Klaus Elmer Balleby, Mads Fjeldsø Christensen, and Brit Dalby, for their collaboration and invaluable work in making the restoration project successful.


