The sound of restored soil: using ecoacoustics to measure soil biodiversity in a temperate forest restoration context
Author contributions: JMR, CA conceived and designed the study; JMR, CA undertook the fieldwork; JMR did the formal data analysis and produced the visualisations; JMR wrote the original manuscript; JMR, CA, MFB contributed to editing the manuscript; JMR, CA, MFB reviewed the manuscript.
Abstract
Forest restoration requires monitoring to assess above- and belowground communities, which is challenging due to practical and resource limitations. Ecological acoustic survey methods––also known as “ecoacoustics”––are increasingly available and provide a rapid, effective, and non-intrusive means of monitoring biodiversity. Aboveground ecoacoustics is widespread, but soil ecoacoustics has yet to be utilized in restoration despite its demonstrable effectiveness at detecting soniferous soil meso- and macrofauna. This study applied ecoacoustic tools and indices (Acoustic Complexity Index, Normalized Difference Soundscape Index, and Bioacoustic Index) to measure belowground (and aboveground as secondary) biodiversity in a forest restoration site spanning two age classes. We collected n = 198 belowground acoustic samples and n = 180 aboveground samples from three recently deforested (felled <3 years ago) and three deciduous forest plots undergoing restoration (for the last 30–51 years) across three monthly visits in South Yorkshire, U.K. We used a belowground sampling device and sound-attenuation chamber to record soil communities and passive acoustic monitoring to record aboveground sounds. We found that restored plot acoustic complexity and diversity were significantly higher than deforested plots in the sound-attenuation chamber, but there were no inter-plot differences in in-situ soil or aboveground samples. We also found that restored plots had a significantly greater high-frequency to low-frequency ratio (suggesting higher biophony to anthrophony ratios) for in-situ and sound chamber soil but no association for aboveground samples. Our results suggest that ecoacoustics has immense potential to monitor belowground biodiversity, adding to the restoration ecologist's toolkit and supporting global ecosystem recovery.
Implications for Practice
- Soil ecoacoustics has the potential to support restoration ecology/biodiversity assessments, providing a minimally intrusive, cost-effective and rapid surveying and monitoring tool. The methods are also relatively simple to learn and apply.
- Ecoacoustics can contribute towards overcoming the profound challenge of quantifying the effectiveness (i.e. success) of forest restoration interventions in reinstating target species, functions and so-called “services” of soil biota, and reducing disturbance.
- Restoration researchers and practitioners should use this study as a stepping stone towards more comprehensive studies and practical applications, using our identified strengths and limitations to enhance soil ecoacoustics methodologies for biodiversity monitoring.
Introduction
In the absence of large-scale ecosystem restoration and effective monitoring strategies, 95% of the Earth's land, including forest ecosystems, is projected to be degraded by 2050 (Yu et al. 2020). The integrity of forests depends on a rich tapestry of biodiversity (Müller 2000; Watson et al. 2018), and the strength and complexity of the relationships between organisms confer resilience to forest ecosystems. Microscopic organisms or “microbiota” provide forest trees with nutrients and the ability to communicate via mycorrhizae (Simard 2018; Robinson et al. 2021a, 2021b), and soil meso- and macrofauna contribute to soil formation and energy flows (Le Bayon et al. 2021).
A profound challenge in forest restoration is quantifying the effectiveness (i.e. success) of forest restoration interventions in reinstating target species, functions and “services” (Camarretta et al. 2020), and reducing further disturbance. Indeed, ecosystem restoration can be viewed as a continuum of stages from planning to implementation to monitoring (Robinson et al. 2022). The monitoring stage plays a crucial role in quantifying the effectiveness of restoration interventions by measuring recovery and potential ongoing disturbance (de Almeida et al. 2020). Primary observations and derived measurements of changes in biodiversity status are considered fundamental to monitoring the effectiveness of restoration strategies (Breed et al. 2019; Hansen et al. 2021). This is exemplified by GEO BON Essential Biodiversity Variables, which provide the first level of abstraction between low-level observations and high-level indicators of biodiversity (Kissling et al. 2018). However, acquiring these Essential Biodiversity Variables, which include genetic composition, species populations, species traits, community composition, ecosystem functioning and ecosystem structure (O'Connor et al. 2020), via traditional survey methods (such as extensive vegetation surveys, animal tracking, physicochemical analysis, pitfall traps and flotation for soil invertebrate counting) can be time and resource-intensive and potentially intrusive (Gollan et al. 2013).
Due to these constraints, forest restoration data are often limited to visible macro-organisms, particularly the trees and other floral and faunal assemblages aboveground (Stoddard et al. 2011; Williams-Linera et al. 2021). Moreover, ecological data are often ambiguous and, therefore, incompatible with further research (Zipkin et al. 2021). Ecological acoustic survey methods, also known as “ecoacoustics,” have become increasingly available (Abrahams et al. 2021; Müller et al. 2022). They can provide effective and non-invasive approaches to gathering biodiversity data, for example, on target species, assemblages and environmental variables essential to restoration monitoring (Teixeira et al. 2019; Stowell & Sueur 2020; Greenhalgh et al. 2021). In recent years, ecoacoustics has been applied to monitor elusive species in several environmental contexts––particularly in conservation biology (Teixeira et al. 2019; Greenhalgh et al. 2020; Stowell & Sueur 2020). For instance, passive acoustic monitoring (often shortened to “PAM”), which involves deploying autonomous acoustic sensors, has been used to collect recordings of biological sounds (known as “biophony”) from bats (Hintze et al. 2021; López-Baucells et al. 2021), birds (Abrahams 2019; Abrahams & Geary 2020), and invertebrates (Harvey et al. 2011; van der Mescht et al. 2021; Mankin 2022) in terrestrial environments; and cetaceans (Jones et al. 2020; Guidi et al. 2021), amphibians (Gan et al. 2020), crustaceans (Kühn et al. 2022), and fish (Popper & Hawkins 2019) in aquatic environments. Indeed, ecoacoustics has emerged as an efficient tool to measure and monitor biodiversity and has the potential to enhance the toolbox of restoration ecologists, as demonstrated by preliminary studies of aquatic and terrestrial restoration projects (Greenhalgh et al. 2021; Znidersic & Watson 2022). Moreover, the same audio recording devices can detect anthropogenic noise (known as “anthrophony”) (de Framond & Brumm 2022). Anthrophony may contribute to ecosystem degradation by adversely affecting animal fitness, health (De Jong et al. 2018; Kleist et al. 2018) and behavior (Tidau & Briffa 2019; Hastie et al. 2021), and the composition and functionality of microbial communities (Robinson et al. 2021a, 2021b). Therefore, ecoacoustics could provide important measurements across the degradation–restoration continuum.
The importance of obtaining verifiable, standardized data for long-term restoration monitoring cannot be overstated. Despite the potential of ecoacoustics to contribute to forest restoration monitoring, few studies have deployed this technology to assess aboveground faunal soundscapes in a forest restoration context (Turner et al. 2018; Vega-Hidalgo et al. 2021). Moreover, to our knowledge, no studies have applied ecoacoustics to measure or monitor belowground biodiversity in a restoration context. This is despite its demonstrable effectiveness at detecting soil meso- and macrofauna acoustic signals in other settings, such as agriculture (Maeder et al. 2019), silviculture (Maeder et al. 2022), and in controlled chambers (Lacoste et al. 2018). The agriculture and silviculture studies correlated their soundscapes with soil biotic communities comprising several taxonomic orders, including Haplotaxidia (earthworms), Coleoptera (beetles) and Aranea (spiders), and the Lacoste et al. (2018) study specifically focused on the sounds emitted by earthworms. Soil is foundational to most terrestrial ecosystems, providing a medium for plant growth, regulating climate, cycling nutrients and providing habitat for millions of soil organisms (Delgado-Baquerizo et al. 2020). Around 25% of everything alive on Earth lives in this subterranean environment (Bach et al. 2020). Soil erosion, contamination, compaction and loss of organic matter are major threats to soil ecosystems worldwide. Therefore, effective and efficient new methods to monitor soil ecology are highly sought after.
Here we apply novel ecoacoustics devices to measure belowground biodiversity (and aboveground as secondary) in a U.K. temperate forest restoration site, using a range of acoustic indices to analyze the recordings, including the Acoustic Complexity Index (ACI) (Pieretti et al. 2011), Normalized Difference Soundscape Index (NDSI) (Kasten et al. 2012), and Bioacoustic Index (BI) (Boelman et al. 2007). Acoustic indices have important benefits in terms of data processing, but also some limitations, for example, in their effectiveness at quantifying alpha diversity (Alcocer et al. 2022). However, they do provide useful measures of the acoustic characteristics in a sound recording and have demonstrable efficiency as proxies for soil biodiversity (Maeder et al. 2022).
- Acoustic complexity/diversity will be higher in restored plots (30–50 years since restoration), compared with deforested plots (0–10 years since clearing without any active restoration intervention), in both soil and ambient recordings.
- The high-frequency to low-frequency ratio (an amended version of the Bioacoustic Index) will be higher in restored plots than in deforested plots. This would indicate lower noise disturbance in the restored plots, based on the assumption that high-frequency sounds are more representative of biophony than low-frequency anthrophony resulting from mechanical noise and ground vibrations.
- Soil acoustic diversity will positively correlate with invertebrate abundance and richness, with higher scores in the restored plots.
Methods
Study Location
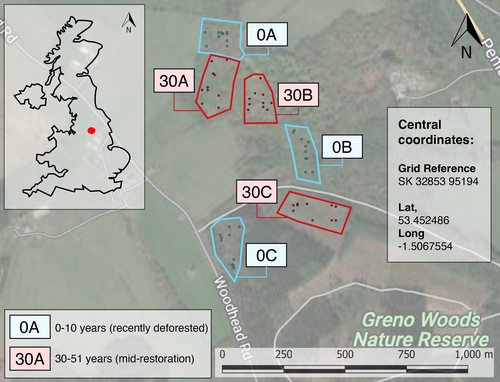
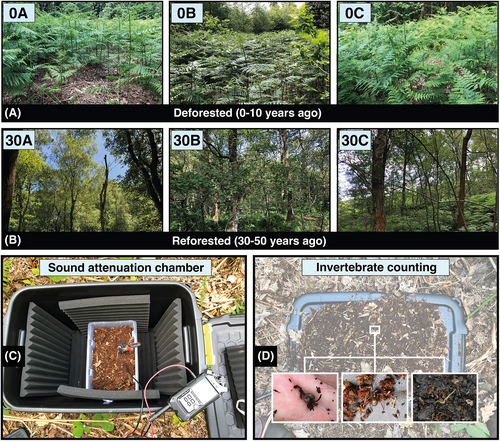
Greno Woods is a large forest (169 ha) near Sheffield in South Yorkshire, U.K. (Fig. 1). The forest comprises several restoration age classes. Due to comparator site availability constraints, samples were collected from two age classes: 0–3 years since deforestation and no active restoration interventions since (referred to in this study as “deforested”); and 31–50 years since active restoration in the form of tree planting (referred to in this study as “restored”). We identified three spatially independent replicate plots (at a minimum intra-treatment plot distance of 50 m apart) for sampling each age class (0A, 0B, 0C, and 30A, 30B, 30C; Figs. 1, 2A & 2B). The habitat classification of all restored sampling plots was semi-natural broadleaved woodland of the W16 National Vegetation Classification (NVC) (Rodwell 2006). This vegetation classification system is a common standard in Britain, used to comprehensively classify plant communities based on their species composition. The species listed in the next two sentences are characteristic of the NVC W16 classification. The deforested plots were dominated by bracken Pteridium aquilinum, with occasional silver birch Betula pendula saplings. The restored plots were dominated by English oak Quercus robur, sessile oak Q. petraea, silver birch and rowan Sorbus aucuparia, with a well-developed understorey of bilberry Vaccinium myrtillus, bramble Rubus fruticosus agg., holly Ilex aquifolium, and bracken. Weather conditions were warm and dry, with a low windspeed on all sampling days (see Table S1 for more details). The soils on site are derived from the Grenoside sandstone. The soils are mostly thin, well-drained, acidic podzols which are indicative of the NVC W16 distribution. The site's topography is typified by moderately steep south and east-facing slopes covered by mature trees. Most of the woodland is free-draining, although water does collect to form “boggy” ground in areas with clay soil deposits––however, this was not noticeable in our study plots.
Soundscape Sampling
We standardized the sampling of the soundscape to occur between 10:00 hours and 16:00 hours in a randomly generated order. We used a relatively inexpensive ecoacoustics sampling device (<£300 for the sound recording system) for belowground sampling: a JrF C-Series Pro contact microphone sensor (manufacturer: www.jezrileyfrench.co.uk; Yorkshire, U.K.) with a 2 m cable and a 1/4″ Neutrik jack. The C-series contact microphones provide a broad frequency response, with good low-end and mid-frequency range, optimal for recording belowground soundscapes (Maeder et al. 2019; Gamal et al. 2020). The JrF microphone was attached to a metal probe, and linked to a handheld acoustic recording device (Zoom H4n Pro; Designed by ZOOM, Japan; Photos S1 and S2) prior to inserting the probe into the soil at a depth of 10 cm (Maeder et al. 2022; Fig. S3). We recorded Waveform Audio Format (.WAV) sound files at 16-bit depth and with a sampling rate of 48 kHz, which is a common rate used in ecoacoustics research (Abrahams 2019), capturing sounds to a maximum of 24 kHz and therefore covering the entire audible range (Maeder et al. 2022). The auto-record setting on the Zoom H4n was switched off, and the gain was set to +50 dB. Each recording followed a separate probe insertion into the soil. To control for initial geophony (e.g. displaced soil particles) and potential disturbance to biophony from the physical disturbance of entering the soil, recordings always followed an initial 30 seconds resting period. To record aboveground (ambient) sound––for instance, soniferous species such as birds––we installed a Tascam DR-100MKII (Tascam, Sant Fe Spring, California) audio recording device onto a tripod in each plot, using its inbuilt omnidirectional microphones to record sounds with the same file format, sampling rate and gain settings.
We selected belowground acoustic sampling locations using a geographical information system (GIS). We created polygon boundary shapefiles around each of the six sampling plots and generated 10 random sampling points for each plot using the random points algorithm in QGIS (version 3.24.3 “Tisler”). The study plots were all between 1.4 and 1.7 ha in size. Belowground sound samples were collected from the predetermined random points within each plot. We repeated the sampling on three occasions across 3 months (June, July, and August) in the summer of 2022 (Table S1).
To determine the appropriate sampling duration for belowground samples, we first ran a pilot study, testing the potential saturation and decay of acoustic indices using different sampling durations (20 seconds, 1 minute, 3 minutes, and 5 minutes). The sampling durations were randomized and collected over two visits (n = 14 per sampling duration). Each recording followed a separate probe insertion into the soil and included the 30 seconds resting period listed above to represent the main study approach. We also controlled for higher frequency anthrophony by setting a low-pass filter to 2 kHz during analysis. This testing process identified a sampling duration of 3 minutes as optimal. There was no significant effect of time post-3 minutes (i.e. 3 minutes vs. 5 minutes) on acoustic complexity (t = 1.7–2.1; p = 0.48–0.64) (Fig. S1). It is possible that sampling in the morning compared with the evening would return different results. However, the sampling for the pilot study was conducted in the early afternoon (between 12:00 hours and 14:00 hours), which falls in the middle of the sampling time window in our study to reduce the effects of this potential limitation.
Following the pilot study, we collected data for the main part of the study. During the three sampling occasions, we set the Tascam DR-100MKIII to record aboveground soundscape samples at each plot. We then recorded the 3 minutes belowground samples (n = 10) in each plot. In total, we collected n = 180 belowground samples (3 minutes each) and n = 18 aboveground samples. The aboveground recordings were post-processed by being divided into 3 minutes sections to simultaneously match the belowground recordings (n = 180 subsamples).
Sound Attenuation Chamber
Recording acoustic samples in the field may capture sounds from variable detection spaces. Therefore, the data acquired may not be comparable between sampling sites (Darras et al. 2016). To address this issue, we standardized the soil volume and, thus, acoustic detection space across treatments using excavated soil samples to record the soil soundscape in each plot in a standardized manner. This involved collecting soil samples from a random point in the plot (determined using a digital number randomiser), filling a 3 L plastic container and placing this into a sound-attenuation chamber, allowing us to record a “snapshot” of the soundscape under controlled conditions (Fig. 2C). We used the same recording equipment for the in situ (i.e. the source location of the soil) and sound-attenuation chamber samples. In total, we collected n = 18 chamber samples (3 minutes each). To determine the optimal sound-attenuation chamber design, we first ran a pilot study using different sound barrier configurations (Fig. S2). The final design comprised a 60 L plastic chamber, with sound-attenuation foam installed on each internal wall, including the base and lid (Fig. 2C).
Invertebrate Counts
We recorded the abundance and richness of meso- and macrofauna in the soil by using the soil collected for the 3 L sound attenuation chamber tests. Once these tests were conducted, we counted the invertebrates by tipping the soil from the 3 L container onto the sound-attenuation chamber lid (Fig. 2D) and then systematically searched through the soil, working from left-to-right and carefully displacing soil particles, thereby revealing the invertebrates (Stroud 2019). The invertebrates were photographed and recorded in a spreadsheet on-site. Invertebrates that were not identified on-site were identified ex-situ using the field photographs and Field Study Council invertebrate ID guides (FSC 2022). The soil and the invertebrates were placed back in their source location once the counting was completed.
Data Analysis
To process the sound recordings (.WAV files), we used the wildlife sound analysis software Kaleidoscope Pro (Version 5.4.7; Wildlife Acoustics 2022). This software allows for the analysis of full-spectrum recordings to measure multiple acoustic indices, including the ACI (Pieretti et al. 2011), NDSI (Kasten et al. 2012) and BI (Boelman et al. 2007) selected for this study. We chose two diversity indices (ACI and BI) and one index to measure the biophony-to-anthrophony ratio (NDSI), allowing us to test our three hypotheses. We decided to use the ACI, BI, and NDSI due to their ubiquitous usage and demonstrable value in the ecoacoustics field (Alcocer et al. 2022).
Acoustic Complexity Index
Bioacoustic Index
BI is computed as “the area under each curve including all frequency bands associated with the dB value that was greater than the minimum dB value for each curve. The area values are thus a function of both the sound level and the number of frequency bands” (Boelman et al. 2007).
Normalized Difference Soundscape Index
Standard settings in Kaleidoscope Pro were used for the calculation of aboveground acoustic indices. However, as sounds above 2 kHz do not propagate well through the soil (Maeder et al. 2022), for the belowground acoustic indices, we set a maximum frequency of 2 kHz, and a lower threshold of 500 Hz for biophony in NDSI and BI.
Statistical Analysis
All statistical analysis was conducted in R Version 4.2.2 in R Studio 2022.02.2 “Prairie Trillium” (R Core Team 2022) with supplementary software (e.g. Microsoft Excel for .csv file processing). To assess the distribution of the data and model fit, we applied Quantile-Quantile plots using the “qmath” function of the lattice package in R. To test for differences in invertebrate abundance (and to explore initial restoration effects), we applied repeated measures ANOVA tests using the “aov” function in R. We also fit linear mixed-effects models (LMM) to the data using R and its lme4 package (Bates et al. 2015). We used LMMs because they are appropriate for our inclusion of random effects (plots and visits), which are essential to account for the spatial and temporal correlation between the plots and visits in our experimental design. We used Gaussian link function and the response data identity as response data were continuous. Acoustic index outputs were included as response variables, and the deforested versus restored plots were included as fixed effects (predictor variables). Tests of significance were conducted using Satterthwaite's degrees of freedom t-test, which is a function of the LmerTest package in R (Kuznetsova 2020). Soil invertebrate beta diversity was visualized using nonmetric multidimensional scaling (NMDS) ordination of Bray–Curtis distances using the Vegan package in R (Oksanen et al. 2022). The ordination plots show low-dimensional ordination space in which similar samples are plotted close together, and dissimilar samples are plotted far apart. We used the analysis of similarities (ANOSIM) approach to test for compositional differences between treatment groups. The ANOSIM test was conducted using the Vegan package in R (Oksanen et al. 2022). The ANOVA test used in the ACI saturation test was conducted using the easyanova package in R (Arnhold 2022). Data visualizations were produced using a combination of R and the Adobe Illustrator creative cloud 2022 version (Adobe 2021).
Results
Soil Invertebrate Observational Surveys
Restored/Deforested Soil Invertebrate Abundance and Richness
Restored soils had significantly higher invertebrate abundance (F[1,14] = 12.4, p ≤ 0.01) than deforested soils, and there were no significant differences in abundance between plot or visit. There was no significant effect of restoration/deforestation status on invertebrate taxon richness (F[1,14] = 0, p = 1).
Beta Diversity
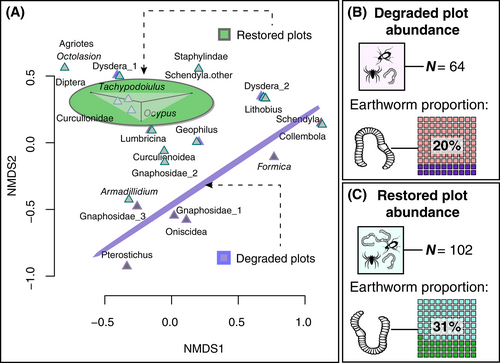
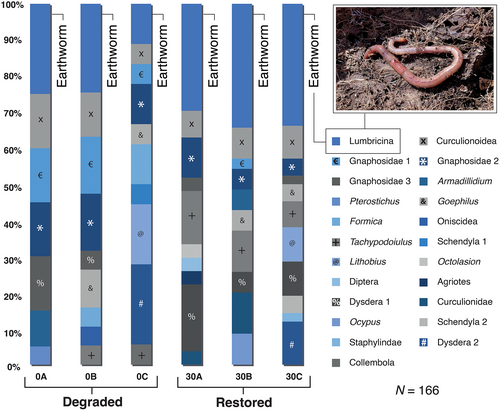
Soil invertebrate community composition was significantly different between deforested and restored plots (stress 0.01, r2: 0.55, p = 0.05, permutations = 999) (Fig. 3). Earthworms (suborder: Lumbricina) were the dominant invertebrate in the soil for both treatment groups (n = 13 from n = 64 for deforested vs. n = 32 from n = 102 for restored plots) (Figs. 3 & 4), and were more abundant in the restored plots (deforested = 1.4; restored = 3.5; F[1,14] = 11.3, p = 0.01) (Figs. 3 & 4).
Ecoacoustics Variables and Invertebrate Abundance and Richness
The ACI correlated with invertebrate abundance, with higher scores in the restored plots (estimate = 0.2, r2 = 0.36, SE = 0.07, p = 0.01). A significant effect also occurred when changing ACI for BI (estimate = 0.9, r2 = 0.31, SE = 0.03, p = 0.02). However, there was no significant effect of restoration/deforestation or invertebrate richness on acoustic complexity based on the ACI (estimate = −0.16, SE = 0.25, p = 0.5). This was also the case for acoustic diversity measured using the BI (estimate = −1.63, SE = 1.18, p = 0.18). This corroborates the repeated measures ANOVA test results for differences in means between invertebrate richness in the deforested versus restored plots (F[1,14] = 0, p = 1).
Soil Ecoacoustics in Sound Attenuation Chamber
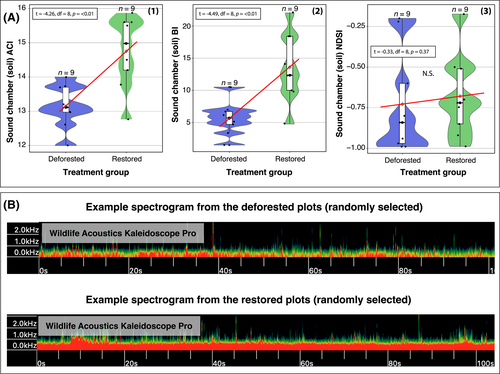
There was significantly greater ACI (estimate = 1.6, r2 = 0.56, SE = 0.3, p ≤ 0.01) (Fig. 5A) and BI (estimate = 7.95, r2 = 0.58, SE = 1.8, p ≤ 0.01) in restored compared with deforested soils, indicating bioacoustic complexity and diversity was higher in the restored plot soils in the sound attenuation chambers. However, there was no effect of restoration/degradation status on NDSI, indicating similar high-frequency to low-frequency ratios in the sound attenuation chamber for restored and deforested soils (estimate = 0.04, SE = 0.13, p = 0.7) (t = −0.33, df = 8, p = 0.37) (Fig. 5A3).
Belowground Soil Ecoacoustics
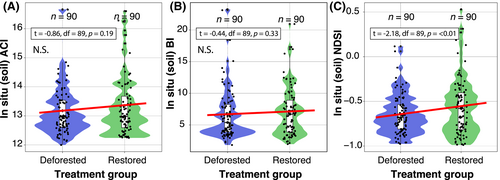
There was no effect of the restoration/deforestation status on ACI (estimate = 0.12, SE = 0.14, p = 0.3) or BI (estimate = 0.25, SE = 0.5, p = 0.6; Fig. 6). There was a greater NDSI in restored in situ soils than in deforested soils (estimate = 0.09, r2 = 0.15, SE = 0.03, p = 0.02) (t = −2.18, df = 89, p = 0.01) (Fig. 6C), indicating greater high-frequency to low-frequency ratio in the restored soils.
Aboveground Acoustic Diversity and Complexity
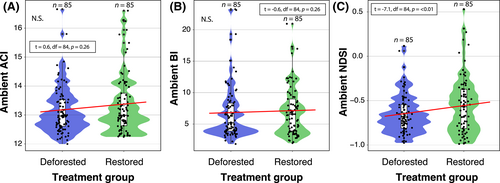
There was no effect of restoration/deforestation status on aboveground ACI (estimate = −0.5, SE = 0.6, p = 0.4) and BI (estimate = 0.7, SE = 2.0, p = 0.7) (Fig. 7). When accounting for the visit and plot random effects, there was no effect of restoration/deforestation status on aboveground NDSI (estimate = 0.14, SE = 0.2, p = 0.6).
Discussion
We show that soils in restored temperate forests—in sound attenuation chambers at least—exhibit higher acoustic complexity and diversity than soils from deforested plots, supporting our first hypothesis. Interestingly, there was no significant relationship between aboveground acoustic diversity and deforested/restored status, probably in part due to the broad scale of sound transmission through the forest, compared to the highly localized soil soundscape (discussed below). We report greater high-frequency to low-frequency ratios in restored compared with deforested soils measured in situ, supporting our second hypothesis. Moreover, we validate our findings by reporting that invertebrate abundance—though not richness—was higher in restored than deforested soils. Accordingly, our study provides a case study on how soil ecoacoustics has clear potential to assess biodiversity in—and the restoration status of—temperate forest soils.
Restored versus Deforested Soil Ecoacoustics
Responses of soil biota to microhabitat conditions have been investigated extensively (Martins da Silva et al. 2012; Heiniger et al. 2015), and a recent study explored the temporal and spatial dynamics of soil biophony using ecoacoustics (Maeder et al. 2022). However, to our knowledge, our study is the first to investigate soil acoustic dynamics in a restoration context. It is the first study to relate the acoustic complexity, amplitude and frequency-band characteristics of the soil soundscape (via the ACI, BI, and NDSI) to the abundance and richness of directly measured forest soil invertebrates. We reveal significant differences in the acoustic complexity and diversity between deforested and restored forest plots when measured in a sound attenuation chamber. These differences were associated with soil invertebrate abundance but not richness (in contrast to Maeder et al. 2022). This relationship between acoustic signals and soil communities, and the variation between deforested and restored plots, suggests that the restoration status of forest soils can be captured by monitoring soil soundscapes. Our models show that we could predict acoustic complexity and diversity based on the deforested and/or restored status of the forest plots, and these relationships were still significant when accounting for plot and visit-associated variability.
The Acoustic Complexity Index (ACI) was the only one of the three indices used that assesses the temporal dynamics of the sound recordings. It has become clear during this study that soil recordings are characterized by broadband stop-start intermittent noises produced by soil fauna, and these dynamics are better represented in the time domain than by analyzing patterns across frequency bins (as done with BI and NDSI). Therefore, ACI is the best index used in this study to analyze the intermittent noises produced by soil fauna.
It is important to note that several factors may have a confounding effect when testing soils in restored versus deforested plots; for instance, compaction, water content and porosity of the soils may differ between treatment groups. This potential bias would have been ameliorated somewhat by our sound attenuation chamber approach (i.e. standardizing the soil structure). However, future research should aim to unpack these factors more comprehensively.
Our results contrasted between sound samples from the sound attenuation chamber and those taken in situ. The reason for this could be that the chamber may enhance the quality of the acoustic signal and reduce the impact of external ambient sounds, increasing the signal-to-noise ratio. Despite the resting period, the act of moving soil into the chamber could also stimulate the movement (and hence sound production) of soil fauna, although acoustic complexity and diversity were still significantly higher in the restored soils. These findings suggest that the sound attenuation chamber sampling approach may be more suitable for detecting soil fauna acoustic signals in this forest restoration context. However, the in situ approach has the benefit of being less intrusive (i.e. no soil excavation is required). Therefore, it will be important to further optimize the in situ sampling strategy to improve the application of ecoacoustics to restoration.
The lack of association between soil invertebrate richness and acoustic index outputs contradicts the relationships found in a recent soil acoustics study (Maeder et al. 2022). This could simply be due to inter-ecosystem variability and the variety of acoustic signals made by soil fauna, which is still poorly understood. It could also be partially attributed to a diel element, in which some soil organisms are more active and therefore “noisier” at certain times of the day than others. This temporal element warrants further research. Alternatively, it could result from the relatively rapid in situ invertebrate-counting method employed in this study, which only provided a “snapshot” of the resident soil fauna. Mean invertebrate richness was the same for both deforested and restored forest plots, although the invertebrate abundance was significantly higher in the restored plots. This aligns with other studies that show higher soil invertebrate abundance in habitats with lower disturbance (Smith et al. 2008; Nkem et al. 2020). The higher abundance of earthworms in the soils of restored plots also corroborates other studies (Wodika et al. 2014; Singh et al. 2020). This could partially explain the higher acoustic complexity detected in restored plots. For instance, earthworms form burrows through the soil as they seek carbon-rich areas, creating preferential networking pathways for plant root growth, water flow and gas transport (Lacoste et al. 2018), all of which contribute to the soil soundscape (Gagliano et al. 2017; Del Stabile et al. 2022; Keen et al. 2022). In the future, it would be prudent to take a more robust approach to invertebrate counting, such as using the Berlese method (Sabu & Shiju 2010). This involves specially adapted funnels to separate soil invertebrates from litter and particles and counting ex situ (Maeder et al. 2022). Metagenomics analysis is another option, either alone or in combination with traditional methods. This allows the genomes of soil organisms to be sequenced, differentiated and labeled without requiring morphological analysis (Schmidt et al. 2022). However, the need to control false-positive occurrences resulting from legacy DNA is vital (Laroche et al. 2017).
We report a significant association between NDSI values and the degradation/restoration status of forest plots, where restored plots exhibited a greater high-frequency to low-frequency ratio, aligning with our second hypothesis. The NDSI seeks to describe the “health” of an ecosystem by inferring the level of anthropogenic disturbance received (Eldridge et al. 2016). We hypothesized that our recording devices were more likely to detect higher-frequency biophony in restored plots and lower-frequency anthropogenic disturbance in deforested plots. This was based on the assumption that the increased signals from biological activity in restored plots would outweigh low-frequency noise, with potential effects also from the attenuation properties of the system (Tashakor & Chamani 2021; Sangermano 2022), that is, the energy loss of sound propagation in a given medium. It could also be that greater earthworm activity changes soil characteristics (making them more air permeable) to allow better propagation of higher-frequency sounds, thereby increasing NDSI scores (Keen et al. 2022). Understanding the factors that affect this biophony-to-anthrophony ratio in a restoration context warrants further research. Examples of next steps could be conducting controlled experiments that manipulate sound sources and adding/removing vegetation and other physical features and media that provide noise attenuation. Applying new physics-based models to evaluate how the frequency and distance-dependent attenuation of sound impact the acoustic detection of soniferous species (Haupert et al. 2022) could also improve outcomes in a restoration monitoring context. Interestingly, there was no significant difference in the NDSI values between deforested and restored soils in the sound chambers, which was probably because the sound attenuation of the chamber acts to standardize ambient acoustic conditions. It could also be due to the chamber ensuring the sound detection spaces are the same across treatments (Darras et al. 2016).
Aboveground Ecoacoustics
Contrary to our expectations, we did not find a significant relationship between aboveground acoustic diversity and complexity and the degradation/restoration status of the forest plots. We hypothesized that we would observe higher acoustic diversity in the restored forest plots as faunal species richness, abundance, biomass and functional diversity are known to increase with restoration age (Derhé et al. 2016). Moreover, studies have shown that bird species diversity (the most soniferous group contributing to the soundscape) increases as restored forests mature, and bird communities in recovering areas become more similar to those of undisturbed areas with post-restoration age (Owen et al. 2020). The lack of a restoration effect on aboveground acoustic diversity and complexity could be due to our deforested and restored plots being relatively small compared to the typical detection distances of birdsong. Consequently, birdsong acoustic signals could potentially overlap across our plots, which is a limitation of our study. Future studies should pair sampling in time across plots, particularly when deforested and restored plots are within relatively close proximity to each other. Alternatively, mean acoustic diversity might increase as patch size increases, and more complex vegetation is associated with higher diversity (Grant & Samways 2016). Therefore, it is possible that the minimum habitat patch size in our study was not sufficient to influence acoustic source variability in the treatment groups.
Our study provides preliminary evidence for using soil ecoacoustics—a minimally intrusive and cost-effective assessment method—as a soil biota monitoring tool that can evaluate restoration projects. With future work, soil ecoacoustics could develop into an effective tool that measures the abundance, complexity and composition of soil biota that is also sensitive to restoration interventions. This would require research to determine whether different soil organisms produce specific sounds that could allow taxonomic differentiation. Given the rapid pace of biodiversity loss and the rise in anthropogenic noise, the ability to detect the acoustic signals from soniferous species and monitor the level of disturbance from anthrophonies has never been more important. Further exploration of aboveground ecoacoustics in different forest restoration settings, for example, sites receiving different restoration interventions of varying patch sizes and in different biomes, would be valuable. Building on our findings––that soil acoustic complexity and diversity and noise disturbance differ between deforested and restored forest plots––has the potential to inform and enhance future restoration policy and practice.
Acknowledgment
Open access publishing facilitated by Flinders University, as part of the Wiley - Flinders University agreement via the Council of Australian University Librarians.


