Mines to forests? Analyzing long-term recovery trends for surface coal mines in Central Appalachia
Author contributions: CJT, MRVR, RKS conceived the ideas and designed the methodology; CJT, MRVR, MH collected the data; CJT, MRVR, RKS analyzed the data; all authors led the writing of the manuscript; all authors contributed critically to the drafts and gave final approval for publication.
Abstract
Mountaintop removal mining, and other surface mining operations have severe, large-scale impacts on the communities and ecosystems of Appalachia. The impact of this disturbance surpasses that of other land clearing events, such as fire or timber harvesting; mines remove both established vegetation and soil, but also alter landscape topography. The Surface Mining Control and Reclamation Act legally mandates restoration of former mines after the end of mining activity, yet the long-term outcomes of restoration efforts across Central Appalachia are unknown. We conducted the first regionwide analysis of the lands mined between 1985 and 2015 in Central Appalachia, and explore post-mining ecological trajectories. Pairing mine-footprint and remote sensing data, we characterize the vegetation trends and site health at 71,140 mine sites across Central Appalachia. We use first order autoregressive models to describe the rates of recovery, expected long-term ecological state, and probability of recovery to reference state for former mines. We found that only 7.9% of sites recover to 95% of the forest reference condition in all remote sensing indices. Overall only 0.10% of sites have a 95% probability of reaching or exceeding reference forests in all remote sensing indices. While much of these mined lands are intentionally not being reforested, 19% of mines in Kentucky, 81% of mines in Virginia, and 46.5% of mines in West Virginia have declared forestry as the primary land use for post-mining operations. Our results indicate that post-mining forests are not recovering to a level that is consistent with average forest conditions in similar unmined sites.
Conceptual Implications
- Site recovery cannot be directly linked to physical characteristics of the size such as area or post disturbance precipitation.
- Ongoing efforts to restore disturbed lands could improve the overall ecological performance.
- Failures to adequately restore mined lands will burden the health and economies of Appalachian communities and ecosystems.
- Remote sensing can be a vital tool for distributed monitoring of restoration success over large areas.
Introduction
Appalachian forests are recognized as globally important, both because of the biodiversity they support and the ecosystem services that they provide (Zipper et al. 2011; Maigret et al. 2019). Mountaintop removal mining (MTM) drastically alters terrestrial ecosystems and is a specific threat to these forests (Wickham et al. 2013). MTM is responsible for intense topographic changes, as existing mountains and ridges are flattened, and, unlike underground mining, MTM both reaches deep into the critical zone (Ross et al. 2016) and has substantial impacts to terrestrial ecosystems over large areas (Ross et al. 2021). Throughout the topographically complex region of Central Appalachia, mining operations clear both vegetation and topsoil from mountains in preparation for blasting. Once cleared, explosives are used to fracture the underlying bedrock to expose coal seams. Following the blasting, the fractured rock, called overburden or spoil, is removed from the site and placed into neighboring valleys through a process known as valley fill (Maigret et al. 2019). Since 1976, surface mining operations have directly impacted over 5,900 km2 of land in Central Appalachia (updated from Pericak et al. 2018), destroying native forests, burying miles of headwater streams, and threatening the survival of endangered species (Evans et al. 2021).
In addition to the direct clearing of land and burial of streams, Wickham et al. (2006) determined that the area of land affected by MTM is up to five times greater than the amount of land directly cleared for mining, due to the conversion of interior forests to edge forests. As a result of the disturbances caused by mining, formerly mined lands are characterized by highly variable surface soils with areas of high compaction and others with unconsolidated, loose fill material (Greer et al. 2017) and highly active weathering of newly exposed bedrock (Ross et al. 2018). These alterations to the soil and subsurface can prevent the restoration of native species (Emerson et al. 2009). As such, former mines have altered vegetation structure, type, and increased presence of non-native vegetation (Zipper et al. 2011; Wickham et al. 2013; Ross et al. 2021).
In an effort to mitigate the severe impacts of mining, mine operators are required, by US law, to restore the land following the cessation of mining operations. The Surface Mining Control and Reclamation Act of 1977 (SMCRA) requires that restoration returns the land to a level that is capable of “supporting the uses which it was capable of supporting prior to any mining, or higher or better uses.” There is a degree of ambiguity relating specifically to the “higher or better uses” clause of SMCRA (Office of Surface Mining Reclamation and Enforcement, Charleston Field Office 1988; Skousen & Zipper 2014; Popkin 2020). However, in instances where restoration to a forested state is the desired post-mining land use (PMLU), this restoration includes restoring the original contours of the land, although operators are able to apply for variances to the original contour, and establishing native vegetation which is “diverse, effective, and permanent.” PMLU data from state regulatory agencies in Kentucky, Virginia, and West Virginia show that forest is a major PMLU class for sites in the region, 19% in Kentucky, 81% in Virginia, and 46.5% in West Virginia (Kentucky Energy and Environment Cabinet 2021; Virginia Department of Energy 2021; West Virginia Department of Environmental Protection 2021). Despite these requirements, former mined lands frequently fail to see the successful recovery of native vegetation (Oliphant et al. 2016) or ecological function (Townsend et al. 2009). As commonly implemented now, MTM restoration involves seeding regraded overburden with herbaceous plants (Townsend et al. 2009) and woody species, or non-native species, such as Autumn Olive (Zipper et al. 2011; Oliphant et al. 2016), making restoration of native forests uncommon and difficult. A more recently developed approach to restoring mined lands is the Forestry Reclamation Approach (FRA), designed by Burger and Zipper in 2002 (Burger & Zipper 2002). The FRA is designed to facilitate recovery in a way that supports the reestablishment of native Appalachian forests (Zipper et al. 2011). Despite the promise of the FRA (Gurung et al. 2018), it is unclear how much MTM land is being restored under these approaches, with a recent regional analysis suggesting that most post-mining forests do not recover to their pre-mining condition (Ross et al. 2021). Throughout this research, we reference restoration to indicate the practices of restoring mined lands through intentional action, while recovery is used to describe the ecological performance of a site improving to a state that is consistent with the expected values for reference forests.
Here we build on this regional analysis, by analyzing the vegetation trajectories for all mined sites in Central Appalachia since 1985 with remote sensing and a database of surface mines derived by Pericak et al. (2018). We are especially interested in the ability, or lack thereof, of mined lands to recover to a state that equals or exceeds unmined forests in the region (i.e. reference forest conditions). As a part of the mine permitting process, mine operators are required to set aside bond money, to be used to reclaim the land disturbed by mining. Recently, the adequacy of these bonding systems has come into question (Tony 2021). Half of the coal in the United States is mined by companies that have recently gone bankrupt, and many coal companies use the bankruptcy process to evade land restoration efforts (Macey & Salovarra 2019). A recent audit of the West Virginia state managed reclamation fund determined the state's per-acre bonding limits may be insufficient to guarantee the solvency of the program (Simonton & Surber 2017).
Previous studies that have examined the recovery of mined lands were limited by access to imagery for remote sensing-based analyses (Townsend et al. 2009; Sen et al. 2012; Monroe et al. 2020) or constrained to a set of sample sites within the region (Gorman et al. 2001; Holl 2002); or focused on only one state or region (Ross et al. 2021). Remote sensing-based analysis has proved to be an effective approach for monitoring recovery from destructive events such as wildfires and volcanic eruptions (Lawrence & Ripple 1999; Morresi et al. 2019; Monroe et al. 2020), and as such is an effective method for monitoring the recovery of Appalachian lands following mining.
- What is the state of forest recovery for mined areas across Central Appalachia?
- Do external factors such as precipitation and site elevation help explain forest recovery?
We attempt to answer these questions using a suite of spectral characteristics, bands, and vegetation indices, which can be created using Landsat. We also build a dataset of site characteristics like precipitation and elevation data, for each former mine site. Following image processing from GEE, we use a first-order autoregressive model to analyze site recovery characteristics, and estimate both the site's rate of recovery and the expected long-term equilibrium that a mined site will recover based on its recovery trends. The resulting data are freely available for public use (https://doi.org/10.6084/m9.figshare.19623768).
Methods
Study Area
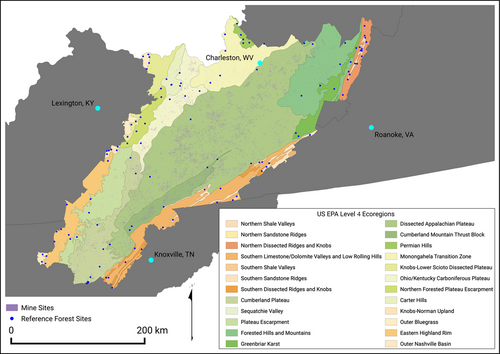
The Central Appalachian study area (see Fig. 1) is comprised of 74 counties in West Virginia, Virginia, Tennessee, and Kentucky, previously utilized by Pericak et al. in their 2018 work to map the extent of MTM operations. In the period between 1976 and 2015, over 5,900 km2 of land in this area were directly impacted by MTM, which accounts for 7.1% of the study area (Pericak et al. 2018). MTM is the predominant form of coal extraction in this region (Ross et al. 2016) and the primary driver of land cover change (Townsend et al. 2009; Bernhardt et al. 2012). Our GEE methodology generated imagery across the entire study area, but analysis was confined to areas intersecting identified mined land or reference forest sites.
Data Filtering and Last Mined Year Determination
The Pericak et al. (2018) dataset identifies the spatial extent of active mining on an annual basis from 1985–2015; we adapted this dataset to select areas based on the year that they were last detected as actively mined, denoted as Last Mined Year. Following data filtering, adjacent areas were joined into single polygons based upon their last mined year attribute, in 5-year bins (Frazier et al. 2018). Table 1 provides the breakdown of when a site was last detected as actively mined and the last mined bucket it was grouped in. The site binning considers that sites which are no longer mined are likely linked to neighboring areas identified as active mines, and accounts for areas where mining activity has stopped, but revegetation has not occurred to a great enough degree for the Pericak et al. (2018) algorithm to no longer identify it as active. Following the merge of sites by last mined year, we further filtered the dataset to remove any areas which were less than 10 pixels in size (900 m2, based on the 30 m resolution of Landsat imagery). In a final step, we removed all sites identified as last mined in 2015. We did not extend the Pericak analysis past 2015 and thus cannot rule out that mines identified as actively mined in 2015 did not remain active in the following years. Our fully processed dataset of mine ages is referred to as the last mined dataset hereafter.
| Last Detected Year of Mining | Last Mined Bin |
|---|---|
| 1985–1989 | 1989 |
| 1990–1994 | 1994 |
| 1995–1999 | 1999 |
| 2000–2004 | 2004 |
| 2005–2009 | 2009 |
| 2010–2014 | 2014 |
| 2015+ | 2015 |
Composite Creation
Our analysis operates on data derived from Landsat imagery, making use of its medium resolution (30 m) data and catalog available since 1972. Our mine data is derived from the 2018 Pericak study, so we restricted the catalog to images available since 1985. In preparation for our site analysis, we used GEE to create a set of annual median surface reflectance composite Landsat images. Our image processing code filtered annual imagery to select the growing season period from April through October and subsequently calculated a suite of spectral indices (normalized difference vegetation index [NDVI], normalized difference moisture index [NDMI], normalized burn ratio [NBR]; see Fig. S1 for bands and indices used). We harmonized the Landsat data provided in GEE to account for differences in band wavelengths between the Landsat satellites (Roy et al. 2016). We used the PRISM Monthly Spatial Climate dataset to determine the annual mean precipitation for each mined site. The PRISM dataset is produced by the PRISM Climate Group at Oregon State University and provides historic precipitation data dating back to 1895 (Daly et al. 2008). We used elevation data from the Copernicus GLO-30 digital elevation model (downloaded from OpenTopography.com), derived from radar satellite data collected from the TanDEM-X mission. The downloaded elevation dataset for our study area was loaded into GEE to calculate the slope, using its built-in Terrain products tools. For each mine site, the mean slope and elevation were calculated.
Reference Forest
For our analysis we define forest health as the average condition for forested sites that remained undisturbed during the course of our study. To provide a baseline for Central Appalachian forest health, we manually created a set of reference sites (Fig. 1). Each of these reference sites represents an area of Appalachian forest that remained unmined over the study period. To account for regional differences across the study area, the sites were distributed across the Environmental Protection Agency (EPA) Level 4 Ecoregions found within the study area (Fig. 1). Five sites were selected for each of the 24 EPA level 4 ecoregions, creating a reference dataset of 120 sites. Specific reference values used for comparison were calculated as the long-term mean across years for all reference forest sites within an ecoregion.
Metric Aggregation and Key Bands
Following the creation of the last mined dataset and the reference forest dataset, we joined the spectral information to the mined polygons. We calculated the mean values for every band and index across the site (see Table 2); our focuses were on the analysis of select indices (NBR, NDMI, and NDVI). However, we calculated mean values for all bands and indices to accommodate future users who may have specific interest in bands or indices we do not use. This created vector datasets which preserve the annual spectral data mean for each year in the study from 1985 to 2019 for every band or index available (e.g. NDVI 1990, NDVI 1991, NDVI 1992, or G 1985, G 1986, G 1987). From this list of available data, we chose three indices as the key indicators of forest health, based on literature evaluation of what each metric can tell you about forest status. The NDVI is used to indicate vegetation which is photosynthetically active (Frazier et al. 2018; Pericak et al. 2018), where high NDVI levels are associated with dense or mature vegetation, while lower values are associated with grasses, shrubs, or bare earth. NDVI values saturate relatively quickly and are not as sensitive to long-term changes in greenness; the NBR is well suited to both short-term and long-term vegetation recovery and is linked to properties of forest structure (Frazier et al. 2018; Chirici et al. 2020), where higher values imply denser canopies. The NDMI characterizes the relative moisture levels of soil and vegetation and serves as an indicator of forest health (Carrasco et al. 2019; Sankey et al. 2020), where higher values indicate more moisture held in the forest canopy or soil, implying higher biomass, when comparing repeatedly to nearby plots with similar plant water status. In addition to the spectral indices provided by Landsat, we also examined the mean slope for mine sites, which can be an important control on vegetation structure, the mean elevation for the site, as there is significant variability in elevation across the study area, and the average precipitation over the length of the last mined bin, as an indicator of growing conditions at the site.
| Band Designation | Band Name | Equation |
|---|---|---|
| R | Red | NA |
| G | Green | NA |
| B | Blue | NA |
| NIR | Near infrared | NA |
| SWIR1 | Shortwave infrared band 1 | NA |
| SWIR2 | Shortwave infrared band 2 | NA |
| EVI | Enhanced vegetation index | G × (NIR − R)/(NIR + C1 × R − C2 × B + L |
| NBR | Normalized burn ratio | (NIR − SWIR2)/(NIR + SWIR2) |
| NBR2 | Normalized burn ratio 2 | (SWIR1 − SWIR2)/(SWIR1 + SWIR2) |
| NDMI | Normalized difference moisture index | (NIR − SWIR1)/(NIR + SWIR1) |
| NDVI | Normalized difference vegetation index | (NIR − R)/(NIR + R) |
| SAVI | Soil adjusted vegetation index | ([NIR − R]/[NIR + R + L]) × (1 + L) |
| MSAVI | Modified soil adjusted vegetation index | (2 × NIR + 1 − √[(2 × NIR + 1)2 − 8 × (NIR − R)])/2 |
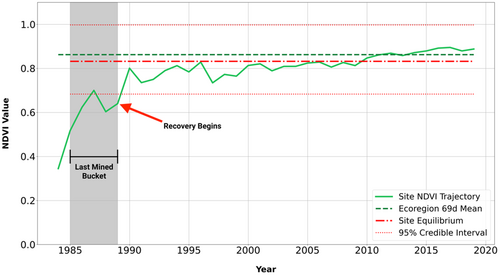
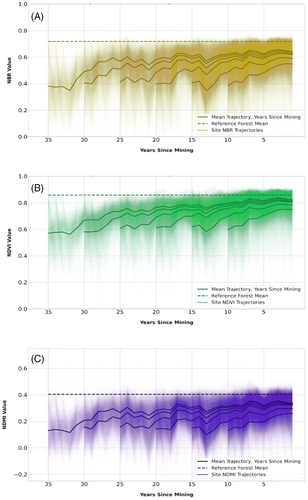
We estimated the parameters in Equation (1) by fitting the AR(1) to observe remote sensing data for each mined set independently, resulting in estimates and for each mine site and each remote sensing metric. Models were fit using the stan_glm() function in the rstanarm package in R (Goodrich et al. 2020). We then calculated the estimated posterior distribution of the equilibrium for each site using Equation (2) and iterating over posterior Hamilton Monte Carlo chains for and . We then calculated the median posterior state and the probability that each mined site has or will reach an equilibrium at or above the reference forest condition using the equilibrium posterior distribution.
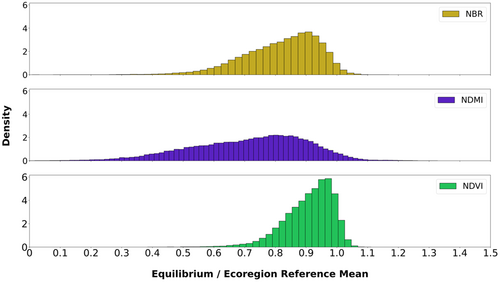
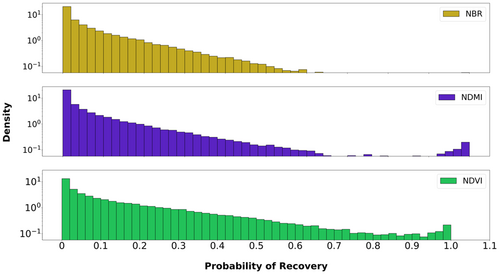
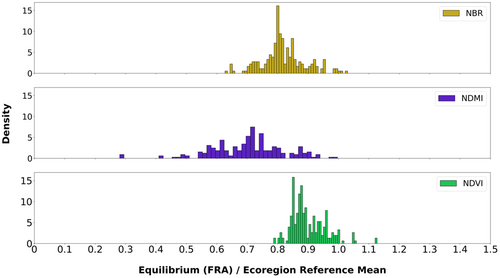
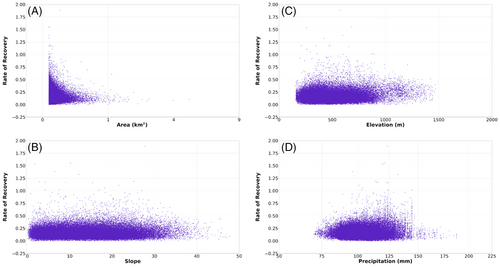
There are many factors which affect landscape recovery. Our analysis of the AR(1) model outputs examined the relationship between the rates of recovery and the area of land disturbed for sites, the average slope of sites, the average elevation of sites, and the average precipitation during the site's last mined bin. We compared the equilibriums of sites to the mean of their ecoregion reference forests (Fig. 4). We also examined a site's probability of recovery to a state equivalent to or greater than the mean for reference forests (Fig. 5).
Results
Our analysis compared the recovery of each NDVI, NDMI, and NBR for mined lands to the average in reference forests located within the same EPA level 4 ecoregion. We compared the expected equilibrium value for sites to the long-term average of reference forests as a measure of site recovery, see Table 3. This long-term average for reference forest sites with EPA level 4 ecoregions is our recovery threshold.
| Recovery Threshold | % Recovery (Site Equilibrium ÷ Ecoregion Average) |
|---|---|
| <75% Recovery | Site equilibrium < 75% of EPA |
| 75–95% Recovery | 75% EPA ≤ site equilibrium < 95% of EPA |
| 95% Recovery | 95% of EPA ≤ site equilibrium |
Examining the average equilibrium values for NDVI in mined sites, we found that 4.1% have an equilibrium value that is less than 75% of the value expected for their reference forest, 60% reached an equilibrium value within the 75–95% recovery threshold, and 36% reached or exceeded the 95% recovery threshold. For NDMI, 53% fell below the 75% threshold, 39% reached the 75–95% threshold, and 8.6% reached or exceeded the 95% recovery threshold. Likewise, for NBR, 27% fell below the 75% threshold, 61% reached an average equilibrium value within the 75–95% recovery threshold, and 12% reached or exceeded the 95% recovery threshold (Fig. 4).
We assessed these indices together as a proxy for site health, sites are considered recovered only if the values for all three indices are equivalent to or greater than 95% of the value expected for an unmined forest in the same region; when examining all three together, we found that only 7.9% of mined land has recovered to this level.
Because there is uncertainty in our equilibrium estimates, we also calculated the probability that a site's long-term equilibrium is at or above the ecoregion average for NBR, NDMI, and NDMI using our estimated posterior distributions. We found that in half of the sites there is a <3.3% probability of recovery to or above the ecoregion average NBR, <3.3% probability of recovery to or above the ecoregion average NDMI, and <8.4% probability of recovery to or above the ecoregion average NDVI. We found only 0.23% of sites can we say with greater than 95% probability will recover to at or above the ecoregion average NBR, 0.70% of sites can we say with greater than 95% probability will recover to at or above the ecoregion average NDMI, and 0.79% of sites can we say with greater than 95% probability will recover to at or above the ecoregion average NDVI. When examining the probability of recovery across these indices together, we find that only 0.10% of sites have a 95% probability of reaching or exceeding reference forests.
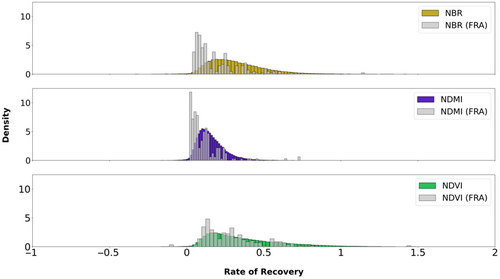
We also examined the equilibrium values for sites employing the FRA. It is important to note that FRA is a relatively new approach to forest restoration, it has only been employed from 2003 onward, and within our study area it has only been applied on 223 sites. For the FRA sites' NDVI, we found that 0% have an equilibrium value that is less than 75% of the value expected for their reference forest, 80% reached an equilibrium value within the 75–95% recovery threshold, and 20% reached or exceeded the 95% recovery threshold. For NDMI 70% fell below the 75% threshold, 30% reached the 75–95% threshold, and 0.90% reached or exceeded the 95% recovery threshold. Likewise, for NBR 14% fell below the 75% threshold, 80% reached an equilibrium value within the 75–95% recovery threshold, and 5.8% reached or exceeded the 95% recovery threshold (Fig. 6).
Nearly the entirety of mined lands is experiencing some degree of recovery. Looking at NDVI, 99% of sites have a recovery rate that is greater than 0, indicating some degree of landscape recovery while only 0.81% of sites have negative rates of recovery; these negative recovery rates appear to be caused by a mix of factors including instances of re-clearing, as seen by large drops in site performance (Fig. S6A), an insufficient amount of time to illustrate positive recovery, especially for sites last mined in 2014 (Fig. S6B), and generally stagnant trajectories, either because a site has been misclassified as a mine or because it has been misclassified as being no longer mined (Fig. S6C). We see similar results looking at both NDMI and NBR; for both NDMI and NBR 99% have positive recovery rates. In the timeframe that we have, there is not a large discernable difference in FRA sites' rate of recovery, as compared to sites which have not used FRA. For FRA sites, 99% have an NDVI recovery rate greater than 0, for NDMI and NBR all FRA sites have a recovery rate that is greater than 0 (Fig. 7). Additionally, when combining the indices as a proxy for site health, we found that 0.90% of sites recovered to a level that is equivalent or greater than 95% of the value expected for unmined forests, and that 0% of sites have a recovery less than 75%. In comparison to other mine sites, FRA sites appear to reach higher recovery thresholds overall, there are no sites with less than 75% recovery, and higher percentages of mixed recovery and recovery within the 75–95% range.
There is substantial variability in the relationship between rate of recovery and the area of disturbance for smaller sites, see Figure 8A. Initial analyses on the controls of recovery rates indicate that neither size of area disturbed, site slope, site elevation, nor average precipitation over the recovery interval meaningfully control recovery rates (Fig. 8); a multiple regression analysis examining the impact that all driving variables have on recovery rate indicate that when considered together, these also do not meaningfully control recovery rates.
Discussion
Synthesizing data from 71,140 mine sites across Appalachia, we find strong evidence that post-mining landscapes are not recovering to a level that is consistent with reference forests within the region. The high level of disturbance associated with mined lands, e.g. compacted soils and the removal of seed banks, present a significant barrier to recovery on these sites. During the reclamation process, many sites experience arrested succession; this is often a result of the use of non-native ground cover and poor post-bond release management, which causes mined lands to remain in a non-forested state for decades (Groninger et al. 2007; Adams 2017). Our approach for assessing post-mining recovery effectively details the ecological function of these arrested landscapes. Overall, post-mining landscapes are less green (lower NDVI for at least 60% of sites) with less dense vegetation (lower NDMI and NBR for 90% of sites). Though some individual sites recover to reference conditions on one or more of our indices, the majority do not, especially when using indices that are a proxy for forest vegetation density. There is forest recovery across almost all sites (>98%), but the forests growing there are structurally different, as defined by our remote sensing indices. These differences are consistent, broad, and describe the majority of the Appalachian region where MTM has occurred. Further forest differences occur both in mines that ceased operations only 10 years ago, and in mines that ceased operations more than 30 years ago. While still in the early phase of recovery (<20 years), it also applies to mines that have been restored with the approach meant to improve forest recovery (FRA). Together these differences highlight likely long-term changes to the ecosystems of the region, consistent with other work highlighting MTM's long-term impacts on geomorphology (Jaeger & Ross 2021), hydrology (Nippgen et al. 2017), and biodiversity (Hutton et al. 2020; Evans et al. 2021). Yet, it does seem that some forests do fully recover to reference conditions, though our initial analyses of physiographic variables do not offer an obvious control on how different forests recover.
Surface mining operations create more intense disturbances than clearing events such as fire or logging. White et al. 2022 examined forest recovery from timber harvesting and wildfires across Canada from 1985 to 2017, through the lens of NBR and years to recovery (Y2R) metric (White et al. 2022). White et al.'s Y2R examines the time required for disturbed pixels to reach a value 80% of the pre-disturbance value for the site. Across this time period, they find that 76% of sites impacted by fire events, and 93% of harvested areas, have recovered based on NBR. Throughout our analysis, we define recovery more conservatively than White et al., as reaching a value that is ≥95% of the values expected for unmined forest across NBR, NDMI, and NDVI. To compare mining recovery rates more closely to their 80% threshold, we can look at the NBR performance of mined lands that recover within 75% or greater of reference NBR. With this metric we find that for 73% of sites reach a level of recovery that is at least 75% of the value expected for unmined forests, a lesser level of recovery than for fire or harvesting, even with a more liberal recovery benchmark. The approach to assess recovery of post-mining landscapes in Appalachia is also applicable to other landcover disturbances and is not limited to mining. This approach is valuable for conducting analyses in instances where physical access to the land is restricted, or when study areas encompass large spatial extents; coupling this approach with new publicly available Light Detection and Ranging (LiDAR) data from sensors, such as NASA's Global Ecosystem Dynamics Investigation, will be helpful to assess ecosystem structure.
Through the combination of the three indices, we determined that some sites (7.9%) are expected to fully recover on average to a level consistent with reference forests, while other sites (92.1%) do not reach reference states, that is, they do not reach a level that is ≥95% of the value for unmined forest for NBR, NDMI, and NDVI. However, remote sensing alone is likely insufficient to determine exact causes in the wide range of recovery conditions, highlighting the need for future analysis of local controls which are not observable from space on site recovery, such as soil compaction or seeding practice. While we do examine the effects of several variables on recovery independently here, the interconnected relationships between these and other variables on recovery is worthy of future analysis. In particular, the Forestry Restoration Approach may be promising in its ability to more adequately restore mined lands, as no FRA site was below 75% recovery, despite having only been implemented since 2003. However, the range of FRA recovery rates and total recovery are firmly within the range of rates seen in non-FRA sites. Further, FRA sites cover a small percentage of the total landscape (2.2% of former mines by area). Given this, the recovery trends we see here for non-FRA sites are a more important indicator of the future of most post-mined lands. The addition of other remote sensing datasets, such as canopy height provided by LiDAR or average annual surface temperatures, would offer additional clarity about the structure of post-mining landscapes (Ross et al. 2021). The addition of biological datasets, such as species distributions, would also provide information about the altered structures of forests on mined lands.
While all regressions between disturbance area and rate of recovery, equilibrium value, and likelihood of reaching reference conditions (Greer et al. 2017) were significant (p < 0.01), this is likely caused by the large sample size. These results are not ecologically meaningful since the r2 on these regressions were all below 0.02 with slopes around 0 (range of slope values, from −0.13 to 0.21), indicating little consistent impact from our driving variables. Despite ecological theory suggesting that smaller areas disturbed might recover more quickly following a disruption (Turner et al. 1998), in Appalachia larger areas of disturbance from logging typically have faster forest regrowth than smaller disturbed areas due to the increased access to light for seeds stored in the soil (Shure et al. 2006). However, we cannot assume this holds true for disturbances caused by MTM which severely disturbs soils. Our results indicate that with deep geologic disturbances like MTM, factors other than patch size, topography, and rainfall are likely controlling the rates of recovery. Still, our results highlight a wide spread in both the rates of recovery and the equilibrium values reached by mined sites. Understanding why some sites recover quickly to pre-MTM condition, while others do not, is of critical interest for understanding the future of post-mining landscapes.
Our analysis of site recovery compares mined lands to reference forest sites, however not all mined lands are intended to be restored to a forested state. Under the Surface Mine Control and Reclamation Act, every surface mine must include a reclamation plan with a defined PMLU, with reforestation only being one option. Other common PMLU uses include wildlife management and pasture. While each Appalachian state varies in how much of the PMLU is forest, it is one of the most common reclamation land uses 46.5% in West Virginia, 81% in Virginia, and 19% in Kentucky (Kentucky Energy and Environment Cabinet 2021; Virginia Department of Energy 2021; West Virginia Department of Environmental Protection 2021). The PMLU of a site is often chosen by the surface owner which could be the same or different entity than the mining coal company. Land ownership is highly concentrated in Appalachia with a large percentage of the land being held in the hands of few landowners who are often non-local corporations with little ties to the local community (Appalachian Land Ownership Task Force 1981). Even if the community does not own the land or have any legal right to say what the PMLU is, there is an expectation to return the land to a state similar to what it was before mining. Some community members use the forested landholdings owned by outside parties as a commons (Newfont 2012). Activities for commons usage include hunting, fishing, and foraging for mushrooms, ramps, and ginseng (Hufford 1997).
We also note that restoration and recovery are ongoing processes, and that actions taken on the ground by operators, or those responsible for restoration, will affect the future of sites. The efforts taken to restore mined lands, or augment existing restoration, will affect the expected equilibrium values in the future. The adequate enforcement of mine land restoration requirements is critical to the health of Appalachian communities and ecosystems. A recent report indicates that in West Virginia, failures of state regulatory bodies to address federal requirements put the state's reclamation program at risk of insolvency (Joint Committee on Government and Finance West Virginia Office of the Legislative Auditor 2021). As the cost of reclamation increases, state required bonds are being undervalued, and are at risk of being unable to restore the land should operators abandon their obligations (Tony 2021). We make our data freely and publicly available, with the hope that it will inform reclamation policy and facilitate stronger assessments by enforcement agencies evaluating landscape restoration on mined lands.
Acknowledgments
We thank The Cornell Douglas Foundation, The Tilia Fund, and The National Geographic Society for providing financial support for this research.


