Transcriptomic Insights Into Elevation-Dependent Gene Expression in Rhododendron anthopogon D.Don: Implications for Climate Resilience
Funding: We receive financial support from the Department of Biotechnology, Ministry of Science and Technology, Government of India, New Delhi, under grant no: BT/PR29259/FCB/125/2/2018 to carry out the present work.
ABSTRACT
Understanding the molecular basis of how species adapt to varying elevations can advance our knowledge regarding forecasting and regulating the consequences of climate change on plants. Here, we investigate the variation in gene expression patterns of Rhododendron anthopogon D.Don along an elevation gradient (3200–3900 m) in Kashmir Himalaya, India, based on comparative transcriptomics. We observe the highest number of differentially expressed transcripts between the lowest (3200 m) and highest (3900 m) sites, indicating a strong elevation-associated divergence in gene activities. Most of these transcripts were significantly enriched in biological processes linked to stress response and secondary metabolism, suggesting their role in the elevation-dependent adaptation of R. anthopogon. We identified different genes for secondary metabolite production; the expression pattern of these genes increased with the rise in altitude. By using gene co-expression network (GCN) analysis to elucidate the interaction between targeted genes and regulators, we found that 200 transcription factors belonging to 36 families were putatively involved in regulating important metabolic pathways of R. anthopogon in response to changing altitudes. Thus, these metabolic pathways may play an important role in the adaptation of R. anthopogon in response to environmental stress along an elevation gradient. Therefore, the findings of this study will provide insights into how alpine R. anthopogon adapts to environmental responses to global climate change.
1 Introduction
Variations in environmental conditions caused by elevation gradients are considered to be far more relevant in mountain ecosystems than by horizontal gradients (Ye et al. 2023; Niu et al. 2024). The unique biodiversity supported in mountainous ecosystems is due to diverse zones of plant growth along the elevation gradient. Even at small differences in elevation, plants react to significant climatic fluctuations and serve as an excellent organism for studying environmental adaptation (Körner 2007; Hollister et al. 2015; Fatima et al. 2022; Mangral et al. 2023; Dar et al. 2024). With rising temperatures, it is predicted that plant species' distributional ranges will shift to higher elevations (Ohmura 2012; Nagano et al. 2019; Wani and Pant 2021; Abrha et al. 2024). Elevation gradients in the mountains are investigated to comprehend the effects of climate change on plant dispersal and adaptation, as significant changes in habitats may happen over small distances (Adamczyk et al. 2019). High-elevation species face various selective pressures in comparison to those found in low-elevation regions. These pressures include low oxygen and low temperature levels, intense UV radiation, and severe seasonality (Körner 2007; Sundqvist et al. 2013). Therefore, understanding the genetic basis of how species adapt to various habitats along elevation gradients can advance our knowledge regarding forecasting and regulating the consequences of climate change in plant species.
Variations in patterns of gene expression are critical for the production of different genotypes and phenotypes, which allow an organism to adapt to adverse environmental circumstances (Xu ChenXi et al. 2015; Gurung et al. 2019; Ye et al. 2023). Fluctuations in gene expression, especially those regulating biosynthetic pathways, have been shown to directly influence the accumulation and variation of metabolites in plants (Ye et al. 2023). Altitudinal gradients often impose distinct environmental stresses such as low temperature, high UV radiation, and low oxygen availability, which are known to modulate the expression of genes involved in primary and secondary metabolism (Körner 2007; Akula and Ravishankar 2011). As sessile organisms, plants rely on intricate genetic and molecular programs to adapt to environmental stressors through morphological and physiological plasticity (Molinier et al. 2006; Sierra-Almeida et al. 2018; Rathore et al. 2022).
RNA sequencing (RNA-seq) has emerged as a powerful tool to explore transcriptomic reprogramming associated with environmental adaptation (Mutz et al. 2013; Zuther et al. 2015; Gurung et al. 2019; Manzoor et al. 2025). Several studies have suggested that transcriptome variation across populations can reveal underlying molecular mechanisms contributing to adaptive responses in different environmental contexts (Yang et al. 2017; Cho et al. 2018; Tang et al. 2022; Zhou et al. 2022; Ye et al. 2023). Recently, by employing an RNA sequencing approach, variations in gene expression patterns have contributed to abiotic stress compensation in different plants. For instance, studies have revealed stress-compensatory gene expression changes in Primula sikkimensis (Gurung et al. 2019), organ-specific expression dynamics in Rhododendron sanguineum var. haemaleum (Ye et al. 2023), and cold-responsive gene networks in R. anthopogon (Rathore et al. 2022). Additionally, Rhododendron molle has been profiled for secondary metabolite biosynthesis (Zhou and Zhu 2020), and Potentilla bifurca has shown transcriptomic adaptations to harsh alpine conditions (Tang et al. 2022). Several transcriptomic studies offer insights into plant responses to single stresses under controlled conditions (Li et al. 2013; Calzadilla et al. 2016; Chen and Li 2017; Gurung et al. 2019); however, responses to changing conditions in the natural environment remain less understood.
There is a limited intraspecific adaptation of alpine plants in the Himalayan Mountains, especially for woody species at elevations above 3000 m. Among these, the genus Rhododendron (Ericaceae) represents one of the most taxonomically diverse and ecologically significant plant genera, comprising over 1000 species distributed across temperate and subalpine regions of Asia, Europe, and North America (Chamberlain et al. 1996). Many Rhododendron species are known not only for their ornamental value but also for their ecological and medicinal importance. For instance, Rhododendron arboreum is valued for its anti-inflammatory properties and traditional uses in local medicine (Jha et al. 2025), while R. ponticum plays a crucial role in forest understories, impacting soil chemistry and biodiversity (Hofmockel 2024). Several species, such as R. lepidotum and R. campanulatum, are adapted to high-altitude environments and serve as key components of alpine and subalpine ecosystems (Singh et al. 2023).
Furthermore, it has been demonstrated that environmental heterogeneity has significant effects on species diversity within Rhododendron (Guan et al. 2024). Different species of Rhododendron can inhabit a variety of environments, ranging in elevation from 1000 to 5000 m, and they play a significant role in these heterogeneous ecosystems (Shrestha et al. 2018; Xia et al. 2022). Abiotic stress factors such as extreme temperatures (Zhang et al. 2025; Li and Wu 2025), drought (Ying et al. 2024), and high UV radiation (Sun et al. 2024) have a significant impact on the physiological and biochemical processes of Rhododendron spp. In higher altitudes, they face the challenge of intense UV radiation and lower temperatures (Sundqvist et al. 2013). These environmental factors can lead to oxidative stress, disturbance in photosynthesis, and hinder the overall metabolic function of the organism (Rathore et al. 2022). The molecular processes of Rhododendron species that support adaptations to climatic changes over altitudinal gradients are not well understood, despite growing recognition of their ecological significance.
In this context of environmental variability and physiological adaptation in high-altitude ecosystems, the present study focused on Rhododendron anthopogon D.Don to investigate variations in gene expression patterns along an elevation gradient. It is an evergreen woody shrub ranging from the treeline to 4800 m above sea level, and is one of the dominating species in the Himalayan alpine regions (Sekar and Srivastava 2010; Thakur and Chawla 2019; Mangral et al. 2023; Dar et al. 2024). Rhododendron anthopogon is frequently exposed to significant environmental fluctuations over spatial and temporal gradients in its native habitat (Rathore et al. 2022). This species' tolerance to high-altitude environments makes it a promising candidate for molecular and functional research, perhaps providing insights into plant acclimation biology. Accordingly, the current study was carried out in the Himalayan region of Kashmir. Understanding the elevation-driven gene expression patterns in this species is critical for predicting its response to future climate shifts. Over the past few decades, this Himalayan area has seen significant effects from global warming, including accelerated glacial retreat, erratic precipitation patterns, and rising average temperatures (Murtaza and Romshoo 2017). The region's climate has changed drastically, especially in terms of the erratic behavior of seasonal temperatures and precipitation patterns (Dad et al. 2021; Mangral et al. 2023).
To the best of our knowledge, no study has been done on comparative transcriptome profiling of R. anthopogon along an elevation gradient in Kashmir Himalaya. In the present study, we hypothesized that (i) the gene expression patterns of R. anthopogon vary along an elevation gradient due to the presence of heterogeneous environmental conditions, (ii) variation in gene expression patterns related to primary and secondary metabolites in R. anthopogon plays an important role in responding to changing environmental conditions along the elevation gradient in its natural habitat, and (iii) variation in gene expression patterns may be responsible for the adaptation of R. anthopogon along an elevation gradient. Based on these hypotheses, we aimed to identify differentially expressed genes and gene co-expression networks (GCN) associated with differentially expressed genes in R. anthopogon along an elevational gradient. The findings of this study will provide insights into how alpine R. anthopogon adapts to environmental responses under global climate change. This study is novel in its use of elevation-specific transcriptome profiling to link gene expression patterns with altitudinal variations, offering a molecular-level understanding of climate-driven plant responses.
2 Materials and Methods
2.1 Study Area and Plant Sampling
We carried out the present study in the Apharwat Mountain, which is situated in the North-Western Himalayan area of India, in the Gulmarg region of Jammu and Kashmir. The study area is situated between 34° 05′ N latitude and 74° 38′ E longitude in the Kashmir region of the Himalaya (Mangral et al. 2023). The difference in elevation above sea level is between 2800 m at Gulmarg and 4200 m at Apharwat. This region has an average of 1049 mm of precipitation per year in a continental temperate climate. July has an average temperature of 20°C, making it the hottest month of the year; the coldest average temperature is recorded in January, dropping as low as −6°C (Hamid et al. 2021). Three different sampling sites were selected for the collection of plant material of R. anthopogon along an elevation gradient: Site-1 (3200 m), Site-2 (3500 m), and Site-3 (3900 m). At each site, fresh leaves of the same developmental stages were harvested from three healthy, young individuals with a minimum distance of 5 m apart. After being collected, the leaves were immediately stored in liquid nitrogen and brought to the laboratory, where they were kept at −80°C for further processing. Plants used in this study were identified by trained plant taxonomists. A voucher specimen of plant material (ID: 8827-KASH) was deposited in the herbarium at the Department of Botany, University of Kashmir, Srinagar.
2.1.1 RNA Extraction, cDNA Library Preparation, and Illumina Sequencing
Total RNA was isolated from frozen leaf tissues using the Spectrum Plant Total RNA Kit (Sigma Aldrich) according to the manufacturer's instructions. The quantity and purity of RNA were determined using a Nanodrop ND-1000 Spectrophotometer (Thermo Scientific) and validated using a 1.2% formamide agarose gel electrophoresis. After that, 5 μg of RNA samples were treated with DNase to get rid of any remaining genomic DNA. The Agilent Bioanalyzer 2100 system (Agilent Technologies) was used to check the RNA integrity number (RIN). For library preparation and sequencing, RNA samples having (RIN) larger than eight were used. For the preparation of RNA-sequencing libraries, we used the QIA-Seq Stranded mRNA library kit (Qiagen) following the manufacturer's instructions. The resulting cDNA libraries were measured using a Nanodrop spectrophotometer (Thermo Scientific), and the quality was confirmed with a Bioanalyzer (Agilent Technologies). The Illumina Novaseq 6000 platform (Illumina Incorporation) was used to sequence the cDNA library. The paired-end reads of 150 bp length were generated. The raw sequencing data has been deposited in the NCBI Sequence Read Archive under the BioProject accession number PRJNA1088916.
2.2 Assembly and Annotation of Transcripts
The quality of the paired-end raw reads was first checked through FASTQC v0.11.9 (https://www.bioinformatics.babraham.ac.uk/projects/fastqc/). Fastp v1.0.1 (Chen, Zhou, et al. 2018; Chen, Rao, et al. 2018) was used for trimming of adaptor sequences and the removal of low quality bases and reads using a Phred Score threshold of ≥ 30. The cleaned reads were de novo assembled using Trinity v. 2.9.1 (Grabherr et al. 2011). We excluded the contigs less than 300 bps for downstream analysis. Redundancy was removed using CD-HIT-EST (Li and Godzik 2006) using a sequence identity threshold of 0.90. The quality of the non-redundant assembly was evaluated through completeness assessment using the BUSCO v. 4.0.6 (Simao et al. 2015) and the embryophyta v10 dataset as reference, and through read-representation by employing Bowtie2 v2.5.4 to map the raw reads back to the de novo assembly (Langmead and Salzberg 2012). We used the TRAPID pipeline (Van Bel et al. 2013) for structural annotation of the assembled transcripts, with Plaza Dicot 4.5 (Van Bel et al. 2022) as reference and Asterids as the similarity search phylogenetic clade. Core gene family completeness was predicted through the identification of the Asterid gene families captured in the assembled transcripts of R. anthopogon using TRAPID with a conservation threshold of 0.9. Furthermore, functional annotations were assigned to the assembled transcripts by aligning them against SwissProt, KEGG, GO, NCBI non-redundant nucleotide, and InterPro databases.
2.3 Differential Gene Expression Analysis
Cleaned paired-end raw reads were mapped onto the transcriptome assembly using Bowtie2 (Langmead and Salzberg 2012). Then the read counts per gene were estimated using RSEM v1.1.11 (Li and Dewey 2011) to generate a count matrix. The estimated read count matrix was then normalized through Trimmed Mean of M-values (TMM) based normalization. We used PCA to examine the quality of the data and estimate their variance. Deseq2 implemented in the DEBrowser was used to estimate the fold change (FC) difference in the expression of each gene using a false discovery rate (FDR) cutoff of ≤ 0.05 and FC cutoff of ≥ 2 (Love et al. 2014; Kucukural et al. 2019). Gene Ontology (GO) enrichment analysis of the differentially expressed transcripts (DETs) was performed through TRAPID using an FDR cutoff value of 0.05. Pathway mapping of the DETs was evaluated by aligning against the KEGG database.
2.4 Gene Co-Expression Network
Gene co-expression network (GCN) has been used to study gene interactions and to identify groups of genes that have similar expression patterns across various conditions or time points. First, we determined transcription factors (TFs) in the R. anthopogon by aligning the assembled transcripts against the Plant Transcription Database (PlantTFDB) v.5.0 (Jin et al. 2016). The predicted TFs were then used as regulators to assess their relationship with the DETs. The GCN was constructed using three different algorithms: ARACNE (Margolin et al. 2006), CLR (Faith et al. 2007), and GENIE3 (Huynh-Thu et al. 2010). Subsequently, a consensus network was generated with BioNERO (Almeida-Silva and Venancio 2022) using nTrees = 10,000.
2.5 Validation of DEGs Using Quantitative Real-Time PCR (qPCR)
Total RNA was extracted from the fresh leaves of R. anthopogon from three different elevation gradients as described above for transcriptome analysis. cDNA was synthesized using a Verso cDNA synthesis kit (Applied Biosystems) according to the manufacturer's instructions. To validate the in silico expression of genes, 21 genes were selected for qRT-PCR. The qRT-PCR was performed using QuantStudio 6 Flex Real-Time PCR Systems (Applied Biosystems). Primers of these genes were designed using the Primer 3 program, as shown in (Table S1). For every gene, all biological replicates were examined, and for every biological replicate, three technical replicates were used. The cycle threshold (Ct) values obtained from the qPCR platform were analyzed to determine the relative gene expression employing the ΔΔCt approach (Livak and Schmittgen 2001). Spearman's correlation test was then employed to ascertain the correlation between the in silico determined expression value and the qRT-PCR-based expression values.
3 Results
3.1 Transcriptome Sequencing
The transcriptome of the leaves of R. anthopogon at three different altitudes: Site-1 (3200 m), Site-2 (3500 m), and Site-3 (3900 m) was generated in this study. A total of nine cDNA libraries representing three different altitudes (n = 3 for each altitude) were subjected to paired-end sequencing by the Illumina Novaseq platform. Illumina sequencing resulted in ~50 Gb paired-end reads. We obtained between 4.998 and 19.005 million reads and a GC content percentage of 47%–49% after trimming/removing adaptor sequences and low-quality reads/sequences.
3.2 De Novo Assembly and Functional Annotation
De novo transcriptome assembly through the Trinity software resulted in 180,074 transcripts. Following the removal of sequence redundancy through CD-HIT-EST and filtration of sequences < 300 bp, a non-redundant assembly was generated consisting of 92,592 transcripts for downstream analysis. The details of the assembly are provided in (Table 1). The GC content was determined to be 45.19%. BUSCO's assembly completeness assessment showed that out of the 1440 queried genes, 1214 were captured in our assembly, indicating 84.31% of the assembly completeness. Among them, 1125 (78.12%) were complete and 89 (6.1%) were partial in our assembly. The average number of orthologs per core gene was 1.26, and the percentage of detected core genes that have more than 1 ortholog was 21.60%. Read representation revealed that 92.12% of the reads mapped back to the assembly. The N50 value was found to be 1161 bp. Together, these results suggest a high quality of the assembly.
| Assembly statistics | |
| Total number of transcripts (nt) | 92,592 |
| Longest sequence (nt) | 13,303 |
| Shortest sequence (nt) | 301 |
| Mean sequence length (nt) | 847 |
| Median sequence length (nt) | 574 |
| N50 (nt) | 1161 |
| L50 (nt) | 21,132 |
| Number of sequences > 1 K (nt) | 25,599 |
| Number of sequences > 10 K (nt) | 3 |
| GC-content (%) | 45.19 |
| Assembly completeness assessment | |
| Total number of core genes queried | 1440 |
| Complete genes captured | 1125 |
| Partial genes captured | 89 |
| Complete + partial | 1214 |
| Number of missing core genes | 226 |
| Assembly annotation | |
| GO hits | 52,290 |
| InterPro hits | 52,080 |
| KEGG hits | 23,399 |
| SwissProt hits | 47,242 |
| NCBI nucleotide hits | 56,475 |
| TAIR hits | 53,952 |
| Number of full-length transcripts | 16,146 |
| Number of partial transcripts | 16,602 |
TRAPID predicted ORFs for 92,382 transcripts with an average ORF length of 539. Approximately 38,331 (41.4%) transcripts possessed a start codon, while 62,439 (67.4%) possessed a stop codon. A total of 16,146 (17.4%) transcripts were meta-annotated as full-length, 18,915 (20.4%) as quasi-full-length, and 16,602 (17.9%) as partial in length based on transcript length to the predicted open reading frames (ORFs; Supporting Information File S1). A similarity search against Asterids showed a total of 52,080 hits, with the highest number of hits against Actinidia chinensis 21,536 (41.35%) followed by Coffea canephora 7215 (13.85%) and Daucus carota 4391 (8.43%). Further, 52,080 (56.2%) transcripts were assigned to 7634 gene families, with 6056_HOM04D000001 as the largest gene family consisting of 355 transcripts. Assessment of core gene family completeness revealed that out of 4664 core gene families queried, 4566 were captured in the R. anthopogon assembly, suggesting 96.9% completeness. Moreover, 8485 unique GO terms were successfully assigned to 52,290 (56.5%) transcripts, and 6998 unique InterPro domains were predicted for 52,080 (56.2%) transcripts (Supporting Information File S2).
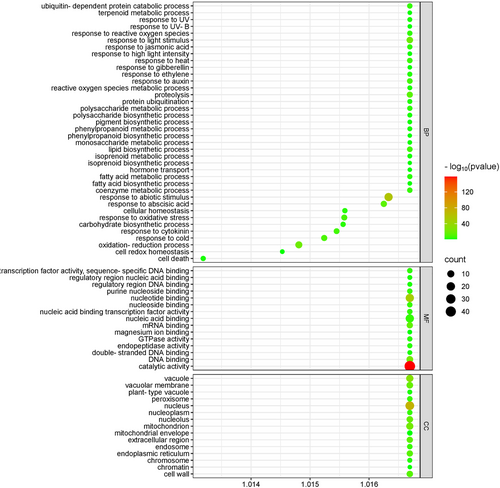
Functional annotation against SwissProt, TAIR, NCBI non-redundant nucleotide, and KEGG databases showed that 68,745 (74.29%) of the unique transcripts were functionally annotated by different databases, whereas 19.73% of the transcripts were annotated by all the databases (Figure S1, Table 1). GO enrichment analysis revealed 555 significantly enriched GO terms at 5% FDR in biological processes (BP), 123 GO terms in molecular functions (MF), and 100 GO terms in cellular components (CC; Figure 1, Supporting Information Files S3 and S4). Important enriched GO BPs include carbohydrate metabolic process (GO:0005975), polysaccharide metabolic process (GO:0005976), monosaccharide metabolic process (GO:0005996), proteolysis (GO:0006508), ubiquitin-dependent protein catabolic process (GO:0006511), fatty acid biosynthetic process (GO:0006633), lipid biosynthetic process (GO:0008610), isoprenoid metabolic process (GO:0006720), terpenoid metabolic process (GO:0006721), isoprenoid biosynthetic process (GO:0008299), response to cold (GO:0009409), response to UV (GO:0009411), response to light stimulus (GO:0009416), response to high light intensity (GO:0009644), phenylpropanoid biosynthetic process (GO:0009699), response to UV-B (GO:0010224), carbohydrate biosynthetic process (GO:0016051), secondary metabolic process (GO:0019748), cell redox homeostasis (GO:0045454), pigment biosynthetic process (GO:0046148), and reactive oxygen species metabolic process (GO:0072593).
3.3 Differential Gene Expression Analysis
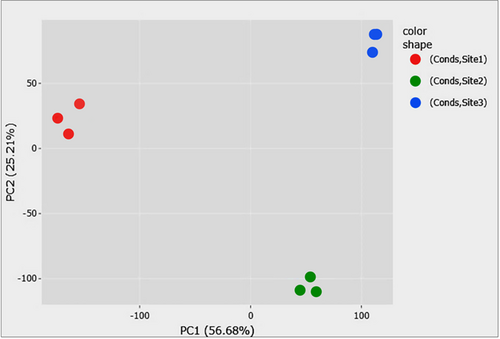
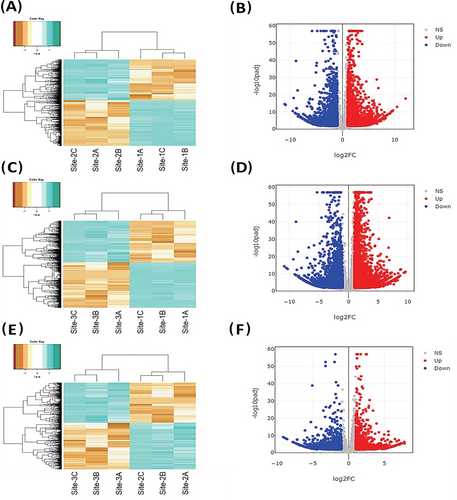
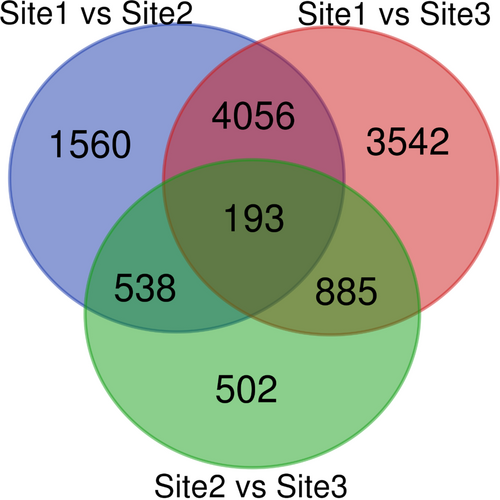
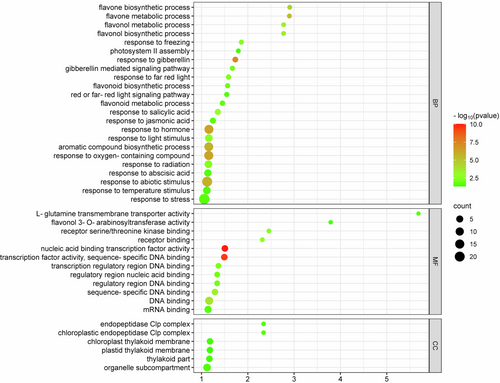
Dimensionality reduction was done using PCA with PC1 and PC2 explaining 56.68% and 25.21% variation in the data, respectively (Figure 2). Deseq2 resulted in 6347 differentially expressed transcripts between Site-1 (3200 m), and Site-2 (3500 m), with 2970 up-regulated and 3377 down-regulated at Site-1 (3200 m) as compared to Site-2 (3500 m). Furthermore, 8676 transcripts were differentially expressed between Site-1 (3200 m) and Site-3 (3900 m), with 4142 up-regulated and 4534 down-regulated transcripts in Site-1 (3200 m), as compared to Site-3 (3900 m). Moreover, 2118 transcripts were differentially expressed between Site-2 (3500 m), and Site-3 (3900 m), with 979 up-regulated and 1139 down-regulated transcripts in Site-2 as compared to Site-3 (Figure 3, Supporting Information File S5). One-hundred and ninety-three transcripts were differentially expressed across all the comparisons, while there were 1560 unique DETs between Site-1 (3200 m) versus Site-2 (3500 m), 3542 between Site-1 (3200 m) versus Site-3 (3900 m), and 502 between Site-2 (3500 m) versus Site-3 (3900 m; Figure 4). GO enrichment analysis of the DETs showed 147 GO terms significantly enriched in BP, 12 GO terms enriched in MF, and six GO terms enriched in CC (Figure 5, Supporting Information File S6). Important BPs include response to reactive oxygen species (GO:0000302), response to temperature stimulus (GO:0009266), response to freezing (GO:0050826), response to radiation (GO:0009314), response to light stimulus (GO:0009416), flavonoid biosynthetic process (GO:0009813), flavonoid metabolic process (GO:0009812), aromatic compound biosynthetic process (GO:0019438), response to UV (GO:0009411), flavone biosynthetic process (GO:0051553), flavone metabolic process (GO:0051552) and fatty acid biosynthetic process (GO:0006633). We have also performed the KEGG enrichment analysis and the results of that are presented in Supporting Information (Figure S2).
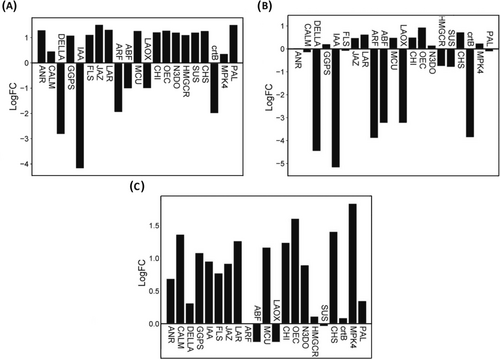
To confirm the results of RNA-Sequencing data, we analyzed the expression patterns of 21 randomly selected differentially expressed transcripts using qRT-PCR analysis (Figure 6). qRT-PCR analysis of the selected transcripts showed a significant correlation with the in silico expression analysis, with R = 0.87 and p = 2.1e-07, R = 0.79 and p = 1.8e-05, and R = 0.64 and p = 0.0019 for Site-1 (3200 m) versus Site-2 (3500 m), Site-1 (3200 m) versus Site-3 (3900 m), and Site-2 (3500 m) versus Site-3 (3900 m), respectively. These results endorse the accuracy and efficiency of the de novo assembled transcripts and differential gene expression analysis (Figure S3).
3.4 Gene Co-Expression Network Analysis
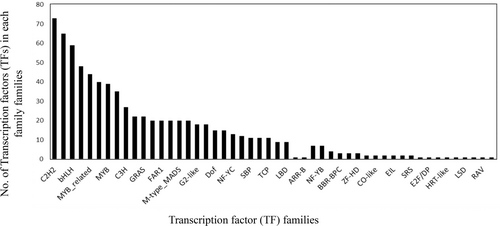
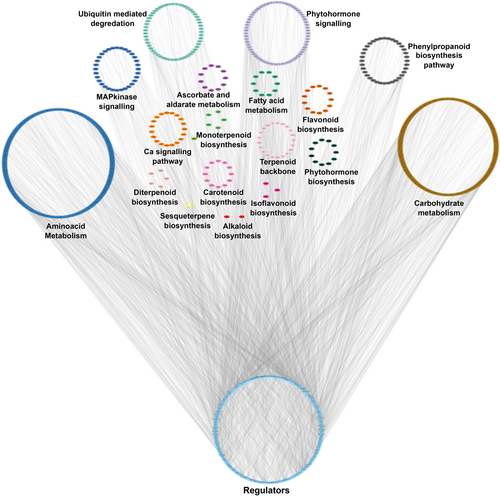
A total of 778 TFs belonging to 50 unique TF families were identified in the R. anthopogon assembly by aligning the transcripts against PlantTFDB. C2H2, bZIP, bHLH, ERF, MYB, MYB_related, and WRKY were the top TF families in our assembly (Figure 7). Among these 778 TFs, 200 were differentially expressed in at least one comparison (Supporting Information File S7). Furthermore, among all the KEGG mapped transcripts, 4587 belonged to amino acid metabolism, ascorbate and aldarate metabolism, calcium signaling pathway, carbohydrate metabolism, fatty acid metabolism, MAP Kinase signaling, phytohormone biosynthesis, phytohormone signaling, alkaloid biosynthesis, terpenoid backbone biosynthesis, monoterpenoid biosynthesis, diterpene biosynthesis, gibberellic acid (GA) biosynthesis, sesquiterpene and triterpene biosynthesis, carotenoid biosynthesis, flavonoid biosynthesis, flavone and flavonol biosynthesis, isoflavonoid biosynthesis, phenylpropanoid biosynthesis, and ubiquitin-mediated degradation (Figure 8; Supporting Information File S8). Among these 4587 transcripts, 891 were found to be differentially expressed in at least one comparison. A GCN was constructed using these 891 transcripts along with 200 differentially expressed TFs. GCN resulted in a total of 2287 interactions between the regulators and target genes. A total of 200 TFs belonging to 36 families were found to be putatively involved in regulating the above-mentioned primary and secondary metabolic pathways of R. anthopogon in response to changes in altitude. Around 58.5% (117/200) of the network interactions involve 10 TF families: 18 NAC, 16 ERF, 14 MYB-related, 13 MYB, 11 CH2, 11 WRKY, 10 bZIP, 9 bHLH, 7 MIKC, and 8 FAR1. GRN also showed that the TFs could regulate between one and 31 target genes, with a median out-degree of 10 (Figure 8; Supporting Information File S8). A total of 11 sub-clusters/modules were obtained using ClusterViz, each consisting of a set of regulators and target genes (Supporting Information Files S9 and S10).
4 Discussion
4.1 Gene Expression Patterns of R. anthopogon Vary Along an Elevation Gradient
Plants growing at higher-elevation environments are subjected to various abiotic stresses compared to those growing at low and moderate elevations. These stresses include low oxygen levels, intense UV light, and rapid temperature fluctuations (Ye et al. 2023). As a result, these plants are forced to undergo a range of adaptive genetic changes, including changes at the transcriptome level (Liu, Wang, and Shen 2022; Tang et al. 2022; Nong et al. 2023; Ye et al. 2023; Pavy et al. 2025). The present study elucidated gene expression dynamics of R. anthopogon and revealed key enriched GO biological processes in response to altitude changes such as response to reactive oxygen species (ROS), response to temperature stimulus, response to freezing, response to radiation, response to light stimulus, carbohydrate metabolic process, flavonoid biosynthetic process, flavonoid metabolic process, aromatic compound biosynthetic process, response to UV, terpenoid metabolic process, fatty acid biosynthetic process, and phytohormone biosynthesis. This predicts that genes of these processes may be potential contributors to R. anthopogon adaptation along an elevation gradient.
High-altitude plants require extra energy to withstand environmental stress, and the primary metabolic process that gives energy to cells is the metabolism of carbohydrates (Ma et al. 2015; Liu, Wang, and Shen 2022). In the present study, 10 carbohydrate metabolism-related genes were found to be differentially expressed, such as petC, psaK, LAPX.3, psaF.1, GST.15, T6PP.4, psaD, bglB.1, psbQ.3, and psbP.1 along the elevation gradient in R. anthopogon, with a general trend of up-egulation at higher altitudes (Figure S4a). Photosynthesis is a vital physiological mechanism that drives plant growth and development. Harsh environmental conditions, particularly cold temperatures, can significantly alter the process (Zhang et al. 2009). In the present study, several key genes associated with the photosynthetic machinery were found to be differentially expressed between Site-1 (3200 m) and Site-3 (3900 m) in R. anthopogon (Figure S4b). Among these, psbP.1 exhibited the most pronounced upregulation (Log2FC = 7), suggesting a strong elevation-dependent increase in expression. Moderate upregulation was also observed for psaF.1, psb27, psbY.1, psaD, psbQ.3, and petC, all of which are involved in the assembly, stability, and protection of photosystem I and II complexes. Conversely, psbB and psaK were downregulated at Site-3 in comparison to Site-1. These expression changes suggest an adaptive modulation of the photosynthetic apparatus, likely aimed at maintaining energy production and minimizing photodamage in the challenging alpine environment. These genes encode key components of the photosystem I and II complexes involved in light-dependent reactions of photosynthesis. Their expression is critical for maintaining photosynthetic efficiency and adaptation under environmental stress, especially at high altitudes (Weisz et al. 2017; Zabret et al. 2021; Zhou et al. 2022). The LAPX.3 gene, encoding L-ascorbate peroxidase, and GST.15, a glutathione S-transferase, are involved in reactive oxygen species (ROS) detoxification and helping mitigate oxidative stress at higher altitudes (Hasanuzzaman et al. 2019; Pane et al. 2024). Additionally, T6PP.4, linked to trehalose metabolism, aids in stabilizing proteins and membranes under stress, while bglB.1 facilitates glucose release for energy metabolism (Nirupama et al. 2018; Zhang et al. 2025). Together, the coordinated upregulation of these genes at higher elevations highlights a comprehensive adaptive response involving altered energy production and photoprotection, enabling R. anthopogon to thrive in the harsh alpine conditions of the Kashmir Himalaya.
Reactive oxygen species (ROS) production increases in plants under stressful environmental circumstances and has the potential to seriously harm plant cells (Caverzan et al. 2012; Hendrix et al. 2025). The ascorbate-glutathione cycle is a significant mechanism in plant cells that detoxifies hydrogen peroxide. Ascorbate peroxidase (APX) enzymes are essential in this cycle because they catalyze the conversion of H2O2 into H2O by employing ascorbate as a particular electron donor. Under biotic and abiotic stress conditions, as well as throughout plant growth, the expression of APX genes is regulated (Caverzan et al. 2012). In this study, the L-ascorbate peroxidase (LAPX.2) was found to be upregulated at Site-3 compared to both Site-1 and Site-2 (Figure S4c), indicating a role in ROS detoxification at higher elevations (Hasanuzzaman et al. 2019; Pane et al. 2024). Similarly, AOR (aldehyde oxidoreductase) showed a robust upregulation at Site-3 compared to Site-1 suggesting increased capacity for ROS detoxification under high-elevation stress. In contrast, XDH (xanthine dehydrogenase), a key enzyme in ROS generation, was downregulated at Site-3 in comparison to Site-1, potentially as a protective mechanism to minimize ROS accumulation in stress-prone alpine environments (Ma et al. 2016; Xu et al. 2022; Yesbergenova et al. 2005). Other ROS-related genes such as TCHQD, NADPH oxidase, kat.E2, and SLC25A4S demonstrated moderate expression changes, reflecting their supportive roles in oxidative stress mitigation. These patterns collectively suggest a coordinated enhancement of ROS-scavenging systems and suppression of ROS-generating enzymes, enabling R. anthopogon to better withstand oxidative stress at higher elevations.
Furthermore, genes responsive to light signaling, BIC (Blue-light Inhibitor of Cryptochrome), PKS (Phytochrome Kinase Substrate), and SPA (Suppressor of Phytochrome A) were found to be downregulated at higher elevation gradients compared to Site-1 (Figure S4d). BIC negatively regulates cryptochrome signaling by preventing cryptochrome oligomerization (Wang et al. 2016), while PKS and SPA participate in phytochrome-mediated photomorphogenic pathways. The downregulation of these genes at higher altitudes likely reflects an adaptive strategy to modulate excessive light responses, reduce photooxidative damage, and conserve energy under intense solar and UV radiation typical of alpine ecosystems (Menon et al. 2016). This adjustment supports developmental stability and photoprotection, contributing to altitude-related adaptation in R. anthopogon. Moreover, heat shock proteins/molecular chaperones play a crucial role in maintaining cellular homeostasis in both favorable and unfavorable growth conditions (Renaut et al. 2005). These are essential for the restoration of normal protein conformations (Ma et al. 2015). In this study, “heat shock proteins” such as HSA32 (Heat-Stress-Associated 32-kDa protein) were significantly upregulated at higher elevations, both at Site-3 and Site-2 in comparison to and Site-1. These findings are consistent with previous research indicating increased expression of HSP-encoding genes during cold acclimation (Deng et al. 2020; Rathore et al. 2022).
Plant growth, development, and reproduction are adversely impacted by cold stress. Plants show robust adaptability to higher altitude-driven cold stress by reprogramming their gene expression (Viswanathan and Zhu 2002). In the present study, Cold-Regulated 413-Transmembrane Protein (COR413-TM) and Cold-Regulated Protein Kinase (CRPK) genes were found significantly upregulated at Site-3 compared to Site-1 (Figure S4e). The CRPK has a pivotal role in initiating cold-responsive signaling cascades under low-temperature stress (Liu, Jia, et al. 2017), while COR413-TM is known for its function in stabilizing plasma membranes during freezing conditions (Ruibal et al. 2020). Additionally, transcription factors ICE1/2 (Inducers of CBF Expression) and IBF/DREB1 (Dehydration-Responsive Element-Binding Protein 1), which are key regulators of cold-inducible gene networks, also displayed consistent upregulation at higher elevations. These genes are integral components of the ICE-CBF-COR pathway, a well-characterized cold acclimation mechanism in plants. CRPKs, in particular, are known to modulate transcriptomic responses to declining temperatures, facilitating stress adaptation (Liu, Jia, et al. 2017). Collectively, the upregulation of these cold-responsive genes along the elevation gradient reflects an adaptive molecular strategy in R. anthopogon, enhancing cellular stability and physiological resilience under low-temperature and high-radiation conditions typical of alpine habitats. These results prove our first hypothesis that gene expression patterns of R. anthopogon vary along an elevation gradient due to the presence of heterogeneous environmental conditions, particularly light and temperature extremes.
Plants use fatty acids and their derivatives as the primary lipids in their cell membranes and for the storage of energy. These chemicals help plants become more resilient to environmental stress by regulating their fundamental immunity. High fatty acid levels are a constant feature of species that thrive at high altitudes (Roden et al. 2000; Zhao et al. 2023). In this context, we also observed upregulation of FAD2.2 and FabF.2 at higher elevations at Site-3. FAD2 and FabF, enriched in the fatty acid biosynthesis pathway, are well documented for their role in cold and salt stress tolerance in high-altitude plants (Moche et al. 2001; Liu, Jia, et al. 2017). In plants, FAD2 expression is efficiently regulated by temperature, light, and wounding. Various plant tissues express the FAD2 genes in various ways, and its overexpression alters physiological and vegetative traits. Dienoic fatty acids are more abundant when FAD2 is active, which increases resistance to salt and cold stress. FabF is usually involved in fatty acid biosynthesis (Moche et al. 2001). Our results are consistent with other previous studies, wherein similar findings were observed (Freihat et al. 2008; Liu, Wang, et al. 2017). Fatty acyl-ACP thioesterase B (FatB), another upregulated gene at Site-3 found in our study, plays an important role in fatty acid biosynthesis and hydrolyzes acyl-ACP thioesters to release free fatty acids, crucial for membrane lipid composition. Under stress conditions like cold and drought, increased saturated fatty acids help stabilize membranes (Ohlrogge and Browse 1995; Li-Beisson et al. 2013). At high altitudes, upregulation of FatB in R. anthopogon likely enhances membrane rigidity, supporting cellular stability and stress resilience in harsh alpine environments. The primary information transmission mechanism used by plants to respond to environmental stress at higher elevations is plant hormone signal transduction, and the phosphorylation and dephosphorylation of proteins is one of its major regulating mechanisms (Waadt et al. 2022).
4.2 Gene Expression Changes Are Responsible for the Adaptation of R. anthopogon Along an Elevation Gradient
Evolutionary pressure on genes is important for the behavior of species or for the adaptive features that are important to the species' survival and ability to respond to stressful conditions (Guo et al. 2018). Thus, for a better understanding of plant molecular adaptation to altitude, analyzing the differentially expressed genes of R. anthopogon along the elevation gradient might be helpful (Sun et al. 2018). The primary information transmission mechanism used by plants to respond to environmental stress at higher elevations is plant hormone signal transduction, and the phosphorylation and dephosphorylation of proteins is one of its major regulating mechanisms (Liu, Khan, and Gan 2022). Under abiotic stresses such as drought, salinity, extreme temperatures, and light fluctuations, phytohormones like abscisic acid (ABA), jasmonic acid (JA), salicylic acid (SA), ethylene (ET), gibberellins (GA), and auxins initiate specific signaling cascades that enable plants to adapt and survive under adverse environmental conditions (Peleg and Blumwald 2011; Verma et al. 2016; Das et al. 2025). These phytohormones also interact with each other in complex crosstalk networks to fine-tune the stress responses, ensuring plant resilience in variable climates (Kazan 2015). In this study, JAZ.6 was found to be upregulated at Site-3. JAZ is a critical component of the jasmonic acid (JA) signaling system that influences plant responses to biotic and abiotic stresses (Liu, Sun, et al. 2017). Jasmonic acid plays a pivotal role in plant adaptation by modulating stress responses and reallocating resources from growth to defense under harsh conditions (Liu, Sun, et al. 2017). PR1.1 (pathogenesis-related protein 1), an important gene involved in the defense mechanism against pathogens, was found to be upregulated at Site-3. SnRK2.1, a serine/threonine kinase critical for ABA-dependent abiotic stress responses, was also notably upregulated, suggesting its involvement in high altitude-mediated cold stress tolerance (Nakashima et al. 2009). Additionally, moderate upregulation of copA.1 (a putative copper transporter), CALM.1 (a calcium sensor calmodulin protein), and CTR1.1 (a negative regulator of ethylene signaling) indicates the activation of multiple hormonal and calcium-mediated signaling pathways crucial for maintaining homeostasis under stress. Furthermore, plants activate the MAPK signaling pathway in response to various biotic and abiotic stresses (Kumar et al. 2020). In the present study, several MAP kinase-associated genes were significantly upregulated at Site-3 in comparison to Site-1 (Figure S4f). Together, the coordinated elevation in the expression of these MAPK pathway genes suggests that R. anthopogon fine-tunes its hormonal and stress signaling networks as a key adaptive strategy to survive the harsh conditions at higher altitudes.
During specific developmental phases, plants synthesize a variety of secondary metabolites, including terpenoids, which are crucial for environmental adaptation. In R. anthopogon, several key genes associated with the terpenoid backbone biosynthesis pathway were significantly upregulated at Site-3 compared to Site-1 (Figure S4g). Among these, GGPS.2 and DXS showed the highest upregulation (Log2FC > +2.5), suggesting enhanced flux through the terpenoid biosynthetic route at higher elevations. Other genes, such as GGPS.1, GERD, ispH, ispS.1, HMGCR.1, and 10HGO, also displayed moderate upregulation, indicating an overall elevation-driven amplification of terpenoid metabolism. Terpenoids, the largest class of plant secondary metabolites, play pivotal roles in plant defense against herbivores, pathogens, and abiotic stresses; they also attract pollinators and act as allelochemicals influencing interspecies competition (Boncan et al. 2020; Ruiz-Sola et al. 2016). In Rhododendron species, volatile terpenoids are major constituents of floral fragrances, critical for attracting pollinators, especially important at higher altitudes where pollinator availability is limited (Wang et al. 2021). The upregulation of terpenoid biosynthesis genes in R. anthopogon along an elevation gradient suggests a strategic enhancement of volatile and structural terpenoids to counteract environmental stresses such as increased UV radiation, low temperatures, and reduced biotic interactions. These findings emphasize the critical role of terpenoid metabolism in high-altitude adaptation.
Flavonoids are essential components for environmental adaptability and self-defense, a part of their significance as secondary metabolites (Tong et al. 2020). The accumulation of flavonoids can improve drought resistance in a variety of ways (Jaakola 2013; Zhao et al. 2016). In the present study, several key genes involved in the flavonoid biosynthesis pathway were significantly upregulated in R. anthopogon at Site-3 compared to Site-1, indicating a robust elevation-dependent transcriptional response (Figure S4h). Notably, LAR.1 (Log2FC ≈ +3.2) and ANS (Log2FC ≈ +2.7) exhibited the highest expression changes, suggesting a strong enhancement of flavonoid and anthocyanin production at higher altitudes. Other genes, including CHS.1, CHI.1, DFR.1, CYP75A, CYP75B1, and F3H.1, also showed consistent upregulation (Log2FC ≈ +1.2 to +2.5), reinforcing the coordinated activation of the flavonoid biosynthetic pathway. Flavonoids shield plants against UV-B radiation (Naing and Kim 2021). UV radiation generally increases with elevation (Körner 2007; Majeed et al. 2020) influencing plant physiological processes, growth, and differentiation (Frohnmeyer and Staiger 2003). Flavonoids, particularly anthocyanins, contribute significantly to the color of flowers (Chen, Zhou, et al. 2018; Chen, Rao, et al. 2018). Anthocyanins, a flavonoid type, are responsible for species' tolerance to harsh conditions (Kaur et al. 2023). Furthermore, studies have revealed that low temperatures hinder the synthesis of anthocyanins and are associated with high light intensity and low temperatures in high elevations (Kim et al. 2017; Naing and Kim 2021). Our study revealed that higher expression of flavonoid biosynthesis pathway genes may play an important role in the adaptation of R. anthopogon in stress conditions at higher elevations and raise the production of flavonoids.
Additionally, plants have sophisticated defense mechanisms to fight pathogens. Phenylpropanoids operate as both preformed and inducible antimicrobial signals during plant pathogen defense (Dixon et al. 2002; Tohge et al. 2017; Singh 2025). The phenylpropanoid pathway produces monolignols, the components needed for the production of lignin, and the phenolic compounds needed for plant disease resistance (Dong and Lin 2021; Li et al. 2022). In the present study, several genes involved in the phenylpropanoid biosynthesis pathway were found to be significantly upregulated in R. anthopogon across elevation gradients (Figure S4i). Notably, POX.2, CAD.1, and 4CL.1 exhibited strong and consistent upregulation at both Site-1 and Site-2 compared to Site-1, indicating enhanced lignin biosynthesis and cell wall reinforcement under high-altitude stress conditions. Additionally, PAL.2, a key entry-point enzyme of the phenylpropanoid pathway, was specifically upregulated at Site-3 compared to Site-1 (Log2FC ≈ 1.3), reflecting increased flux into phenolic compound biosynthesis. Genes like SOHCT.1, SOHCT.3, and CAD.4 also demonstrated moderate but elevation-correlated expression changes, contributing to monolignol and antimicrobial compound production. This predicts that R. anthopogon is well equipped with a pathogen invasion defense response system to tackle harsh environmental conditions in alpine regions.
In the present study, gene co-expression network (GCN) analysis was utilized to identify regulatory interactions between transcription factors (TFs) and differentially expressed transcripts (DETs) along the elevation gradient in R. anthopogon. From the 200 TFs belonging to 36 families, only those with direct node interactions to functionally important genes were considered for detailed interpretation. Notably, NAC transcription factors demonstrated direct regulatory links with PAL.2, a key gene in phenylpropanoid biosynthesis, which is crucial for lignin and flavonoid production under environmental stress. Specifically, NAC-27, NAC-9, and NAC-26 were strongly co-expressed with PAL.2, indicating their possible role in modulating defense and secondary metabolite biosynthesis at higher altitudes. NAC TFs are widely recognized for orchestrating complex stress-response mechanisms, including ROS detoxification and hormone signaling (Lv et al. 2020; Sakuraba et al. 2020; Han et al. 2025). Furthermore, ERF-32, bHLH-42, and NAC TFs showed direct interactions with JAZ.6, a jasmonate signaling regulator involved in biotic and abiotic stress tolerance. Several members of the JAZ gene family, each with its own biological function, are involved in the control of plant growth, responses to abiotic stresses, and plant development (Pieterse et al. 2014). For instance, by altering the JA level and the JA signal transduction pathway, overexpression of the OsJAZ9 gene increases rice's tolerance to potassium deficiency (Singh et al. 2020). The tolerance of transgenic lines to salt stress was markedly increased by overexpression of the GsJAZ2 gene in soybeans (Zhao et al. 2020). In Arabidopsis thaliana, overexpressing AtJAZ1 can increase host resistance to Spodoptera exigua (Chung et al. 2008). These interactions highlight a sophisticated regulatory module in R. anthopogon that integrates hormonal and secondary metabolic responses to altitude-induced stressors. Collectively, the identified TF–target gene relationships suggest that a subset of transcription factors, particularly from NAC, ERF, and bHLH families, may be central to orchestrating metabolic reprogramming, enabling R. anthopogon to adapt effectively to the harsh conditions encountered along the elevation gradient.
5 Conclusions
In the present study, the comparative transcriptome profiling of R. anthopogon revealed differentially expressed transcripts along an elevation gradient in Kashmir Himalaya. By comparing different sites, the number of unique differentially expressed transcripts was found to be higher between Site-1 (3200 m) versus Site-3 (3900 m), as compared to Site-1 (3200 m) versus Site-2 (3500 m), and Site-2 (3500 m) versus Site-3 (3900 m), revealing a positive correlation along an elevation gradient. Most of the important DETs were significantly enriched in biological processes predicting that genes of these processes are the potential contributors to R. anthopogon adaptation along an elevation gradient. We observed that most of the genes enriched in carbohydrate metabolism and photosynthesis-related genes were found to be upregulated with a rise in altitude. Thus, the up-regulation of important photosynthetic genes observed in the present study demonstrates their essential role in assisting R. anthopogon in adjusting to the hostile environment of the high altitudes of Kashmir Himalaya. We found that key genes for secondary metabolite production were largely expressed in R. anthopogon. We also found that higher expression of flavonoid biosynthesis pathway genes may play an important role in the adaptation of R. anthopogon in stress conditions at higher elevations and raise the production of flavonoids.
By using GCN analysis to elucidate the interaction between targeted genes and regulators, we found that 200 TFs belonging to 36 families were putatively involved in regulating important primary and secondary metabolic pathways of R. anthopogon in response to changes in altitude. Thus, the present study shed light on the regulatory networks involved in the identification of the candidate key TFs for the regulation of primary and secondary metabolic pathways of R. anthopogon. The findings of this study add to our understanding of how alpine plants respond to the varied environmental conditions induced by altitude in the face of global climate change. The elevation-dependent transcriptomic variations observed in R. anthopogon not only underscore the species' ability to adapt to diverse environmental pressures but also provide valuable insights into the genetic basis of climate resilience in alpine plants. The identified genes and pathways associated with stress responses and secondary metabolism could serve as potential targets for future studies aiming to enhance stress tolerance in other high-altitude or climate-sensitive species. Overall, our findings contribute to a broader understanding of plant adaptation strategies and offer molecular tools to inform conservation and breeding programs under changing climatic conditions.
Author Contributions
Z.A.M. wrote the original draft and was involved in formal analysis and data curation. S.U.I. was involved in the collection of plant material and data curation. A.M. took part in formal analysis and investigation. L.T. was involved in the collection of plant material and data curation. S.G. was responsible for writing, reviewing, editing, conceptualization, and validation. S.K.B. was involved in reviewing, editing, and validation. T.U.H.D. was involved in conceptualization, supervision, writing, reviewing, editing, and validation.
Acknowledgments
We are thankful to Dr. A. A. Shah, Associate Dean, School of Biosciences and Biotechnology, Baba Ghulam Shah Badshah University, Rajouri. We also thank Akthar Hussain Malik for the identification of plant material. The financial support received from the Department of Biotechnology (DBT), Govt. of India, New Delhi to Tanvir-Ul-Hassan Dar under grant no: BT/PR29259/FCB/125/2/2018 is highly acknowledged.
Open Research
Data Availability Statement
The raw sequencing data has been deposited in the NCBI Sequence Read Archive under the BioProject accession number PRJNA1088916.


