TaCCS1-B expression modulates copper, enzymatic antioxidants and polyphenols contents and provides abiotic stress tolerance in transgenic Arabidopsis
Abstract
Abiotic stress, including osmotic and salinity stress, significantly affects plant growth and productivity. Copper chaperone for superoxide dismutase (CCS) is essential for copper homeostasis and oxidative stress management. In this study, we investigated the role of the TaCCS1-B gene of bread wheat in enhancing stress tolerance in yeast and transgenic Arabidopsis. Expression of TaCCS1-B increased abiotic stress tolerance in recombinant yeast cells. Phenotypic analysis of Arabidopsis TaCCS1-B expressing lines demonstrated that they exhibited significantly higher germination rates, increased root length and better growth under osmotic and salinity stress than wild type. Additionally, the transgenic lines exhibited higher copper accumulation and enhanced photosynthetic pigments and proline level, coupled with reduced hydrogen peroxide (H₂O₂) and malondialdehyde (MDA) contents. They also showed higher enzymatic antioxidants' activities, indicating reduced oxidative stress in transgenic lines, resulting in reduced flavonoid content. Gene expression analysis indicated modulated expression of stress-responsive genes in the transgenic lines under stress conditions. These findings suggested the role of TaCCS1-B in enhancing stress tolerance by improving copper homeostasis and regulating key stress-responsive genes. This study highlights the potential of TaCCS1-B for the development of better stress resilience crops, which is critical for sustaining agricultural productivity for food security under adverse environmental conditions.
1 INTRODUCTION
Plants have developed an intricate antioxidant defense system to avoid the buildup of superoxide radicals within cells. This system comprises superoxide dismutase (SOD) enzymes that can effectively eliminate O2•− by transforming it into H2O2 and molecular oxygen (O2) through a dismutation reaction, thereby preventing its accumulation (Halliwell 2006). SODs are a group of enzymes found in plants that help protect them from oxidative stress (Tyagi et al. 2019). There are three types of SODs found in plants: copper/zinc SODs (Cu/ZnSODs), iron SODs (FeSODs), and manganese SODs (MnSODs). Cu/ZnSODs exist as homodimers and require both copper (Cu) and zinc (Zn) for catalytic activity (McCord & Fridovich 1969; Perry et al. 2010). FeSODs also exist as homodimers in lower organisms and some plant species, but they form tetramers in most of the higher plants by involving iron (Fe) as a metal cofactor. In contrast, MnSODs form a homodimer or a homotetramer and entail one manganese (Mn) atom per subunit for activity (Kliebenstein et al. 1998; Alscher et al. 2002). Each type of SOD has a specific role in protecting the plant from oxidative stress. They have been shown to play a crucial role in protecting plants from environmental stress, such as drought, salinity, UV radiation, and heavy metal toxicity (Del Río et al. 2018; Tyagi et al. 2019). Among these, Cu/ZnSODs are the most ubiquitous and present in the cytosol, chloroplast, peroxisome and extracellular space (Alscher et al. 2002), while MnSODs are found in the mitochondria and peroxisomes and FeSODs in chloroplasts (Kliebenstein et al. 1998; Alscher et al. 2002).
The structural stability of Cu/ZnSOD is reliant on zinc, while copper facilitates the disproportion of superoxide as a catalyst (Perry et al. 2010). The acquisition of Zn to Cu/ZnSOD is through passive diffusion; however, to facilitate Cu transfer, the copper chaperones are necessary for the cell (Valentine and Gralla 1997). Plants require Cu as a vital micronutrient for various biochemical and physiological functions. Nevertheless, excessive accumulation of Cu in plants can have harmful effects, such as the initiation of oxidative stress (Małecka et al. 2009; Rocchetta & Küpper 2009). Therefore, Cu chaperones play a crucial role in ensuring that Cu is delivered to the correct target proteins and is protected from oxidation. This helps to prevent Cu toxicity and maintain proper Cu homeostasis in plants (Burkhead et al. 2009).
ATX1 was the first Cu chaperone discovered; it primarily directs Cu into the Golgi vesicles. Another chaperone, COX17, is responsible for delivering Cu to mitochondrial cytochrome c oxidase. Lastly, a third chaperone named CCS (copper chaperone for SOD1) plays a crucial role in inserting Cu into Cu/ZnSOD1 (Culotta et al. 1997; Sagasti et al. 2011). Initially, the occurrence and importance of CCS protein were reported in humans and yeast (Culotta et al. 1997; Casareno et al. 1998). Later on, the homologous of CCS have been identified in various plant species such as Arabidopsis (Abdel-Ghany et al. 2005), maize (Ruzsa and Scandalios 2003), potato (Trindade et al. 2003), and tomato (Zhu et al. 2000). Numerous studies have investigated CCS proteins in animals, including the protective role of CCS against neuronal cell death and ischemic injury, highlighting its potential for therapeutic applications in certain human diseases (Choi et al. 2005). However, studies on CCS proteins in plants remain limited. In plants, the CCS protein is involved in the regulation of Cu/ZnSOD activity, and its expression is regulated by various environmental cues, such as light, temperature, and nutrient availability. The miRNA-mediated regulation of CCS proteins is known in Arabidopsis, with miR398 specifically targeting mRNAs encoding CCS1 by cleavage and translational inhibition (Beauclair et al. 2010). The importance of CCS in plants is highlighted by its role in enhancing abiotic stress tolerance, such as drought, salinity, and heavy metal stress (Abdel-Ghany et al. 2005; Du et al. 2021; Jiao et al. 2023).
The structure of CCS is conserved among plants, with homologs identified in both dicot and monocot species. CCS is a small protein with a molecular weight of approximately 26–30 kDa and consists of 274–300 amino acid residues (Sagasti et al. 2011). It is characterized by three conserved domains involved in copper binding and delivery to SOD (Schmidt et al. 1999). The N-terminal region of the protein possesses domain I, resembling an ATX1-like polypeptide that binds Cu(I) to the metal binding motif (MXCXXC). This particular domain is believed to sequester copper during conditions of metal deprivation. The central region encompasses domain II, which plays a vital role in the interaction with Cu/ZnSOD and has a Zn(II) binding site found in humans but absent in yeast (Lamb et al. 2000). Finally, the C-terminal region consists of domain III, a short and highly disordered tail. It possesses a CXC Cu(I)-binding site that can interact with domain I. This interaction is believed to be crucial for the in vivo delivery of copper to the apo-Cu/ZnSOD, ensuring its proper functioning (Schmidt et al. 1999; Sagasti et al. 2011). The delivery of copper ions to Cu/ZnSOD by CCS is an essential step in the biogenesis of the enzyme.
The importance of bread wheat (Triticum aestivum) as a staple food source for a significant portion of the global population cannot be overstated. However, the vulnerability of wheat crops to fluctuating environmental conditions and various stress factors presents a formidable challenge to their cultivation. Understanding the molecular mechanisms underlying stress tolerance is crucial for developing resilient crop varieties. In this context, the current study focused on the functional characterization of the TaCCS1-B gene, which has a role in combating oxidative stress. The functionality of TaCCS1-B was first analysed in Saccharomyces cerevisiae and then in the transgenic Arabidopsis lines. The effect of salinity and drought stress was investigated in TaCCS1-B-expressing transgenic A. thaliana plants by evaluating various morphological and biochemical parameters. Further, the expression of different stress-responsive genes, such as ABA (ABSCISIC ACID DEFICIENT 2), DREB (DEHYDRATION-RESPONSIVE ELEMENT-BINDING 2A), etc., was analysed by qRT-PCR. These findings contribute to our understanding of the molecular mechanisms involved in stress response and provide a foundation for future efforts to enhance stress tolerance in wheat and other crop plants.
2 MATERIALS AND METHODS
2.1 Identification, sequence homology and expression analysis
The Triticum aestivum TaCCS proteinswere identified by BLASTp search using known CCS sequences from Arabidopsis thaliana (Chu et al. 2005), Oryza sativa (Navarro et al. 2021), Zea mays and Vitis vinifera (Feng et al. 2016) as a query against T. aestivum protein model sequences (IWGSC RefSeq v1.0) available at Ensembl Plants (http://plants.ensembl.org/index.html). The best BLASTp hits were considered at an e-value threshold of 10−10 and ≥ 60% sequence similarity. The nomenclature of identified TaCCS proteins was assigned following the guidelines of international rules of genetic nomenclature for gene symbolization in wheat (https://wheat.pw.usda.gov/ggpages/wgc/98/Intro.htm). The NCBI Conserved Domain Database (Wang et al. 2023) and the SMART server (Letunic et al. 2021) were used for the identification of conserved domains. The protein properties, including molecular weight, length, and isoelectric point (pI), were determined using the Sequence Manipulation Suite (Stothard 2000). To examine the primary structure, conserved domains, amino acid residues, metal-binding sites, and signature motifs, a multiple sequence alignments was generated using the Blosum62-12-2 and analyzed using the Multalin (Corpet 1988). Homology modeling via I-TASSER (Zhang 2008) was performed to determine the tertiary structure of the proteins. The subcellular localization was bioinformatically predicted using the CELLO v.2.5 (Yu et al. 2014) 2004) and the WoLF PSORT (https://www.genscript.com/wolf-psort.html) tools. The phylogenetic analysis was performed by the Maximum likelihood method at 1000 bootstraps using the MEGA-X software (Kumar et al. 2018). To analyze sequence variations for TaCCS orthologs, the Ka/Ks ratio (non-synonymous substitution rate/ synonymous substitution rate) was performed using the KaKs Calculator (Wang et al. 2010).
The publicly available high-throughput RNA sequencing (RNA-seq) data of Triticum aestivum from various tissues at different developmental stages were utilized for the expression analysis of TaCCS genes. This analysis covered three developmental stages for each tissue type, including root, leaf, stem, spike, and grain, using RNA-seq data available at URGI (Pingault et al. 2015).
2.2 Spot assay in Saccharomyces cerevisiae
The complete open reading frame (ORF) of the TaCCS1-B gene was amplified from the cDNA of bread wheat using gene-specific forward and reverse primers (Table S1). The amplified ORF was cloned pYES2.1/V5-His-Topo yeast expression vector (Invitrogen) and transformed in the S. cerevisiae w303 strain. As a control, S. cerevisiae w303 cells were also transformed with a vector containing the lacZ gene (pYES2.1/V5-His/lacZ).
To assess the functional properties of the recombinant TaCCS1-B gene, primary cultures of control cells and recombinant cells were grown overnight in an SD-Ura broth medium with 2% glucose. These cultures were then inoculated into secondary cultures at a 1:100 dilution. The cultures were allowed to grow until they reached an optical density (OD600) of 0.4, after which they were transferred to SD-Ura broth media containing 2% galactose and incubated at 30°C for 6 hours to induce the expression of the recombinant protein. After adjusting the OD600 of all cultures to 0.6, 500 μL of each induced culture was diluted in 10 mL of SD-Ura broth media with 2% galactose. The diluted cultures were then subjected to heat (HS) (45°C) drought (DS) (30% PEG 6000), heat-drought combination (HD) and salt (SS)(1 M NaCl) stress treatments for 24 hours. Subsequently, the control and stressed cultures were serially diluted and spotted on SD-Ura agar plates, followed by incubation at 30°C for 2 to 3 days. The growth of control and recombinant cells was examined visually to observe the impact of the stress treatments (Tyagi et al. 2021).
2.3 Development of TaCCS1-B expressing transgenic Arabidopsis plants
The full-length TaCCS1-B gene was amplified from cDNA using gene-specific primers and cloned into the pRI 101-AN vector. The recombinant plasmid was transformed into the A. tumefaciens GV3101 strain. Thereafter, the floral dip method was employed to transform five healthy 6 to 7-week-old A. thaliana Col-0 (wild type, WT) plants, as described by Clough & Bent (1998). Mature seeds from each T1 plant were individually harvested and screened on half-strength MS medium supplemented with 50 μg mL−1 kanamycin (Figure S1a). A total of 10 healthy seedlings which survived the selection process were transferred to the pots. Thereafter, the PCR analysis of genomic DNA and cDNA using TaCCS1-B gene-specific primers (Table S1) confirmed the presence of the transgene in three plants (Figure S1b) and designated as L1, L2, and L3. The seeds from these lines were multiplied for subsequent experiments in T3 generation. Additionally, two homozygous lines (Lines 1 and 2) exhibiting superior phenotypes were chosen for further functional studies.
2.4 Stress treatments, and morphological, physiological and biochemical analyses
The seeds obtained from both wild-type (WT) and transgenic Arabidopsis plants were subjected to surface sterilization. Subsequently, they were placed on half-strength MS (Murashige and Skoog medium, HiMedia) plates containing 10% PEG-6000 or 150 mM NaCl (Tyagi et al. 2023). The germination rate was determined manually by counting germinated seeds, while root length was measured using the ImageJ software.
Additionally, the WT and transgenic plants were cultivated in pots for 3–4 weeks. Then, they were subjected to salinity (150 mM NaCl) and osmotic (10% PEG-6000) stress treatments. After a seven-day treatment period, biochemical and physiological analyses were performed. Similarly, these stress treatments were applied to another set of plants three weeks after bolting to evaluate their effects on siliques.
2.4.1 Quantification of copper content by ICP-MS analysis
Inductively-Coupled Plasma Mass Spectrometry (ICP-MS) was utilized for copper estimation. Each sample underwent a thorough washing process with ion-free deionized water, repeated five or six times. To prevent metal contamination, all samples were handled exclusively with glass or plastic apparatus. Furthermore, the samples were freeze-dried and weighed before the digestion process. Subsequently, all samples were digested in 15 mL of 65% nitric acid (Merck) using a microwave-assisted digestion system (Mars 6, CEM Corp.). The volume of the digested sample was then adjusted to 50 mL with Milli-Q water. Copper content was estimated using an ICP-MS 7800 instrument (model 7800x inductively coupled plasma mass spectrometer, Agilent Technologies). The resulting parts per billion values from the ICP-MS analysis were normalized based on the initial sample weight and dilution factors using the following formula: metal (micrograms per gram of dry weight of the sample) = ICP-MS reading (parts per billion) × dilution/gram (weight)/1000 (Shumayla et al. 2023).
2.4.2 Chlorophyll and carotenoid content estimation
Fresh leaves obtained from plants subjected to salinity and osmotic stress for seven days were homogenized in 80% acetone, following the method described by Lichtenthaler and Wellburn (1983) for the assessment of chlorophyll a, chlorophyll b, and total carotenoid content.. The absorbance measurements were performed at three specific wavelengths (663 nm, 646 nm, and 470 nm) using a spectrophotometer (Orion AquaMUSAate 8000, Thermo Scientific) and quantified as μg.mL−1.
2.4.3 Determination of proline and malondialdehyde (MDA) content
To determine the proline content in fresh leaves, the extraction method described by Bates et al. (1973) was employed. Fresh leaves (40 mg) were homogenized in sulfosalicylic acid and subsequently centrifuged at 3000 × g for 10 minutes. Thereafter, the supernatant (200 μL) was added to the reaction mixture containing 30 mL of glacial acetic acid, 20 mL of phosphoric acid, and 1.25 g of ninhydrin. The reaction mixture was then heated for 1 hour at 100 °C and then cooled on ice. Following cooling, 4 mL of toluene was added to the sample, and the absorbance was measured at 520 nm. The obtained data were expressed as μmoles g−1 DW.
2.4.4 H2O2 content determination and DAB staining
The quantification of H2O2 was achieved by employing the method described by Alexieva et al. (2001). To perform the analysis, 0.5 mL of 0.1% TCA leaf extract supernatant was mixed to 0.5 mL of 100 mM potassium phosphate buffer (PB), and 2 mL of a reagent solution [1 M KI (w/v) in freshly prepared double-distilled water (H2O)]. For blank, 0.1% TCA without leaf extract was utilized. These reaction mixtures were incubated in the dark for 1 hour and the absorbance was recorded spectrophotometrically at 390 nm. The concentration of hydrogen peroxide in μmol g−1 FW was calculated using a standard curve prepared with the known concentrations of H2O2. Moreover, 3,3′-diaminobenzidine (DAB) staining procedure was employed for in-situ detection of H2O2 in the leaves of transgenic and control plants as described previously (Daudi & O'Brien 2012).
2.5 Determination of antioxidant enzymatic activities
Leaves samples (200 mg) were pulverized using liquid nitrogen and subsequently homogenized in a 2 mL extraction buffer. The extraction buffer consisted of 50 mM PB at pH 7.5, 1 mM phenylmethylsulphonyl fluoride (PMSF), 2% (w/v) polyvinylpolypyrrolidone (PVPP), and 0.1 mM ethylenediaminetetraacetic (EDTA). Following homogenization, the homogenates were centrifuged for 20 minutes at 16060 x g, and the resulting supernatants were transferred to fresh tubes. Total protein quantification was performed using the Bradford method (Bradford 1976). The supernatants were utilized as the crude enzyme extract for assessing the activities of superoxide dismutase (SOD), catalase (CAT), and ascorbate peroxidase (APX), as described in previous studies (Tyagi et al. 2023).
The determination of the SOD activity to inhibit the photochemical reduction of nitro-blue tetrazolium (NBT) into formazan blue was conducted in a solution comprising 2 mM riboflavin, 13 mM methionine, 0.1 mM EDTA, 75 μM NTB, and 50 mM PB with a pH of 7.8. To initiate the reaction, 40 μL of crude enzyme extract was added to 960 μL of the reaction mixture, which was subsequently exposed to a 15 W lamp for 10 minutes at a temperature of 25°C. The control reactions were kept in darkness for the same duration. The quantification of formazan blue formation was performed spectrophotometrically at 560 nm and the enzyme required for NBT photoreduction by 50% was defined as one unit of SOD (Beauchamp and Fridovich 1971).
The enzymatic activity of CAT was assessed by measuring the decrease in absorbance of H2O2 at 240 nm for 1 minute. Crude enzyme extract (25 μL) was added to 975 μL of a solution consisting of 20 mM H2O2 and 50 mM, pH 6.8 PB to initiate the reaction. The H2O2 decomposition rate was recorded to determine the CAT activity, utilizing the extinction coefficients of 36 M−1 cm−1 as reported by Cakmak & Marschner (1992) and Anderson et al. (1995).
For APX activity, the decrease in absorbance resulting from ascorbic acid oxidation was assessed through spectrophotometric measurements at a wavelength of 290 nm over a duration of one minute. The assay commenced by adding enzyme extract (10 μL) to a reaction mixture (990 μL) composed of 50 mM, pH 7.0 PB, 0.5 mM ascorbic acid, 0.1 mM H2O2, and 0.1 mM EDTA at 25°C. To calculate the APX activity, the absorbance reduction was recorded, utilizing an extinction coefficient of 2.8 mM−1 cm−1, as described by Nakano & Asada (1981).
2.6 Quantification of polyphenols
A total of 200 mg lyophilized leaf samples were homogenized in a Geno/Grinder® (SPEX Sample Prep P-2010) and extracted with 80% methanol. To clear the supernatant, three volumes of 2 M acidic methanol were added and the mixture was incubated at 90°C for 45 min. Following incubation, samples were dried using rotavapor and then reconstituted in 1 mL of 80% methanol. Analysis was conducted on a 1290 Infinity II series UHPLC system (Agilent Technologies) equipped with a Zorbax Eclipse Plus C18 column maintained at 30°C. The mobile phase comprised solution A (0.1% formic acid in HPLC grade water) and solution B (0.1% formic acid in acetonitrile). Chromatographic conditions included a constant flow rate of 270 μL/min, an injection volume of 3 μL, and a total run time of 47 min. Prior to analysis, all samples were sterilized using a 0.22 μm PVDF syringe filter (Merck), and analytical standards (Merck) were employed for each compound (Naik et al. 2021; Rajput et al. 2022; Singh et al. 2024).
2.7 Expression analysis through quantitative real-time PCR (qRT-PCR)
The total RNA was isolated from leaf tissue according to the manufacturer's protocol (Sigma-Aldrich). The RNA was treated with DNase I (Thermo Fisher Scientific) to remove any contaminating DNA, and cDNA synthesis was performed using the RevertAid First Strand cDNA Synthesis Kit (Thermo Scientific). Quantitative real-time PCR reactions were conducted using 1X SYBR Green PCR Master Mix (Applied Biosystems), 1 μL of diluted cDNA (equivalent to 10 ng total RNA), and 5 nM of gene-specific primers (Table S1) in a final volume of 10 μL. The reactions were run on a 7500 Fast Real-Time PCR System (Applied Biosystems). Arabidopsis ACTIN primers were used as an internal control (Table S1). Gene expression analysis was performed in triplicate using the delta–delta CT method (2−ΔΔCT) as described by Livak & Schmittgen (2001).
2.8 Statistical Analysis
The results from three biological replicates were presented as the mean ± standard deviation (SD). To conduct the statistical analysis of the data, we performed ordinary two-way analysis of variance (ANOVA). This was followed by Dunnett's multiple comparisons test to identify significant differences between the treatment and the control samples. All analyses were carried out using the GraphPad Prism version 8.0.2, with a significance threshold set at p < 0.05 to determine statistical significance.
3 RESULTS
3.1 Identification, protein structure and phylogenetic analysis
In T. aestivum, we identified three homoeologous CCS genes, TaCCS1-A (TraesCS2A02G399000), TaCCS1-B (TraesCS2B02G417000), and TaCCS1-D (TraesCS2D02G396500), localized in the A, B, and D sub-genomes, respectively. These genes encode TaCCS proteins that contain a highly conserved Heavy-Metal-Associated (HMA) domain involved in metal ion binding and transport, as well as a Sod_Cu domain necessary for dimerization with Cu/ZnSOD proteins (Casareno et al. 1998; Chu et al. 2005). The molecular weights of the TaCCS1-A, TaCCS1-B, and TaCCS1-D proteins were 32.3, 32.16, and 32.17 kDa, with protein lengths of 311, 308, and 309 amino acid residues, respectively. The predicted isoelectric points were 5.19, 5.48, and 5.19, respectively. All the TaCCS proteins were predicted to have chloroplastic localization.
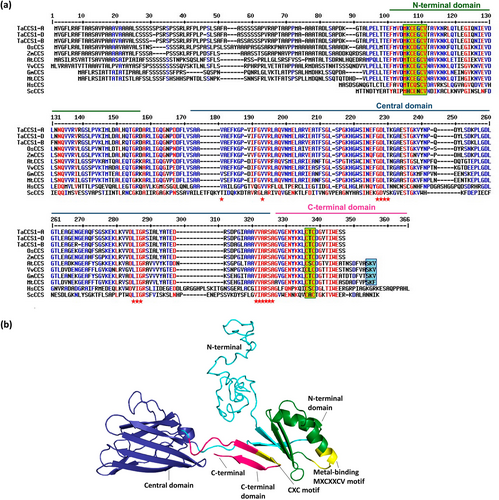
To gain insights into the structural characteristics of the TaCCS proteins, multiple sequence analysis was performed with CCS protein from A. thaliana (AtCCS; 320 aa), O. sativa (OsCCS; 312 aa), Z. mays (ZmCCS; 308 aa), V. vinifera (VvCCS; 322 aa), Glycine max (GmCCS; 304 aa), M. truncatula (MtCCS; 312 aa), Homo sapiens (HsCCS; 274 aa), and Saccharomyces cerevisiae (ScCCS; 250 aa), where TaCCS proteins shared maximum sequence similarity with OsCCS and ZmCCS proteins (Table S2). The multiple sequence alignment revealed several conserved regions across the homologous sequences, particularly within the domains known to be associated with copper binding. CCS comprises two distinct domains and a short, disordered C-terminal tail (Figure 1a). The N-terminal domain contains a highly conserved ‘MXCXXCV’ metal-binding motif in all the CCS proteins, a conserved central domain and C-terminal tail with a highly conserved ‘CXC’ motif. This three-domain structure is conserved among eukaryotic organisms, suggesting a strong structure–function relationship for the protein. Since all three homoeologous TaCCS1 proteins were highly similar, the TaCCS1-B protein sequence was used for the three-dimensional structure prediction using the I-TASSER server, and model 1 was selected due to the highest confidence score according to the C-score (−2.97), indicating its reliability in representing the native structure. The 3-D structure showed a conserved N-terminal domain, predominantly composed of coils, four β-strands and two α-helices, and features a conserved metal-binding motif. The central domain consists of coils, eight β-strands arranged in an anti-parallel manner, and one α-helix. The C-terminal domain is composed of two β-strands and includes a conserved CXC motif (Figure 1b).
The phylogenetic analysis revealed a close homology of TaCCS proteins with other monocot CCSs, specifically OsCCS and ZmCCS. Similarly, CCS proteins from dicot species were grouped within the same clade. CCS proteins from fungi [i.e., Candida albicans (CaCCS) and Saccharomyces cerevisiae (ScCCS)], clustered closely together. Additionally, MmCCS from Mus musculus and HsCCS from Homo sapiens were grouped in the same clade (Figure S2). The Ka/Ks ratio between TaCCS and CCS gene pairs from other plant species indicates strong purifying selection (Ka/Ks <1) with a high rate of synonymous substitutions, highlighting evolutionary conservation (Table S3).
3.2 Tissue-specific expression analysis
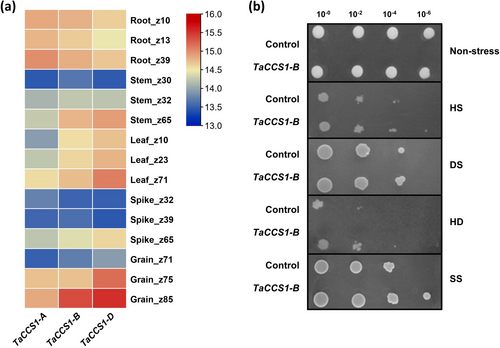
The tissue-specific expression of TaCCS1-A, TaCCS1-B, and TaCCS1-D was examined across three developmental stages of root, stem, leaf, spike, and grain tissue. All three genes were expressed in all tissues. Notably, TaCCS1-B and TaCCS1-D exhibited high expression levels throughout all developmental stages in the root and leaf, as well as in the stem at the Z65 stage and in the grain at later stages (Z75 and Z85) (Figure 2a). These findings suggest that TaCCS1-B and TaCCS1-D play significant roles across various tissues and developmental stages.
3.3 Stress tolerance in S. cerevisiae
The potential of TaCCS1-B gene against abiotic stress conditions was initially characterized by recombinant expression in S. cerevisiae cells. A spot assay was conducted to compare the response of yeast cells expressing a control gene (lacZ) and yeast expressing TaCCS1-B to heat (HS), drought (DS), heat and drought combination (HD) and salinity (SS) stresses for 24 h. Both control and TaCCS1-B-expressing yeast cells exhibited comparable growth under non-stress condition. However, under each stress condition (Figure 2b), the growth of TaCCS1-B-expressing recombinant yeast cells was comparatively higher than that of the control cells. The findings revealed that the TaCCS1-B gene did not alter the typical growth pattern of yeast cells. Nonetheless, it conferred tolerance to various abiotic stresses. Therefore, in planta validation is necessary to study its potential for enhancing adaptation to environmental challenges in higher plants.
3.4 Phenotypic changes in transgenic Arabidopsis plants under osmotic and salinity stress
Initially, the seed germination rate of Arabidopsis WT and TaCCS1-B-expressing transgenic lines (L1, L2, and L3) was evaluated under normal and stress conditions. In normal conditions, WT and the transgenic lines L1 and L2 exhibited a nearly 100% germination rate, whereas line L3 germination rate was approximately 75%. Conversely, under osmotic stress, WT seeds showed decreased germination rate (~21%) compared to transgenic lines L1 (~89%), L2 (~95%), and L3 (~42%). However, under salinity stress, the germination rate in L1 (~82%) and L2 (~80%) was higher than in WT (~71%) and L3 (~73%) (Figure 3a,b). Both L1 and L2 lines displayed significantly higher germination rates, suggesting increased osmotic and salinity stress tolerance due to TaCCS1-B overexpression.
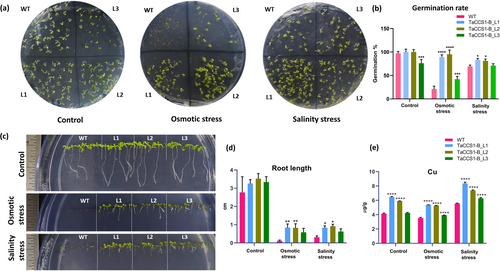
The root length was comparable in control condition in WT and all the transgenic lines. Following osmotic stress, the root length of transgenic lines L1 (0.84 ± 0.2 cm) and L2 (0.82 ± 0.23 cm) was notably higher compared to WT (0.11 ± 0.04 cm) and L3 (0.58 ± 0.22 cm) plants. The roots of transgenic lines L1 (0.83 ± 0.1 cm) and L2 (0.31 ± 0.08 cm) showed better growth as compared to WT (0.91 ± 0.11 cm) and L3 (0.62 ± 0.15) in response to salinity stress (Figure 3c,d). Transgenic lines L1 and L2 exhibited better growth and healthy siliques compared to WT under osmotic and salinity stress conditions, suggesting improved reproductive growth and yield potential in the transgenic lines under stress conditions (Figure S3).
3.5 Overexpression of TaCCS1-B enhances copper content in transgenic lines
CCS proteins function as copper chaperones that bind to cuprous ions and deliver them to Cu/ZnSODs to facilitate their activity. Therefore, ICPMS analysis was conducted to quantify the copper (Cu) content in transgenic lines overexpressing TaCCS1-B. Under control condition, a significant increase in Cu content was observed in the transgenic Arabidopsis lines L1 (6.4 μgCu/g DW) and L2 (5.9 μg/g DW) in comparison to the wild-type (4.1 μg/g DW). During osmotic stress, the Cu concentration in the transgenic lines L1 (5.4 μg/g DW) and L2 (5.3 μg/g DW) was found to be higher than that in the WT (3.5 μg/g DW). During salinity stress, Cu concentration was remarkably higher in transgenic lines L1 (8.3 μg/g DW), L2 (7.4 μg/g DW) and L3 (6.3 μg/g DW) as compared to WT (5.5 μg/g DW) (Figure 3e). These results indicate that the overexpression of TaCCS1-B consequent accumulation of copper in the transgenic lines.
3.6 Physiological and biochemical analyses of transgenic Arabidopsis plants
The photosynthetic capacity was analyzed in terms of chlorophyll content in WT and transgenic lines L1 and L2 in control and stress conditions. No significant change was observed in chlorophyll a and b content in WT and transgenic lines under control condition. However, the chlorophyll a content was significantly higher in both the transgenic lines L1 (8.54 ± 0.63 μg/mL) and L2 (8.4 ± 0.38 μg/mL) compared to WT (5.4 ± 1.35 μg/mL) plants under osmotic stress. However, it was significantly higher only in transgenic line L2 (8.32 ± 0.46 μg/mL) than WT (6.15 ± 0.44 μg/mL) in response to salinity stress (Figure 4a). An insignificant change was observed in chlorophyll b content in control as well as stressed conditions except for transgenic line L2 (2.99 ± 0.47242 μg/mL), which showed significantly higher content compared to WT (1.9 ± 0.28 μg/mL) during salinity stress (Figure 4a).
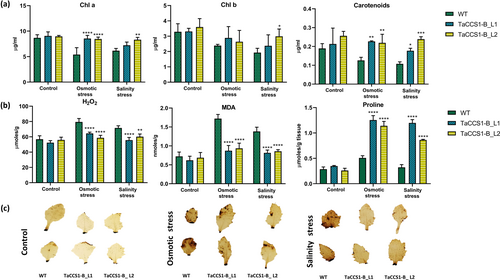
Carotenoid content was also higher in transgenic lines L1 (0.23 ± 0.003 μg/mL) and L2 (0.22 ± 0.04 μg/mL) compared to WT (0.13 ± 0.02 μg/mL) under osmotic stress, and L1 (0.18 ± 0. 01 μg/mL) and L2 (0.24 ± 0.013 μg/mL) than in WT (0.11 ± 0.013 μg/mL) during salinity stress. In contrast, the WT plants and transgenic lines L1 and L2 showed insignificant changes in carotenoid content under control condition (Figure 4a).
H2O2, malondialdehyde (MDA) and proline content were quantified in WT and TaCCS1-B-overexpressing lines for determining oxidative stress in control and stress conditions. The level of H2O2 was comparable in WT (56.86 ± 4.48 μmoles/g FW) and transgenic lines L1 (52.35 ± 2.69 μmoles/g FW) and L2 (55.94 ± 3.58 μmoles/g FW) in control condition. However, significantly lower H2O2 level was observed in L1 (64.46 ± 1.69 μmoles/g FW) and L2 (58.69 ± 3.29 μmoles/g FW) as compared to WT (79.48 ± 4.49 μmoles/g FW) under osmotic stress, and likewise in L1 (55.73 ± 3.48 μmoles/g FW) and L2 (60.21 ± 3.49 μmoles/g FW) than in WT (71.59 ± 2.88 μmoles/g FW) under salinity stress (Figure 4b).
The MDA content, a marker of lipid peroxidation and oxidative stress, was comparable in WT (0.72 ± 0.114 nmoles/g FW) and transgenic lines L1 (0.62 ± 0.109 nmoles/g FW) and L2 (0.69 ± 0.14 nmoles/g FW) in the control condition, while it was significantly lower in L1 (0.87 ± 0.14 nmoles/g FW) and L2 (0.93 ± 0.14 nmoles/g FW) compared to WT (1.72 ± 0.11 nmoles/g FW) under osmotic stress. Similarly, in response to salinity stress, a lower amount of MDA was found in L1 (0.82 ± 0.074 nmoles/g FW) and L2 (0.86 ± 0.04 nmoles/g FW) lines as compared to the WT (1.38 ± 0.11 nmoles/g FW) (Figure 4b), indicating reduced oxidative damage in the transgenic lines.
The proline content was also comparable in WT (0.27 ± 0.04 μmoles/g FW) and transgenic lines L1 (0.35 ± 0.011 μmoles/g FW) and L2 (0.26 ± 0.044 μmoles/g FW) in control condition. However, significantly higher content was observed in L1 (1.25 ± 0.087 μmoles/g FW) and L2 (1.14 ± 0.09 μmoles/g FW) as compared to WT (0.51 ± 0.043 μmoles/g FW) in response to osmotic stress. A higher proline content was also observed in L1 (1.198 ± 0.065 μmoles/g FW) and L2 (0.86 ± 0.011 μmoles/g FW) under salinity stress as compared to WT (0.32 ± 0.054 μmoles/g FW) (Figure 4b), indicating enhanced osmotic stress tolerance and osmolyte accumulation in the transgenic lines.
The DAB staining of Arabidopsis leaves from WT and transgenic lines L1 and L2 plants in control and under osmotic and salinity stress conditions depicted lower levels of H2O2 accumulation in transgenic lines L1 and L2 compared to WT (Figure 4c), further confirming reduced oxidative stress in the transgenic lines under stress conditions.
3.7 Higher antioxidant enzyme activities in transgenic lines
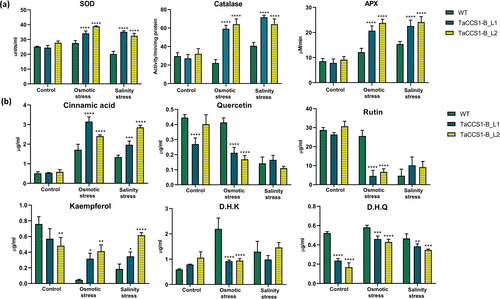
To assess the antioxidant response of transgenic Arabidopsis lines L1 and L2 overexpressing TaCCS1-B, we measured the activities of SOD, CAT, and APX under control as well as osmotic and salinity stress conditions. Transgenic lines L1 and L2 exhibited comparable SOD, CAT and APX activities as of the WT plants during the control condition. However, under osmotic stress, SOD activity increased by 23.78% and 40.86% in transgenic lines L1 and L2 compared to WT plants, respectively. Similarly, salinity stress induced a substantial rise in SOD activity in transgenic lines L1 and L2, with an increase of 74.26 and 61% as compared to WT plants, respectively (Figure 5a). The CAT activity surged in both transgenic lines, with L1 and L2 exhibiting increases of 90.9% and 97.1%, respectively, upon exposure to osmotic stress. Under salinity stress, CAT activity further increased in transgenic lines, showing a 75.76% rise in L1 and a 57.57% rise in L2 compared to WT plants (Figure 5a). APX activity under osmotic stress showed a notable increase in transgenic lines, with L1 and L2 exhibiting increases of 70.58% and 96.07%, respectively. Salinity stress induced a significant rise in APX activity in transgenic lines, with L1 and L2 showing increases of 47.28% and 57.36%, respectively, compared to WT plants (Figure 5a).
3.8 Polyphenols estimation in overexpression lines
To investigate the impact of overexpression of the TaCCS1-B gene on polyphenol accumulation, we measured the levels of cinnamic acid, dihydrokaempferol (DHK), dihydroquercetin (DHQ), rutin, quercetin, and kaempferol in WT and transgenic Arabidopsis lines under control, osmotic, and salinity stress conditions. Under control conditions, WT and transgenic lines L1 and L2 exhibited a comparable accumulation of most of the polyphenols, except for a reduction in the content of quercetin in L1, kaempferol in L2, and DHQ in both L1 and L2 (Figure 5b). Osmotic stress significantly affected the accumulation of polyphenols in WT and transgenic plants. The levels of cinnamic acid and kaempferol increased significantly in transgenic lines L1 and L2; however, the content of quercetin, DHK, DHQ, and rutin decreased significantly in transgenic lines L1 and L2 as compared to WT under osmotic stress. Under salinity stress, a similar trend was observed for cinnamic acid, kaempferol and DHQ. However, an insignificant change was observed in the content of quercetin, DHK, and rutin (Figure 5b).
3.9 Expression profiling of stress marker genes
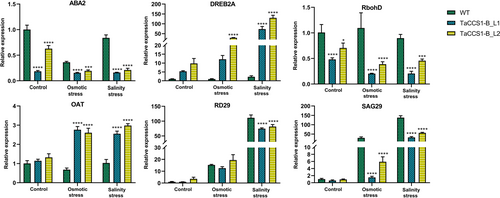
To investigate the expression levels of stress marker genes, we performed qRT-PCR in WT and TaCCS1-B-expressing transgenic Arabidopsis lines (L1 and L2) in response to osmotic and salinity stress. The expression level of ABA2, a key gene in the abscisic acid (ABA) biosynthesis pathway, was significantly downregulated in both transgenic lines L1 and L2 compared to the WT in control and stress conditions. The expression in L1 and L2 showed a 5.4- and 1.6-fold decrease under the control condition, whereas 2.34- and 1.87-fold decrease under osmotic stress. During salinity stress, 5.2- and 3.95-fold reduction in the expression of ABA2 was observed in lines L1 and L2, respectively. A similar trend was observed for the RbohD (RESPIRATORY BURST OXIDASE HOMOLOGUE D) gene, responsible for reactive oxygen species (ROS) production, which showed 2.1- and 1.4-fold downregulation in the transgenic lines L1 and L2 under control condition; 5.4- and 2.8-fold downregulation under osmotic stress; and 4.3- and 1.94-fold downregulation under salinity stress.
DREB2A, a transcription factor involved in drought and heat stress responses, demonstrated a substantial upregulation of 12- and 29-fold in the transgenic lines L1 and L2, respectively, during osmotic stress. In contrast, the L1 line showed a 33-fold increase, and L2 displayed a 59-fold increase in expression compared to WT under salinity stress.
OAT (ORNITHINE AMINOTRANSFERASE), involved in proline biosynthesis, showed 2.42- and 2.24-fold increase in lines L1 and L2 compared to WT under osmotic stress, respectively. Under salinity stress, transgenic lines L1 and L2 exhibited 1.97- and 2.26-fold increased expression, respectively.
RD29 (RESPONSIVE TO DESICCATION 29), a well-known stress-responsive gene, exhibited similar expression in the WT and transgenic lines under control and osmotic stress. However, L1 showed a 1.5-fold decrease, and L2 displayed a 1.4-fold decrease in expression compared to WT under salinity stress conditions.
SAG29 (SENESCENCE-ASSOCIATED GENE 29), a sugar transporter gene, showed 19.5- and 5-fold downregulated expression in transgenic lines L1 and L2, respectively, under osmotic stress, and 4.2- and 2.46-fold downregulated expression, respectively, in L1 and L2 under salinity stress compared to WT (Figure 6).
4 DISCUSSION
Abiotic stress poses a significant threat to plant growth and productivity by inducing oxidative stress and disrupting cellular homeostasis. This study highlights the pivotal role of the TaCCS1-B, a copper chaperone gene, in enhancing stress tolerance in transgenic Arabidopsis, offering valuable insights for developing stress-resilient crops. Copper is an essential micronutrient involved in various physiological processes, including photosynthesis, respiration, and antioxidant defense. However, free copper ions can be toxic due to their ability to generate reactive oxygen species (ROS). Copper chaperones mitigate this toxicity by binding and transporting copper ions to copper-dependent proteins, such as superoxide dismutase (SOD), which are vital for detoxifying ROS and maintaining cellular redox balance (Chen et al. 2022). The CCS has been identified as a key factor in the integration of Cu/ZnSOD in plants, yeast and mammals. However, studies to identify the biological function of CCS genes in plants under abiotic stress have been limited. In our study, we identified and characterized the TaCCS1-B gene from bread wheat (Triticum aestivum L.) and demonstrated its role in enhancing tolerance to osmotic and salinity stress in transgenic Arabidopsis plants.
Here, we identified TaCCS1 homoeologous proteins derived from different sub-genomes through comparative analysis with other CCS proteins. They all contain conserved domains essential for its function, including the heavy-metal-associated (HMA) domain and the copper chaperone domain for Cu/Zn SOD. These domains are crucial for binding and delivering copper ions to Cu/Zn SOD, thus ensuring its proper function under stress conditions. Metal-binding motif (MXCXXCV) at N-terminal and CXC motif at C-terminal, which is necessary for copper delivery to SOD (Lamb et al. 2001), were found strictly conserved in TaCCS1 homeologous proteins. In yeast, weak complementation was observed in lys7 null mutant by truncated yCCS (lacking ATX1-like domain) as compared to the intact yCCS, highlighting the importance of the ATX1-like domain (Schmidt et al., 1999). In addition, in vitro analyses of LeCCS have indicated that the ATX1-like domain plays a crucial role in binding copper and/or zinc ions for metal ion transfer (Zhu et al., 2000).
The CXC motif of Ccs1 is necessary for the activation of Sod1 in yeast (Boyd et al. 2019). In Aspergillus fumigatus, the CXC motif is more conserved than the MXCXXC motif among Ccs1 orthologs, suggesting its essential role in CcsA function. Site-directed mutagenesis experiments showed that the CXC motif, but not the MXCXXC motif, is crucial for CcsA function in A. fumigatus. When the CXC motif was mutated to AXA, phenotypic defects similar to those in ccsA and sodA deletion mutants were observed, whereas mutations in the MXCXXC motif did not result in detectable phenotypes (Du et al. 2021). In rice CCS protein OsHPP04, the CXXC metal-binding motif within a βαββαβ-fold of the HMA domain may bind Cu through the Cys residues (de Abreu-Neto et al. 2013; Song et al. 2021). This structural conservation suggests a similar mechanism of action across the plant species, where the CCS protein facilitates the activation of Cu/Zn SOD by delivering copper ions. It was further supported by the Ka/Ks ratio <1, which suggests that the function of the CCS gene is likely essential and preserved across species.
The recombinant yeast cells overexpressing the TaCCS1-B gene exhibited a marked improvement in tolerance to various abiotic stresses, including heat, drought, salinity, and a combination of heat and drought, compared to the control yeast cells. This enhanced stress tolerance suggests that TaCCS1-B plays a significant role in stress adaptation mechanisms. Our findings align with previous studies on the Glycine max CCS (GmCCS) gene family, where different GmCCS genes demonstrated varied responses to abiotic stresses when overexpressed in yeast cells. Specifically, five GmCCS genes were found to significantly enhance the sorbitol tolerance of yeast cells compared to the controls. However, these genes did not improve the tolerance of yeast cells to NaCl or NaHCO3 stress (Jiao et al. 2023). These differential responses observed in yeast cells overexpressing TaCCS1-B and GmCCS genes highlight the complexity of stress tolerance mechanisms. It suggests that while some CCS genes may confer broad-spectrum stress tolerance, others may be more specific to particular stress conditions. The TaCCS1-B gene, in particular, appears to contribute to a more generalized enhancement of stress tolerance.
The overexpression of TaCCS1-B in transgenic Arabidopsis lines led to markedly improved phenotypic traits under stress conditions. The transgenic lines exhibited significantly improved tolerance to both osmotic and salinity stress compared to wild-type plants. Higher germination rates, improved root lengths and plant growth, and healthy siliques observed in these lines are indicative of enhanced vigour and adaptation to adverse environments. Previously, the effect of NaCl was observed on two accessions of Arabidopsis (i.e., Col and N1438), where the rosette biomass was 50% and 66%, respectively, of control plants (Attia et al. 2011). Moreover, variability in the abundance of CCS transcripts was observed between two accessions of A. thaliana with differing salt tolerance levels. Specifically, the Col accession, which is more sensitive to salt stress, exhibited upregulation of the CCS gene. In contrast, the N1438 accession, which demonstrated greater salt tolerance compared to the Col accession, did not show such upregulation of CCS (Attia et al. 2011).
Copper serves as a vital cofactor for numerous enzymes, including cuproenzymes (Robinson and Winge 2010). Unchelated copper is present only in trace amounts within cells due to its high toxicity. Consequently, its detection under normal physiological conditions is extremely limited. To ensure proper utilization while preventing toxicity, cells depend on copper metallochaperones to deliver copper to cuproenzymes, such as Cu/Zn-superoxide dismutase (Cu/Zn-SOD) (Valentine & Gralla 1997; Huffman & O'Halloran 2001; Cobine et al. 2006). In our study, the enhanced copper content in transgenic lines during control and stress conditions could be correlated with the overexpression of TaCCS1-B in the transgenic lines. TaCCS1-B overexpression resulted in increased copper content in transgenic lines, underscoring its role in copper homeostasis. In yeast, CCS transfers copper to the active site of cytosolic Cu/Zn-SOD (Culotta et al. 1997). Likewise, in Arabidopsis, AtCCS has been shown to facilitate copper delivery to Cu/Zn-SOD (Abdel-Ghany et al. 2005; Chu et al. 2005). Further, the expression of CSD1 and CSD2 is known to be upregulated by copper (Cu) (Abdel-Ghany et al. 2005), and AtCCS is co-regulated with its CSD1 and CSD2 targets, indicating a role in Cu delivery for oxidative stress protection. Additionally, AtCCS, CSD1, and CSD2 were found to be downregulated together in response to Cu deficiency (Wintz et al. 2003).
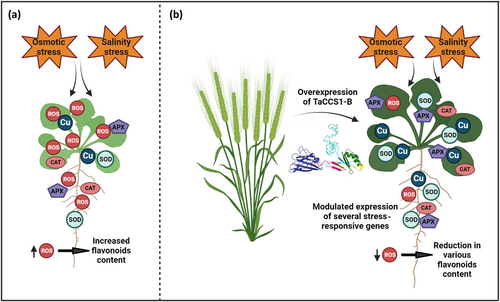
The overexpression of TaCCS1-B enhances tolerance to osmotic and salinity stress in transgenic Arabidopsis plants, as evidenced by improved chlorophyll and carotenoid content, RWC, reduced oxidative stress, and accumulation of osmoprotectants like proline, along with reduced lipid peroxidation. These findings further support the notion that TaCCS1-B facilitates better metabolic balance and stress response by protecting against oxidative damage in the transgenic lines. Enhanced antioxidant activity in these lines is consistent with findings in other studies where overexpression of CCSs improved oxidative stress tolerance. For instance, Jiao et al. (2023) demonstrated that the activities of SOD, CAT, and peroxidase (POD) were significantly higher in GmCCS7- and GmCCS24-overexpressing transgenic soybean roots compared to control plants during drought stress, although no significant differences were observed under normal growth conditions. This suggests that CCS overexpression primarily enhances the plant's defensive response to stress conditions rather than altering its baseline physiological state. However, the overexpression of CCSs may also have complex effects on ROS signaling, potentially interfering with plant immunity. For instance, in rice, the invasion of Meloidogyne graminicola in roots leads to an increase in superoxide radicals (O2•−), resulting in oxidative stress. Meanwhile, the overexpression of OsHPP04, a CCS in rice, enhances Cu/Zn-SOD activity, thereby reducing O2•− levels. This reduction in superoxide radicals, while beneficial for oxidative stress mitigation, can inadvertently suppress plant immunity and promote nematode parasitism by eliminating the ROS signal necessary for activating defense responses (Song et al. 2021). Interestingly, the overexpression of TaCCS1-B gene modulates the expression of several stress-responsive genes. The downregulation of ABA2, RbohD, RD29, and SAG29 genes in the transgenic lines suggests reduced stress levels, with RbohD expression being directly correlated with increased antioxidant enzymes' activity and decreased H2O2 levels. In Arabidopsis, DREB2A is well known for its response to drought, salt, and cold stresses (Sakuma et al. 2006), which aligns with the upregulated expression of DREB2A observed in our study. Additionally, the increased expression of OAT is strongly correlated with the elevated proline content in the transgenic lines. This regulatory function is vital for orchestrating a coordinated response to stress, enabling plants to better cope with and adapt to adverse conditions. In WT plants, exposure to osmotic and salinity stress triggers the accumulation of ROS. Excessive ROS levels lead to a variety of negative physiological effects, including a retarded phenotype, reduced photosynthetic pigment levels, decreased antioxidant activity, and lower copper content. In response to ROS accumulation, WT plants activate the flavonoid biosynthesis pathway as a protective mechanism (Figure 7a). Flavonoids, known for their antioxidant properties, help to mitigate ROS damage, leading to an increase in flavonoid content. Despite this adaptive response, the overall stress tolerance in WT plants remains compromised due to the high ROS levels and associated physiological detriments. In contrast, transgenic Arabidopsis plants overexpressing the TaCCS1-B gene (Figure 7b) demonstrate a markedly improved response to osmotic and salinity stress. These transgenic plants exhibit a superior phenotype characterized by increased photosynthetic pigment levels, enhanced antioxidant activity, and elevated copper content. The overexpression of TaCCS1-B appears to boost the plants' antioxidant defense mechanisms, significantly reducing ROS accumulation. As a result of lower ROS levels, the demand for flavonoid biosynthesis as an antioxidant response decreases, leading to reduced flavonoid content in the transgenic plants compared to WT (Figure 7b). By maintaining lower ROS levels, these plants avoid the deleterious effects associated with oxidative stress, such as cellular damage and impaired growth. Overall, our findings highlight the pivotal role of TaCCS1-B in conferring osmotic and salinity stress tolerance through the regulation of copper homeostasis and ROS scavenging.
5 CONCLUSIONS
The functional characterization of TaCCS1-B in transgenic Arabidopsis demonstrates its potential to improve crop tolerance to abiotic stresses. Overexpression of TaCCS1-B significantly enhances tolerance to osmotic and salinity stress by improving copper homeostasis, reducing oxidative damage, and modulating stress-responsive genes. We note that the study in the model plant Arabidopsis may not fully represent stress tolerance mechanisms in wheat, where TaCCS1-B is naturally expressed. Further, the research was conducted under controlled conditions, which do not account for the variable stresses encountered in field conditions, such as temperature fluctuations, soil composition, and microbial interactions. However, this study underscores TaCCS1-B as a promising candidate for developing stress-resilient crops, contributing to sustainable agriculture and food security. Future research should investigate the function of TaCCS1-B directly in wheat or similar crops in field settings to validate its potential for enhancing stress resilience in diverse environments.
AUTHOR CONTRIBUTIONS
SKU conceived the idea. SKU and ST designed the experiments. ST, S and SS performed the experiments. ST, AP and SKU analyzed the data. ST and SKU wrote and finalized the manuscript. All authors have read and approved the manuscript.
ACKNOWLEDGEMENTS
The authors are grateful to Panjab University, Chandigarh, India for facilities. ST is grateful to the Science and Engineering Board (SERB), Government of India for the National Post Doctoral Fellowship (N-PDF). SS is thankful to UGC for the Senior Research Fellowship. SKU is grateful to SERB for the Core Research Grant (CRG/2021/000040) and Indian National Science Academy (INSA), New Delhi for INSA-Associate Fellow.
Open Research
DATA AVAILABILITY STATEMENT
The data that support the findings of this study are available from the corresponding author upon reasonable request.


