Cytosolic fructose-1,6-bisphosphatase isoform mediates metabolic adjustments in bean fruit pericarp to support seed growth
Abstract
Seed development requires substantial metabolic resources and is influenced by adverse environmental conditions. However, the ability of plants to produce viable seeds under restrictive conditions suggests the existence of mechanisms that make this process less sensitive to environmental stress. Uncovering their regulation could lead to the development of genotypes better adapted to stressful conditions. Plant response to stress is complex, and the contribution of organs such as the fruit pericarp to stress tolerance mechanism may have been underestimated. The bean fruit pericarp, a photosynthetic structure that contributes to seed development, can synthesize starch from surplus sucrose, which is later degraded during the rapid seed growth phase. This metabolic flexibility may be crucial for supporting seed growth when the photosynthate supply is reduced. To explore this possibility, we disrupted phloem continuity at the pedicel level in fruits about to enter the seed reserve accumulation stage. We used the capacity of the pericarp to incorporate 14CO2 to investigate changes in its metabolism. Our findings reveal that, in response to reduced photosynthate availability, the fruit pericarp did not increase 14CO2 fixation. However, the amount of 14C used for starch synthesis decreased, while the proportion used for soluble sugars synthesis increased. This shift resulted in an increase in 14C-products transported to seeds was accompanied by a significant increase in the activity of cytosolic fructose 1,6-bisphosphatase. Our results indicate that photosynthate restriction accelerates the degradation of pericarp storage proteins, and the increase in cFBPase activity could be crucial in converting the carbon produced in carbohydrates.
1 INTRODUCTION
Seed development is a process that demands large amounts of metabolic resources, the availability of which is often limited by conditions that reduce leaf photosynthetic activity. However, plant tolerance to adverse environments requires an integrated response, and it is possible that the contribution of other green organs to tolerance mechanisms has been overlooked. This could be the case with the pericarp that protects bean seeds. The pericarp consists of two photosynthetic layers: the exocarp, which incorporates CO2 from the external atmosphere via stomata, and the endocarp, where CO2 released mainly from seed respiration is photoassimilated (Atkins et al., 1977). The photosynthetic activity of the fruit pericarp could account for up to 9% of total gross canopy photosynthesis (Cho et al., 2023), which represents up to 15% of the carbon used in seed development (Bennett et al., 2011). This process also provides ATP and NADPH required for biosynthetic pathways, while the oxygen generated could be important in preventing hypoxia in seeds (Garrido et al., 2023). The flow of sucrose to fruits is almost constant throughout the entire seed development period (Belmont et al., 2022). However, seed growth begins only after the pericarp has reached its full size (Clavijo-Michelangeli et al., 2013) and, due to the differentiation of chloroplasts into amyloplasts, surplus sucrose is used for starch synthesis in the pericarp (Belmont et al., 2022). This carbon reserve is used during the stage of significant reserve material accumulation in seeds (Bernal et al., 2022). The utilization of the starch stored in the pericarp is characterized by an increase in the phosphorylation of the granules, enhancing its suitability as a substrate for β-amylase, along with elevated activities of disproportionating enzyme 2 (DPE2, EC 2.4.1.25) and glucan phosphorylase 2 (PHO2, EC 2.4.1.1), which participate in maltose metabolism in the cytosol (Bernal et al., 2022). The fruit pericarp provides protection against biotic and abiotic stresses and, through dynamic feedback mechanisms, pods can also signal their resource requirements to the leaves, thereby regulating the remobilization of photosynthates (Bennett et al., 2011). This ability could be particularly crucial under stress conditions. In this context, it has been observed that alfalfa pod wall could respond to drought stress by enhancing C4 photosynthesis and the synthesis of ATP (Wang et al., 2020a). Seed filling is a process that depends on the translocation of carbohydrates from leaves to developing seeds. In leaves, the capacity to export photosynthetic products is highly dependent on the activities of sucrose phosphate synthase (SPS, EC 2.4.1.14) and cytosolic fructose 1,6-bisphosphatase [cFBPase; EC 3.1.3.11], (Strand et al., 2000, Lee et al., 2008; Rojas-González et al., 2015). Defoliation triggers a rapid increase in the activity of both enzymes, enhancing the use of photosynthates for sucrose synthesis, which is crucial in responding to the increased demand for sucrose (Rufty and Huber, 1983). However, this mechanism is not universal. In rice, for example, the mobilization of starch stored in the stem during grain filling is dependent on SPS activity (Ma et al., 2024). Transcriptomic analysis indicates that pod's wall behaves as a modified leaf (Wagstaff et al., 2009), raising the question of how the bean fruit pericarp responds to the needs of developing seeds. Research in Brassica indicates that communication between developing seeds and pods involves mobile signals that affect both structures, promoting the transport of photosynthate from the pod wall to the seed and enhancing the expression of genes involved in the synthesis of reserves (Li et al., 2019). The primary objective of this work is to explore whether the bean fruit pericarp can modify its metabolism to mitigate the negative effects resulting from a reduction in photosynthate supply.
2 MATERIALS AND METHODS
2.1 Plant material
Seeds of the common bean (Phaseolus vulgaris) cv V8025 were sown in hydroponic perlite and irrigated with a complete Hoagland solution as previously described (Bernal et al., 2005). Plants were cultivated in a greenhouse with natural light under 12-hour light and 12-hour dark periods. Daytime temperatures ranged from 24 to 26°C, while nighttime temperatures ranged from 16 to 18°C. The flowers were tagged at anthesis, and fruit age was defined by the number of days after anthesis (DAA). The pedicel phloem was removed using a sharp razor blade at 20 DAA (Li et al., 2019). Fruit pericarps were immediately frozen in liquid nitrogen and stored at −70°C until use.
2.2 Carbohydrate analysis
Soluble sugars (glucose, fructose, sucrose, and maltose) and starch were determined as previously reported (Bernal et al., 2005). The tissue was homogenized in 80% (v/v) ethanol and incubated for 30 min at 80°C. The extract was centrifuged at 12,000 g for 10 min, and the soluble sugars in the supernatant were detected using a Multiskan FC microplate photometer (Thermo Fisher Scientific). Quantification was performed in a sequential assay using NADH formation at 340 nm. In the first part of the reaction, 10–20 μL ethanolic extract was mixed with 150 μL of reaction mixture (50 mM HEPES [pH 7.4], 50 mM KCl, 1 mM ATP, 3 mM MgCl2, 0.5 mM NAD+ and 1 U mL−1 yeast hexokinase [EC 2.7.1.1]). An initial reading was taken, followed by the addition of 1.2 U mL−1 glucose 6-P dehydrogenase (EC 1.1.1.49 from Leuconostoc mesenteroides) in 10 μL of 50 mM HEPES (pH 7.4). After 30 min, a second reading was obtained. The difference between the first and second readings was used to calculate glucose concentration. Next, 1.5 U mL−1 phosphoglucose isomerase (EC 5.3.1.9 from yeast) in 10 μL of 50 mM HEPES (pH 7.4) was added and incubated for 30 min before taking the reading. The difference between the second and the third readings was used to calculate fructose concentration. Finally, 5 U mL−1 invertase (EC 3.2.1.26) in 10 μL of 50 mM HEPES (pH 7.4) was added, and after 30 min, the final reading was registered. The sucrose concentration was calculated based on the difference in readings after the addition of phosphoglucose isomerase and invertase. For maltose quantification, ethanolic extracts were evaporated at 65°C and resuspended in water. Maltose was hydrolyzed in 90 mM HEPES (pH 7.5), 1 mM EDTA, and 2.5 U yeast maltase (EC 3.2.1.20) in a 50 μL final reaction volume for 30 min at 30°C. For maltase inactivation, the reaction mix was incubated for 5 min at 80°C, and glucose was quantified enzymatically. Starch was determined in the ethanol-insoluble fraction. Pellets were resuspended in 1 mL of distilled water and incubated at 80°C for 3 h. After cooling at room temperature, 250 U α-amylase (EC 3.2.1.1) and 270 U amyloglucosidase (EC 3.2.1.3, from Rhizopus) in 0.5 mL of 0.25 M Na acetate buffer (pH 4.5) were added to each sample. After gentle mixing, the samples were incubated for 12 h at 37°C. The next day, the samples were centrifuged at 12,000 g for 10 min, and glucose was measured in the supernatant using the enzymatic method described above.
2.3 14CO2 labelling
Fruit photosynthetic activity was evaluated by the incorporation of 14CO2 following a previously reported procedure (Belmont et al., 2022). Five hours after the light period started, the fruits were placed into a sealed plastic bag, and 14CO2 was liberated from 5 μCi (2.18 GBq mmol−1) sodium [14C] bicarbonate by adding 200 μL of 3 M lactic acid. Fruits were exposed to 14CO2 for 2 h before adding 800 μL of 3 M KOH to neutralize the acid and absorb any remaining 14CO2. One hour later, the fruits were harvested. Seeds and pericarps were separated, frozen in liquid nitrogen and stored at −70°C. For analysis, samples were homogenized in 80% ethanol and incubated at 80°C for 10 min. An aliquot was used to estimate the total incorporation. Extracts were processed as described for carbohydrate analysis, and the amount of 14C in the fractions corresponding to ethanol-soluble sugars and starch was determined. The pellets after starch hydrolysis were resuspended in 500 μL of deionized water, and the incorporation of 14C in the insoluble material was also determined. In all cases, 100 μL was mixed with 3 mL of liquid scintillation Ultima-Gold XR, and the radioactivity was measured using a Beckman LS 6000Ic liquid scintillation counter and expressed as disintegrations per minute (dpm).
2.4 Enzymatic activities
Cytosolic and chloroplast FBPases (cFBPase and chlFBPase, respectively) were partially purified using a previously reported method (Lee and Hahn 2003) with minor modifications. Pods were extracted in an extraction buffer [50 mM MOPS (pH 7.5), 0.25 mM EDTA, 2.5 mM MgSO4, 20% glycerol and complete protease inhibitor cocktail (Roche Diagnostics Gmbh)]. One gram of tissue was ground in a mortar with liquid nitrogen and homogenized with two volumes of extraction buffer (EB). The mixture was centrifuged at 12,500 g for 6 minutes. The supernatant (1.5 mL) was brought to 60% saturation with (NH4)2SO4 and incubated for 30 minutes at 4°C. It was then centrifuged at 12,500 g for 10 minutes. The pellet was resuspended in EB (0.5 mL). This volume was mixed with DEAE-Sepharose resin (0.5 mL) previously washed and equilibrated with EB (1 mL × 3). The mixture was kept under rotary agitation for 15 minutes at room temperature and then centrifuged at 7,000 g for 3 minutes. The unbound fraction (cFBPase) was collected and kept at room temperature until the activity was measured. The resin was washed with EB (1 mL × 3) and eluted with 0.5 mL elution buffer [400 mM NaCl, 50 mM MOPS (pH 7.5), 0.25 mM EDTA, 2.5 mM MgSO4, 20% glycerol and complete protease inhibitor cocktail (Roche Diagnostics Gmbh)]. The mixture was centrifuged at 7,000 g for 3 minutes. The bound fraction (chlFBPase) was collected.
Cytosolic and chloroplast FBPases were assayed at 30°C using a continuous assay coupled to NADH production. cFBPase was assayed in 200 μL final volume of reaction mix [100 mM Tris–HCl (pH 7.5), 0.2 mM EDTA, 5 mM MgCl2, 0.3 mM NAD+, 1.2 U phosphoglucose isomerase, 0.6 U glucose-6-phosphate dehydrogenase]. The activity of chlFBPase was evaluated in a 200 μL final volume of reaction mix containing 100 mM Tris–HCl (pH 8.7), 0.5 mM EDTA, 12 mM MgCl2, 0.3 mM NAD+, 1.2 U phosphoglucose isomerase and 0.6 U glucose-6-phosphate dehydrogenase. In both cases, the reaction was initiated by adding fructose-1,6-bisphosphate (1 mM for cytosolic and 10 mM for chloroplast FBPases). To evaluate the effect of reduction on cFBPase activity, partially purified fractions were incubated for 30 min at room temperature with 30 mM DTT (Dithiothreitol, threo-1,4-dimercapto-2,3-butanediol).
The activity of SPS was evaluated following a previously reported procedure (Huber et al., 1989) with minor modifications. Pod tissue was ground with liquid nitrogen and then homogenized with three volumes of extraction buffer [50 mM MOPS-NaOH (pH 7.5), 10 mM MgCl2, 1 mM EDTA, 2.5 mM DTT, 0.1% Triton X-100, 25 mM NaF and complete protease inhibitor cocktail (Roche Diagnostics Gmbh)]. The extract was centrifuged at 12,000 g for 15 min at 4°C and the supernatant was precipitated with 15% PEG 10,000 for 1 h at 4°C. Protein was recuperated after centrifugation at 12,000 g for 15 min at 4°C and resuspended in a minimum volume of extraction buffer. SPS activity was assayed under limiting and Vmax substrate concentrations. Under limiting conditions, PEG precipitated protein was incubated with 10 mM UDP-Glc, 3 mM Fru 6-P, 12 mM Glc 6-P, 10 mM Pi, 15 mM MgCl2, 2.5 mM DTT and 50 mM MOPS-NaOH (pH 7.5) in a total volume of 70 μL. Under Vmax condition, PEG precipitated protein was assayed in the presence of 10 mM Fru 6-P, 40 mM UDP-Glc, minus Pi using the same buffer and volumes as the limiting assays. Reactions were terminated after 30 min at 30°C by adding 70 μL of 30% KOH and unreacted Fru 6-P was destroyed by placing the tubes in boiling water for 10 min. After cooling, 1.0 mL of 0.14% anthrone in 13.8 N H2SO4 was added and the tubes were incubated at 40°C for 30 min before measuring the absorbance at 620 nm. The activation state of the enzyme was calculated as the ratio of the activities under limiting and Vmax conditions X100.
2.5 PAGE and western blotting
Samples for electrophoresis were mixed with Laemmli denaturing buffer (Laemmli, 1970) and heated at 95°C for 5 min. Western blotting was performed according to Bernal et al. (2005). Rabbit antibodies against chloroplast and cytosolic FBPases (Agrisera) were used at 1:5,000 dilution, and goat anti-rabbit antibody conjugated with HRP (diluted 1:20,000) was used. The blots were developed with chemiluminescent HRP substrate (Millipore), and the antibody–antigen signal was detected using a ChemiDoc Image System from BioRad.
2.6 RNA extraction
RNA extraction was performed as previously reported (Bernal et al., 2022). Control samples were collected at 20, 21, 23, 25, 27 and 30 DAA. Fruits subjected to carbohydrate restriction were collected at 1, 3, 5, 7 and 10 days after phloem removal (corresponding to 21, 23, 25, 27 and 30 DAA). Plant material was immediately frozen in liquid nitrogen. Total RNA was isolated using TRIzol (Thermo Fisher Scientific), clean-up and concentration were performed using the RNA Clean and Concentrator TM-5 Kit (Zymo Research) according to the manufacturer's instructions. RNA concentration was measured using a Biodrop spectrophotometer, and the quality of the total RNA was assayed by agarose gel electrophoresis.
2.7 Transcript quantification by RT-qPCR
RT-qPCR was performed as previously reported (Bernal et al., 2022). Purified and DNase I-treated RNA was subjected to reverse transcription (RT) using oligo (dT) primers and the Ready Script Synthesis Mix (Sigma). A BLAST search in the Phytozome database (https://phytozome-next.jgi.doe.gov) was conducted using the At1g43670 sequence, which encodes cFBPase (Rojas-González et al., 2015), as well as the At3g54050 and At5g64380 sequences, which encode the redox-regulated and redox-independent chlFBPase isozymes, respectively (Serrato et al., 2009). Sequences encoding chloroplast FBPases (Phvul.008G112000 and Phvul.002G213400) and cytosolic FBPases (Phvul.004G095800, Phvul.004G128900 and Phvul.007G079500) were retrieved. Arabidopsis and Phaseolus sequences were then aligned using CLUSTALW (https://www.genome.jp/tools/clustalw). Specific primers for each selected target were designed using Primer3Plus (Untergasser et al., 2007) with qPCR settings activated (Table S1). qPCR was performed using Maxima SYBR Green/ROX qPCR Master Mix in a CFX96 Touch real-time PCR system (Bio Rad). Relative expression levels were calculated using the 2-ΔΔCt method (Rao et al., 2013) with 20 DAA sample as a reference and ACTIN transcript as an internal housekeeping control. Targets were assayed with at least three biological replicates and three technical replicates each.
2.8 Statistical analysis
Data were analyzed using Prism software (GraphPad) and compared using one-way analysis of variance (ANOVA) with Tukey's multiple comparison post hoc test to determine significance.
3 RESULTS
3.1 Photosynthate restriction modifies seed development
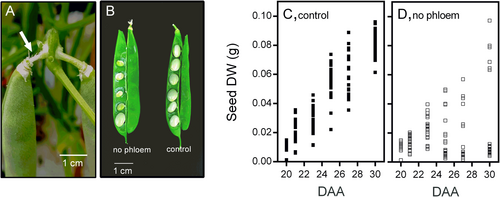
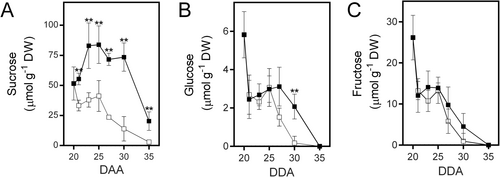
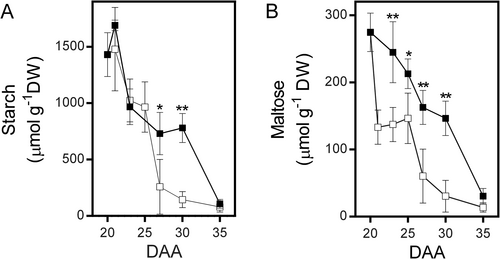
Our recent work has shown that bean fruit pericarp utilizes surplus sucrose for starch synthesis and its later degradation helps to support the accumulation of reserve materials in seeds. This function makes the pericarp crucial for balancing seed growth with the supply of photosynthates. To identify metabolic adaptations in the fruit pericarp that could enhance seed development under reduced photosynthate availability, we removed the phloem at the pedicel level in fruits at 20 DAA (Figure 1A). At this developmental stage, seeds are about to begin the accumulation of reserve materials. The interruption of photosynthate flow resulted in a significant reduction in the number of seeds able to continue their growth (Figure 1B). Under normal conditions, seed growth progressed linearly from 20 to 30 DAA (Figure 1C). However, photosynthate restriction limited the growth of most seeds and five days later, it became evident that most seeds had stopped growing (Figure 1D). Despite this, 1–2 seeds per fruit continued to develop similarly to those under control conditions (Figure 1C, D). As expected, the disruption of phloem continuity caused an immediate reduction in sucrose levels in the fruit pericarp (Figure 2A), while a slight decrease in fructose and glucose levels became evident after five days (Figure 2B, C). The pericarp also accumulated a significant amount of starch that is degraded shortly after 20 DAA when seed growth accelerates. Interestingly, the reduction in photosynthate supply did not immediately affect the rate of starch degradation, which increased five days after the phloem was interrupted (Figure 3A). Maltose, a product of starch degradation that is converted in the cytosol into products transported to developing seeds, was consistently lower in the pericarp of fruits subjected to photosynthate restriction (Figure 3B), suggesting that this condition might accelerate maltose utilization.
3.2 Effect of photosynthate restriction on 14CO2 assimilation and carbon partitioning
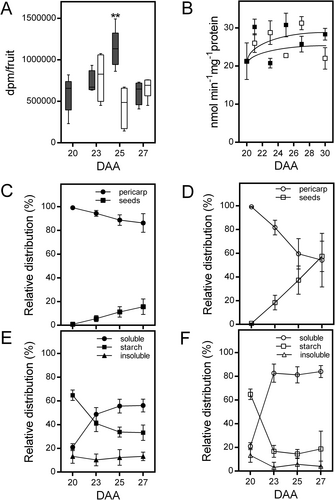
The photosynthetic activity of the fruit significantly contributes to the carbon supply for seed development (Bennett et al., 2011; Cho et al., 2023). To determine whether photosynthetic activity in the bean pericarp increased after phloem interruption, we assessed the incorporation of 14CO2 by fruits between 20 and 27 DAA under both control and restricted conditions. In control condition, 14CO2 assimilation gradually increased to reach a maximum at 25 DAA and then decreased; however, photosynthate restriction caused a significant reduction in assimilation at 25 DAA (Figure 4A). Rubisco activity was not significantly affected by phloem interruption (Figure 4B), suggesting that the observed reduction in 14CO2 assimilation at 25 DAA in fruits with reduced photosynthate supply could be attributed to stomatal closure. Under control conditions, most of the 14C-products remain in the pericarp, with the proportion transferred to seeds gradually increasing to reach up to 15% at 27 DAA (Figure 4C). Analysis of the 14C-products retained in the pericarp revealed that at 20 DAA, up to 60% of the 14C-label was incorporated into starch, and this proportion gradually decreased to 30% at 27 DAA (Figure 4E). The incorporation into the soluble fraction followed an opposite pattern, increasing from 20% at 20 DAA to nearly 60% at 27 DAA. Approximately 10% of the 14C-incorporation was associated with insoluble pod material, and this proportion remained almost constant during the period analyzed (Figure 4E). On the other hand, photosynthate restriction led to a significant reduction in the proportion of the 14C-label that remained in the fruit pericarp, while the proportion transferred to seeds increased to 50% of the 14C-label incorporated at 27 DAA (Figure 4D). Further analysis of 14C-products remaining in the fruit pericarp indicated that this shift was accompanied by a substantial reduction in the proportion of the 14CO2 incorporated into starch, while the incorporation into the soluble fraction increased to 80% (Figure 4F). This change was observed three days after photosynthate supply was reduced, and the ratio remained stable thereafter (Figure 4F), suggesting that metabolic adaptations might occur to facilitate the transfer of resources from the pericarp to developing seeds.
3.3 Photosynthate restriction modulates SPS and FBPase activities
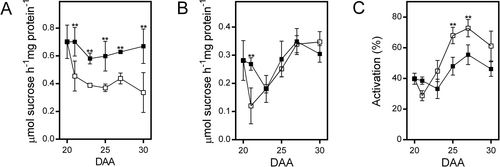
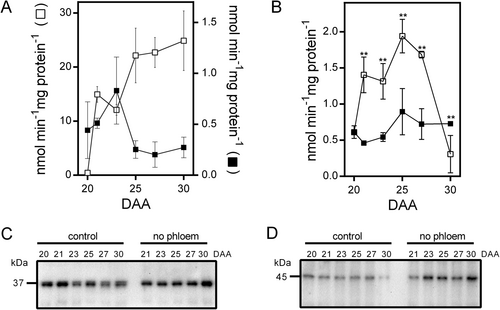
In leaves, the synthesis of sucrose and starch is regulated by the activities of SPS and cFBPase. A reduction in SPS activity leads to decreased sucrose levels (Strand et al., 2000), while the absence of cFBPase results in increased starch accumulation and a decline in sucrose levels (Lee et al., 2008; Rojas-González et al., 2015). To investigate if a similar response occurs in bean fruit pericarp following phloem interruption, we evaluate both activities. The phosphorylation of SPS at Ser 158 inhibits its activity and changes its sensitivity to Glc6P (activator) and Pi (inhibitor); the effect of such modification can be evaluated by measuring the activity under Vmax and substrate limited conditions (Toroser et al., 1999). Under control conditions, the activity of SPS measured under optimal conditions shows a transient decrease at 23 DAA and gradually increases afterward, while the reduction in photosynthate supply caused a significant reduction (Figure 5A); these differences disappeared when SPS activity was measured under substrate limited conditions (Figure 5B). The percentage of SPS activation increased in both conditions after 23 DAA (Figure 5C); the larger increase observed when photosynthate supply is reduced could compensate for the reduction observed when SPS activity was assayed under optimal conditions (Figure 5A). We also evaluated the activity of cytosolic and chloroplast FBPase isozymes (cFBPase and chlFBPase, respectively). Under control conditions, the activity of cFBPase shows a slight increase at 23 DAA, followed by a gradual decrease, while photosynthate restriction caused a consistent increase, reaching up to 20 times at 30 DAA (Figure 6A). The activity of chlFBPase results from the action of two isozymes, one regulated by redox and the other redox-insensitive (Serrato et al., 2009). When DTT was excluded from the assay, control conditions produced a small increase in chlFBPase activity at 25 DAA; the reduction in photosynthate supply led to a twofold increase in activity at 25 DAA, followed by a decrease (Figure 6B). When DTT was included in the assay, activity increased under both conditions; however, the response was more pronounced in control samples (Figure S1). Western-blot analysis revealed that under control conditions, the levels of both cFBPase and chlFBPase isoforms gradually decreased as fruit development progressed, whereas photosynthate restriction led to a significant increase in the levels of both isozymes (Figure 6C, D).
3.4 Photosynthate restriction alters cFBPase and chlFBPase gene expression
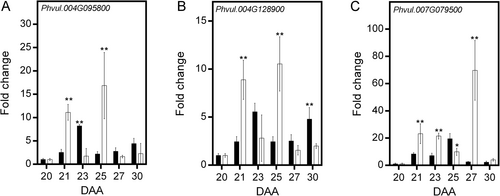
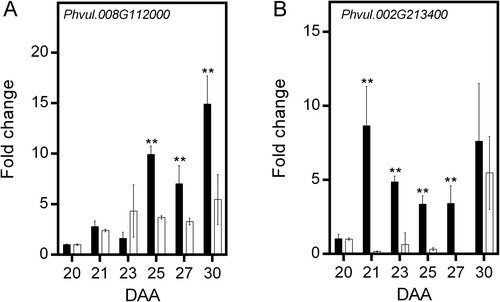
In Arabidospsis, cFBPase is encoded by the gene At1g43670 (Rojas-González et al., 2015), whereas the redox-regulated and redox-independent chlFBPase isozymes are encoded by At3g54050 and At5g64380, respectively (Serrato et al., 2009). A Blast search in the Phytozome v10.3 database (https://phytozome-nextjgj.doe.gov) indicated that in Phaseolus vulgaris cFBPase is encoded by three closely related genes (Phvul.004G095800, Phvul.004G128900 and Phvul.007G079500, Figure S2). The expression patterns of Phvul.004G095800 and Phvul.004G128900 were very similar in both conditions. Under control conditions, both genes exhibited expression peaks at 23 and 30 DAA. Photosynthate restriction increased the response, with the two expression peaks observed at 21 and 25 DAA (Figure 7A, B). The expression of Phvul.007G079500 differed; under control conditions, it gradually increased, reaching a 20-fold increase at 25 DAA before declining. Reduction in photosynthate supply increased expression, reaching a 20-fold increase from 21 to 23 DAA, then increasing to a 70-fold increment at 27 DAA (Figure 7C). The expression of the gene Phvul.008G112000, which encodes a redox-regulated chlFBPase, consistently increased during fruit development, to reach a 15-fold increase at 30 DAA. Under photosynthate restriction, expression increased five-fold at 23 DAA and remained almost constant afterward (Figure 8A). In contrast, under control conditions, the expression of Phvul.002 g213400, which encodes the redox-independent chlFBPase, increased nine-fold at 21 DAA, then gradually decreased, with a similar second peak at 30 DAA. Photosynthate restriction produced a large reduction in its expression, with a five-fold increase observed at 30 DAA (Figure 8B). It is important to point out that the substantial increases in gene expression were not fully reflected in the levels of cytosolic and chloroplast FBPase proteins detected by western-blotting (Figure 8C, D). This discrepancy may be partially explained by the regulation of cFBPase turnover through ubiquitination (Wang et al., 2022), suggesting that this post-translational modification could contribute to the differences observed between messengers and protein levels.
4 DISCUSSION
Seed development is a critical phase in the plant lifecycle, requiring substantial metabolic resources within a short timeframe to build reserves essential for successful germination. This stage is highly sensitive to environmental stresses that can limit photosynthate supply, affecting overall seed yield. Interestingly, bean plants can produce viable seeds under severe photosynthate restriction, suggesting the presence of mechanisms that mitigate the detrimental effects of environmental stress on seed development. While the effects of environmental stress on leaf photosynthesis are well documented, the role of other green tissues in contributing to the overall carbon supply and their importance in counteracting photosynthate shortages during seed development has been largely overlooked (Simkin et al., 2020). This is particularly true for the pericarp in beans. Despite the strong correlation between pericarp dimensions and final seed size was established decades ago (Bravo et al., 1980), the pericarp contribution to seed development remains poorly understood. To investigate whether the bean fruit pericarp can support seed reserve accumulation under reduced photosynthate availability, we removed the green phloem of the fruit pedicel at 20 DAA. This approach has been successfully used in Brassica napus to point out the relevance of the pod to the seed development process (Li et al., 2019).
Phloem interruption led to a substantial reduction in photosynthate supply, as evidenced by the halted growth in most seeds (Figure 1) and the decreased sucrose levels in the fruit pericarp (Figure 2A). The deposition of callose in the phloem sieve plates of the funiculus (Martínez-Barradas et al., 2019) likely contributes to channeling the limited resources to the few seeds that continue to develop. However, the fact that one seed per fruit maintained its growth suggests changes in pericarp metabolism to support this privileged seed. Early in fruit development, the pericarp accumulates starch from surplus sucrose (Belmont et al., 2022), which is later degraded after 20 DAA to support seed reserve accumulation (Bernal et al., 2022). Contrary to our expectations, starch degradation was not an immediate response to carbon deficiency. Instead, the rate of starch breakdown increased only five days after phloem interruption (Figure 3A), when most seeds had already ceased growth (Figure 1D), suggesting that starch breakdown might not be the primary response to photosynthate shortage. Similar results have been observed in Arabidopsis (Pilkington et al., 2015). However, the reduced maltose levels (Figure 3B) could indicate adaptive changes to support seed growth under stress.
The photosynthetic activity of the pericarp contributes significantly to the carbon needed for seed development (Bennett et al., 2011; Cho et al., 2023), a contribution that could be even more critical under stress conditions. In this study, phloem interruption induced minor changes in pericarp 14CO2 assimilation (Figure 4A). However, the analysis of 14C-products revealed that in response to reduced photosynthate availability, the products of pericarp photosynthesis were more efficiently directed to developing seeds. This change was accompanied by a decrease in 14C incorporation into starch and other insoluble materials with a concomitant increase in soluble sugars (Figure 4).
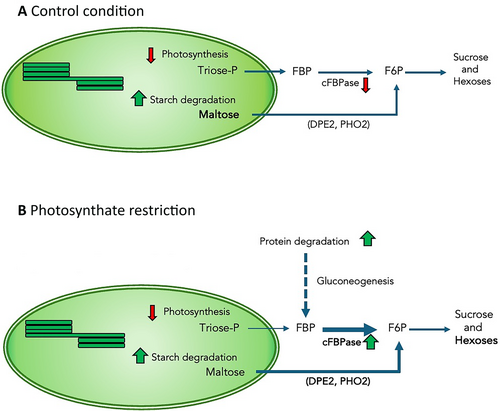
In leaves, the activities of SPS and cFBPase are key regulators of starch and sucrose synthesis and play a crucial role in distributing photosynthetic products throughout the plant (Strand et al., 2000; Lee et al., 2008; Rojas-González et al., 2015). However, this might not be a general response, as the remobilization of starch stored in rice's stems to grains depends on increased SPS activity (Ma et al.,2024). Given that transcriptomic analysis has indicated that the pod wall functions as a modified leaf (Wagstaff et al., 2009), similar regulatory mechanisms might operate in the fruit pericarp. Despite the significant increase in SPS activation state (Figure 5C), our results suggest that the relevance of SPS for the transfer of metabolites from the pericarp to developing seeds did not increase under photosynthate restriction. The involvement of sucrose and hexose transporters like GmSWEET10a and GmSWEET10b in determining seed size, protein and oil contents in soybean (Wang et al., 2020b) suggests that carbon transfer to developing seeds might not rely only on sucrose synthesis. On the other hand, the significant increase in cFBPase activity observed under photosynthate restriction (Figure 5A) is somewhat puzzling from a pericarp physiology perspective. In Arabidopsis photosynthate restriction promotes protein degradation and gluconeogenesis (Pilkington et al., 2015). The fact that photosynthate restriction accelerates the degradation of a storage protein (Zhong et al., 1997; Figure S3) suggests that the significant increase in cFBPase activity under these conditions could promote the utilization of carbon derived from protein degradation for gluconeogenesis (Figure 9). Early stages of fruit abscission induced by a reduction in carbohydrate supply are marked by increased expression of genes associated with starch and sucrose degradation, glycolysis and gluconeogenesis (Li et al., 2015). Additionally, evidence showing that reduced cFBPase degradation leads to higher sucrose and glucose levels (Wang et al., 2022) further supports this hypothesis.
Moreover, cFBPase has also been identified as FINS1 (FRUCTOSE INSENSITIVE1), a protein involved in fructose signaling that can translocate to the nucleus to interact with transcription factors WUS/WOX modulating gene expression in response to fructose (Cho and Yoo, 2011; Li et al., 2023). It is then necessary to investigate if, beside its enzymatic activity, cFBPase has additional roles in orquestating the responses of bean fruit pericarp to photosynthate restriction.
5 CONCLUSION
Our study highlights the pivotal role of the bean fruit pericarp in seed development, especially under conditions of limited photosynthate availability. The observed adaptive mechanisms underscore the pericarp's importance in sustaining seed growth under stress. Further research into the molecular mechanisms driving these responses will provide deeper insights into seed development and plant resilience to environmental challenges.
AUTHOR CONTRIBUTIONS
Lilia Bernal and Eleazar Martínez-Barajas designed the experiments. Lilia Bernal and Eleazar Martínez-Barajas performed the experiments and wrote the manuscript. Patricia Coello, Daniel Padilla Chacón, Lilia Bernal and Eleazar Martínez-Barajas analyzed and discussed the results. Eleazar Martínez-Barajas provided the funding for this work as corresponding author. All authors have reviewed and approved the final version of the manuscript for publication.
ACKNOWLEDGEMENTS
This work was generously supported by the Dirección General de Asuntos del Personal Académico, UNAM (DGAPA, PAPIIT IN 205323 to E. M.-B.) and Facultad de Química, UNAM (PAIP 5000 9127). We also extend our gratitude to the anonymous reviewers for their valuable contribution to enhancing the quality of this work.
Open Research
DATA AVAILABILITY STATEMENT
Data sharing is not applicable to this article as all new created data is already contained within this article.


