Genetic and epigenetic control of dormancy transitions throughout the year in the monoecious cork oak
Abstract
Bud dormancy plays a vital role in flowering regulation and fruit production, being highly regulated by endogenous and environmental cues. Deployment of epigenetic modifications and differential gene expression control bud dormancy/break cycles. Information on how these genetic and epigenetic mechanisms are regulated throughout the year is still scarce for temperate trees such as Quercus suber. Here, the expression levels of CENTRORADIALIS-LIKE (CENL) and DORMANCY-ASSOCIATED PROTEIN 1 (QsDYL1) during seasonal cycles of bud development, suggesting that QsCENL may be implicated in growth cessation in Q. suber and that QsDYL1 is a good dormancy marker. As gene expression can be regulated by the activity of chromatin modifiers, we have analysed the expression of these genes and the deposition of epigenetic marks in dormant versus non-dormant bud meristems. The DNA methyl transferases CHROMOMEHTYLASE 3 (QsCMT3) and METHYLTRANSFERASE 1 (QsMET1) were more expressed in the transition between dormancy to bud swelling. QsCMT3 was also highly expressed during the late stages of active bud formation. Conversely, the HISTONE ACETYLTRANSFERASE 1 (QsHAC1) was up-regulated during growth cessation and dormancy when compared to bud swelling. These results indicate that epigenetic regulation is implicated in how bud development progresses in Q. suber, which can be observed in the different profile deposition of the repressive and active marks, 5mC and H3K18Ac/H3K4me, respectively.
The identification of bud-specific genetic and epigenetic profiling opens new possibilities to predict the relative rate of dormancy/growth of the bud stages, providing tools to understand how trees respond to the current challenges posed by climate change.
1 INTRODUCTION
In temperate perennial plants, bud dormancy is an adaptive response that enables plants to survive during unbefitting environmental cues such as winter low temperatures (reviewed in Lloret et al., 2018; Singh et al., 2017). Dormancy establishment, maintenance and release are critical moments during the yearly cycle of the plant, influencing the timing of the emergence of reproductive structures (Böhlenius et al., 2006; Varkonyi-Gasic et al., 2013). The dormant period occurs with a transient interruption of visible growth, which requires mechanisms restricting cell division and expansion. Studies on dormancy suggest that its release is often determined by the exposure to a cumulative number of hours of low temperatures (chilling requirement) (Fuchigami and Wisniewski, 1997; Falavigna et al., 2019). When dormancy is established, growth is inhibited by intrinsic factors, and the bud remains inactive even when subjected to favourable conditions until the fulfilment of chilling requirements. After that, the bud remains quiescent until suitable environmental cues such as temperature, light and water supply occur, allowing subsequent bud swelling (Anderson et al., 2001). The mechanisms by which dormancy is regulated by day length or/and temperature are species-dependent (Ruttink et al., 2007; Heide and Prestrud, 2005). Phenological evidence in different species has suggested that temperate trees are particularly sensitive to abnormally warm temperatures during autumn, which leads to an out-of-season growth reassumption and blooming. The flowering in autumn may reduce the number of flower meristems available, which should otherwise remain dormant inside the buds until spring, with a potential negative impact on the reproductive success of the tree. Therefore, the understanding of the regulatory networks controlling how bud progresses during autumn and winter is of particular importance to provide potential markers of dormancy status in a scenario of future warmer climate.
Quercus suber is a temperate Fagaceae tree that inhabits regions with contrasting climatic seasons (mild wet- winters and hot dry- summers) (Pereira, 2007). The environmental parameters required for growth cessation and bud swelling in Q. suber remain poorly known (Pinto et al., 2011). Q. suber presents complex bud biology, making it difficult to predict the exact timing of bud dormancy release and flower emergence (Sobral et al., 2020). In summer, during bud development and before growth cessation, male inflorescence primordia differentiate inside the bud (Sobral et al., 2020). Usually, during September/October, Q. suber bud set and shoot growth cessation occurs, lasting until the end of winter or early spring, when bud swelling occurs simultaneously with the emergence of male flowers. A few weeks later, female inflorescences emerge at the axils of newly formed leaves (Sobral et al., 2020). In Q. suber, abnormal vegetative growth and male flowering are frequently observed in unusually warm autumns.
There is some information about the molecular mechanisms by which dormancy induction and release occur in buds of temperate perennial species. The better recognized examples of genes controlling bud development are the DORMANCY ASSOCIATED MADS BOX (DAM) genes and FLOWERING LOCUS T (FT), with a known involvement during dormancy establishment and release in different species. For instance, in Populus sp., the orthologs of the Arabidopsis thaliana gene FT, PtFT2 controls vegetative growth cessation, bud set and dormancy induction (Hsu et al., 2011) while PtFT1 expression induces early flowering (Böhlenius et al., 2006). In the evergrowing (evg) mutant of peach (Prunus persica), the deletion of a locus containing several tandemly duplicated DAM genes prevents dormancy induction (Bielenberg et al., 2004, 2008; Yamane et al., 2008; Li et al., 2009; Jiménez et al., 2010; Sasaki et al., 2011; Wu et al., 2012; Saito et al., 2013; Hao et al., 2015; Howe et al., 2015; Li et al., 2017; Wu et al., 2017). Moser et al. (2020) showed that silencing MdDAM1 in apple results in defective autumn growth cessation. DAM genes are related to SHORT VEGETATIVE PHASE (SVP) and AGAMOUS-LIKE 24 (AGL24) of A. thaliana (Bielenberg et al., 2008), where SVP responds to cold temperatures to repress (Hartmann et al., 2000) and AGL24 to promote flowering (Michaels et al., 2003). SVP/DAM genes are also involved in the annual dormancy cycle of Q. suber (Sobral et al., 2020). The expression of QsSVP1 and QsSVP4 gene expression is high during the axillary bud set and then steadily decreases until March, coincident with the axillary bud swelling in both adult and juvenile trees (Sobral et al., 2020).
The periodic expression of SVP-like/DAM genes is also thought to be controlled by the increase and/or decrease of epigenetic marks such as trimethylation of histone H3 at lysine 4 (H3K4me3), H3 and H4 acetylation (H3ac, H4ac), trimethylation at lysine 27 of histone H3 (H3K27me3) and DNA methylation in specific genomic regions (Horvath et al., 2010; Leida et al., 2012; de la Fuente et al., 2015; Saito et al., 2015; Rothkegel et al., 2017). In peach, higher expression of DAM genes during the chilling period is correlated with the absence of H3K27me3 marks, while the repression of DAM genes during the growing season correlates with an increase in 21-nucleotide small (s)RNAs and noncoding (nc)RNAs, H3K27me3 and CHH methylation (Zhu et al., 2020). Recently, the analysis of genome-wide H3K4me3 modifications in dormant pear buds showed an enrichment of the mark around the transcription start site (TSS) of pear DAM genes at the beginning of an artificial chilling accumulation treatment period, decreasing until the end of the treatment (Gao et al., 2021). A study of the DNA methylome during dormancy in sweet cherry showed that transcriptome reprogramming (including an SVP-like gene) was preceded by modifications in DNA methylation levels and that these modifications may enhance cold tolerance (Rothkegel et al., 2020). Dormancy is also controlled by epigenetic modifications in the sweet chestnut tree (Castanea sativa), another perennial Fagaceae species, where the increase and decrease of DNA methylation levels in buds coincide with bud set and bud swelling, respectively (Santamaría et al., 2009, 2011).
Other genes may be involved in the establishment and release of dormancy. In poplar, CENTRORADIALIS-LIKE 1 (CENL1) delays dormancy release and bud swelling (Ruonala et al., 2008; Mohamed et al., 2010; Rinne et al., 2011; Song and Chen, 2018). On the other hand, DORMANCY-ASSOCIATED PROTEIN 1 (DRM1/DYL1) is considered a dormancy marker whose expression was first detected in axillary buds of pea and in Arabidopsis axillary shoots that were forced to enter dormancy (Stafstrom et al., 1998; Tatematsu, 2005). DRM1/DYL1 is also upregulated in dormant buds of grapevine (Pacey-Miller et al., 2003; Pucker et al., 2020; Velappan et al., 2022), blueberry (Vaccinium corymbosum) (Naik et al., 2007), kiwifruit (Wood et al., 2013) and sessile oak (Quercus petraea) and in dormant seeds of A. thaliana (Carrera et al., 2008).
To better understand the molecular mechanisms that control dormancy processes in Q. suber, we characterized the expression of several gene homologs to known regulators of dormancy and epigenetic modulation during bud development in consecutive years. We also investigated whether the deposition of epigenetic marks occurs differently in different types of meristems in dormant and non-dormant buds.
This study provides tools that may be used to monitor bud development throughout the seasons, in particular, the expression levels of QsCMT3 together with QsDYL1 may help to predict the relative rate of dormancy/growth of the bud stages, which has special relevance in the light of the current challenges posed by climate change.
2 MATERIALS AND METHODS
2.1 Plant material
Axillary and apical bud samples were collected monthly from adult and juvenile Q. suber trees located at the University of Minho campus (https://www.icampi.uminho.pt/pt/ambiente/green/, latitude: 41°33 ‘33.8” N, longitude: 8°23′54.3” W), throughout four annual cycles (summer 2015 to spring 2019). All samples were taken from the tree crown from 9:00 a.m. to 10:00 a.m. using pruning shears, if not mentioned otherwise. The monthly samples of 2015/2016, 2016/2017, 2017/2018 were constituted by a mixture of approximately twenty randomly collected buds from several trees. In 2018/2019, to investigate whether gene expression was similar in different trees, each monthly sampling was made in triplicates, which were used as biological replicates. To analyze the circadian gene expression profile, buds were also collected from adult trees at different time points over the course of the day (24 hours, 4 hour intervals), in October, January and April.
2.2 RNA extraction and cDNA preparation
Total RNA was obtained using the CTAB/LiCl extraction method (Chang et al., 1993) with some modifications (Azevedo et al., 2003). Total RNA was treated with DnaseI (Rnase-free) (New England Biolabs), and 0.5–1 ug of RNA was used for cDNA synthesis using the Invitrogen cDNA synthesis kit SuperScript® RT, according to the manufacturer's instructions.
2.3 Quantitative RT-PCR (qRT-PCR) analysis
Amplification was carried out with SsoFast™ EvaGreen®Supermix (Bio-Rad), 250 nM of each gene-specific primer (Table S1) and 1 μL of cDNA. Transcript-specific primers were designed according to data in the Q. suber transcriptome (Pereira-Leal et al., 2014). Quantitative real-time PCR (RT-qPCR) reactions were performed in triplicates on the CFX96 Touch™ Real-Time PCR Detection System (Bio-Rad). After an initial period of 3 min at 95°C, each of the PCR cycles consisted of a denaturation step of 10 s at 95°C and an annealing/extension step of 10 s at the temperature optimized for each gene-specific primers. With each PCR reaction, a melting curve was obtained to check for amplification specificity and reaction contaminations, by heating the amplification products from 60 to 95°C in 5 s intervals. Primer efficiency was analyzed with CFX Manager™ Software v3.1 (Bio-Rad), using the Livak calculation method for normalized expression (Livak and Schmittgen, 2001). Gene expression analysis was conducted using three technical replicates and normalized with the reference genes QsPROTEIN PHOSPHATASE 2A SUBUNIT A3 (QsPP2AA3) and ELONGATION FACTOR-1ALPHA (QsEF-1α) (Marum et al., 2012).
2.4 Tissue fixation, embedding and sectioning
For morphological and immunolocalization analysis, buds were collected and immediately fixed in 4% (w/v) paraformaldehyde in 1× PBS (phosphate buffered saline: 1x PBS 130 mM NaCl, 7 mM Na2HPO4, 3 mM NaH2PO4, pH 7.4) under vacuum infiltration followed by overnight incubation in the fixative solution at 4°C. Samples were then dehydrated, cleared and paraffin-embedded according to the protocol described by Coen et al. (1990) with some modifications: during the clearing procedure, the tissues were incubated 1 h at room temperature, in each of the following solutions: 75% (v/v) ethanol/25% (v/v) Histo-Clear® (VWR Chemicals), 50% (v/v) ethanol/50% (v/v) Histo-Clear®, 25% (v/v) ethanol/75% (v/v) Histo-Clear®; and incubated three times for 1 h in 100% (v/v) Histo-Clear®. Tissue sections with 8 μm thickness were obtained using a microtome (SLEE) and mounted in pre-coated poly-L-lysine slides (VWR), deparaffined by heating at 65°C for 15 min and washed with Histo-Clear® six times (15 min each), and further rehydrated with a grade of ethanol series (100, 80, 70, 50 and 30% (v/v), 5 min in each solution) ending with deionized water twice (5 min each).
2.5 Immunolocalization of 5-Methylcytosine and Post-translational Histone Modifications
Sections were permeabilized with sodium citrate buffer (10 mM Sodium citrate, 0.05% (v/v) Tween 20, pH 6.0) and by a heat-mediated antigen retrieval treatment, using the microwave at maximum power, for 4 min according to Nic-Can et al. (2013). After cooling down for 20 min, the sections were washed three times in 1x PBST (130 mM NaCl, 7 mM Na2HPO4, 3 mM NaH2PO4, 0.05% (v/v) Tween). After blocking with 8% (w/v) BSA in 1x PBS for 30 min at 4°C, the sections were incubated with primary antibodies diluted in 1x PBST: anti-5mC (1:100 dilution, Abcam AB10805), anti-H3K4me3 (1:50 dilution, Abcam AB8580), and anti-H3K18ac (1:100 dilution, Abcam AB1191) at 4°C during 48 h in a moist chamber. Negative controls were done by replacing the primary antibody with 1 x PBST. After washing in 1x PBST buffer (3 times, 5 min), samples were incubated for 3 h at 37°C, using a solution containing goat polyclonal secondary antibody to mouse or rabbit IgG – H&L conjugated to Alexa Fluor 488 (Abcam AB150113, AB150077), added in a 1:100 dilution. The slides were mounted in EverBrite™ Mounting Medium with 4′, 6-diamidino-2-phenylindole (DAPI, Biotium) and were examined with a Spinning Disk Carl Zeiss Axio Observer Z1 microscope using 10x magnification or with a Plan Apo 63x Ph3- NA1.4 –DIC HCII Oil immersion objective. Images were acquired with an AxioCamMR3 camera controlled by Axiovision 4.8.2.0 software. Zeiss fluorescence filters Set 49 and Set 38 HE were used to excite DAPI, and Alexa Fluor 488, respectively. Z-stacks with 0.2 μm were acquired to allow for the entire nuclei capture. The images of antibody detection and DAPI staining were acquired using the same microscope settings and light exposure times. Evaluation of nuclei fluorescence intensity of z-stack maximum intensity projections was performed using Fiji software (Schindelin et al., 2012) after image deconvolution using Huygens Essential (Scientific Volume Imaging B.V., Netherlands). Nuclear staining intensity was evaluated, at least, in 30 nuclei per meristem. Background fluorescence intensity was measured as the average intensity of inter-nuclear areas and divided from the nuclear staining intensity of each nucleus for correction. The intensity measurement of each epigenetic mark was obtained by dividing the labelling intensity of the specific signal in each nucleus by the correspondent DAPI intensity, as previously described (Bian et al., 2009; Leida et al., 2012; Testillano et al., 2013; Ingouff et al., 2017; Zhai et al., 2018). Data shown is representative of at least three independent experiments and the values are represented by arbitrary units.
2.6 Homology-based search and phylogenetic analysis
In order to identify Quercus suber homologs of known genes involved in dormancy in other species, pea and Arabidopsis DYL (Stafstrom et al., 1998; Tatematsu, 2005), poplar CENL1 (Mohamed et al., 2010) protein sequences were used as queries for BLASTp searches at NCBI for Q. suber (Qs), Vitis vinifera (Vv), Orysa sativa (Os), Jatropha curcas (Jc), Mallus domestica (Md), Arabidopsis thaliana (At), Quercus robur (Qr), Pisum sativum (Ps), Prunus persica (Pp) and Populus trichocharpa (Pt) homologs. The full-length amino acid sequences of each homolog (Table S2) were aligned with CLUSTALW, using the Gonnet Protein Weight Matrix. The Multiple Alignment Gap Opening penalty to 3 and the Multiple Alignment Gap Extension penalty to 1.8 (Hall, 2013) were used as alignment parameters. Phylogenetic analyses were performed with the MEGA 7.0 software program (Kumar et al., 2016) using the Jones-Taylor-Thornton (JTT) correction model, inferred by the Maximum-likelihood algorithm. The resulting trees were constructed based on 1000 bootstrap replicates.
2.7 Statistical analysis
The raw data were imported into GraphPad Prism V6.0 software to calculate descriptive statistic parameters such as means and standard deviations.
Differences in the labelling fluorescent intensity/DAPI intensity between tissues and/or developmental phases were tested through two-way ANOVA followed by Tukey's multiple comparison test at a 5% significance level.
2.8 Meteorological support data
Air temperature and accumulated cold hours (<7.2°C) were determined based on the monthly weather report bulletin (Instituto Português do Mar e da Atmosfera-IPMA) with the data monitored at the nearest meteorological station (Braga-Merelim, 41.57586944,-8.45110833, 65) from University of Minho campus (41.56236104, −8.39401066).
3 RESULTS
3.1 The complex nature of active growth and dormancy periods in Quercus suber
Quercus suber trees have meristematic tissues and organ primordia enclosed in terminal and axillary buds that cease activity and enter dormancy during autumn (Figure S1A), possibly in response to shorter days and/or lower temperatures, similar to what has been described for other Quercus species (Derory et al., 2006). The buds contain vegetative (Figure 1A, red arrows) or both vegetative and reproductive meristems (Figure 1B, highlighted in red boxes) and stay dormant throughout winter, probably due to the persistency of low temperatures. Usually, in late February/March, an increase in day length and/or temperature signals the end of the dormancy period and induces bud swelling (Figure 1C). Male flowers with well-defined anthers (Figure 1D) emerge in the axils of the swollen axillary buds (Figure S1B). In April/May, male flowers complete their development, and new shoots emerge containing young leaves and female flowers (Figure S1C). A new axillary bud emerges in the axils of the leaves that are not flanked by a female flower spike (Figures 1E and S1D). In the buds collected in June/July (Figure S1), the differentiation of male catkin primordia (Figure 1F,G, red boxes) adjacent to the apical meristem (Figure 1F, red arrow) was observed.

The vegetative and reproductive development of Q. suber shows other particularities that are frequently observed in the field. In some years with unusually warm temperatures in autumn or early winter, premature bud swelling occurs with the emergence of male flowers (but rarely female flowers). In spring, many buds fail to swell, and the timing of bud swelling fluctuates between and within trees.
3.2 QsCENL and QsDYL1 were differentially expressed throughout bud development
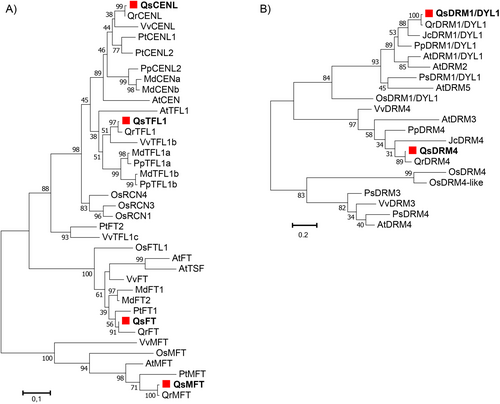
It has been previously suggested that CENL and DYL1 may suppress bud growth in other species (Soeda, 2004; Liu et al., 2007; Ruonala et al., 2008; Mohamed et al., 2010; Rinne et al., 2011; Lee et al., 2013; Footitt et al., 2017) but it is not known if the function is conserved in Fagaceae. Homologous sequences of CENL and DYL1 family members were retrieved from the Q. suber genome by homology-based search. CENL belongs to the FT family, together with FT TERMINAL FLOWER 1 (TFL1), TWIN SISTER OF FT (TSF) and MOTHER OF FT (MFT) (Wickland and Hanzawa, 2015). The phylogenetic tree was divided into distinct clades, each one associated with a different sub-family (Figure 2A). Two homologs belong to the TFL1 clade (QsTFL1 and QsCENL), another to the FT clade (QsFT) and the fourth to the MFT clade (QsMFT) (Figure 2A). Two homologous proteins of DYL1 were found in Q. suber but only one belongs to the DRM1/DYL1 clade (Figure 2B). The phylogenetic tree suggested that QsDYL1 is the closest homolog to PsDYL1/DRM1 and AtDRM1, considered as good dormancy markers in axillary buds of pea and in Arabidopsis seeds, respectively (Stafstrom et al., 1998; Tatematsu, 2005).
The transcription levels of CENL and DYL1 were evaluated during the bud growth-dormancy cycle for four consecutive years. QsCENL expression showed a conserved profile in all the years under study: it was higher during bud set (September/October), then decreased and remained at low levels until March (Figure 3). However, QsCENL was upregulated in the swollen buds (in April) in two of the periods (2015/2016; 2018/2019) (Figure 3). To distinguish the involvement of QsCENL in dormancy vs. flowering development, its expression was also analyzed in buds collected from Q. suber juvenile trees (not competent to flower) in October, January and March. The expression pattern was the same as the one observed in adult trees, with higher expression in October and low expression throughout the following months (Figure S2). To analyze if the QsCENL expression profile is affected by the circadian rhythm, buds were also collected from adult trees at different time points over the course of the day (24 hours, 4 hour intervals), in October, January and April. The expression of QsCENL was higher in the October bud set regardless of the time of day or night (Figure S3).
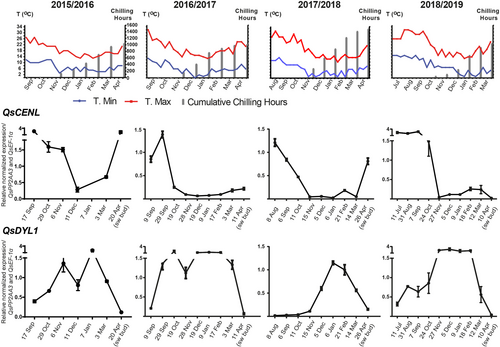
In adult trees, QsDYL1 expression increased after bud set, usually in September/October (Figure 3). Then, the expression decreased until the emergence of swollen buds in April (Figure 3). In juvenile trees, high levels of QsDYL expression were found in October, then, the expression decreased until the end of dormancy (March), similarly to what was observed in adult trees (Figure S2). However, levels of QsDYL expression had significant variation between the years of study. Similarly, bud samples collected at different time points during the day in October and January had significant variations regarding QsDYL transcript levels (Figure S3). Nevertheless, the same trend was observed: higher expression during bud dormancy (January) (Figures 3, S3).
As gene expression can be regulated by the activity of chromatin modifiers, in the following sections, we have analysed the expression of these genes and the deposition of epigenetic marks in dormant versus non-dormant bud meristems.
3.3 The expression of DNA methyltransferases and histone acetyltransferases was switched on and off throughout bud development
A likely epigenetic control of bud dormancy in Fagaceae was first reported in C. sativa with an emphasis on DNA methylation and histone acetylation (Santamaría et al., 2009, 2011). To assess the role of DNA methylation and histone acetylation during bud development, the expression of genes coding for enzymes that catalyze the deposition of these epigenetic marks was analyzed. The Q. suber epigenetic modifiers were phylogenetically identified in a previous study (Silva et al., 2020). Here, we studied gene expression of five DNA methyltransferases (QsMET1, QsDRM2, QsDNMT2, QsCMT3 and QsCMT1) and three histone acetyltransferases (QsHAF1, QsHAM1 and QsHAC1) during bud development (Figure 4 and S3). QsCMT1 transcript accumulation in the buds was very low (Figure S4). An increase in QsMET1 expression was observed prior to April bud swelling (Figure 4), while QsDNMT2 expression generally increased after October and decreased in April (Fig.4). QsCMT3 was highly expressed during late stages of bud formation when the buds were still growing (July to August/September), but the expression decreased gradually from bud set (September/October) to bud dormancy (Figure 4). The expression increased again from February to April, being highly expressed in swollen buds (April) (Figure 4). The expression of QsHAC1 was higher during growth cessation and dormancy when compared to bud swelling (Figure 4). QsHAF1 and QsHAM1 expression profiles were not conserved in the different years (Figure S4).
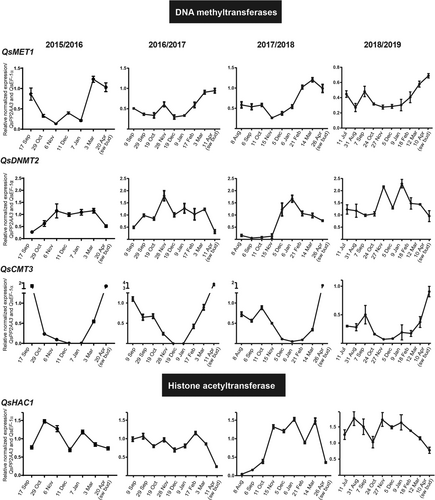
To infer if QsCMT3 up- or down-regulation is associated exclusively with bud dormancy or bud growth instead of reproductive development, its expression was measured in vegetative buds of juvenile trees during two different years. QsCMT3 was downregulated in both years during dormancy establishment (from October to December) and upregulated during dormancy release (March) (Figure S2) in a similar manner to adult trees. The buds collected from adult trees at different time points of the day were also used to analyze the circadian regulation of QsCMT3. The results showed that the gene is always highly expressed in the swollen opened buds (April) and less expressed in the months where bud set is occurring, or dormancy is already established (October and January), regardless of the time of the day at which the samples were collected (Figure S3).
3.4 Differential distribution of epigenetic marks in dormant and non-dormant meristems
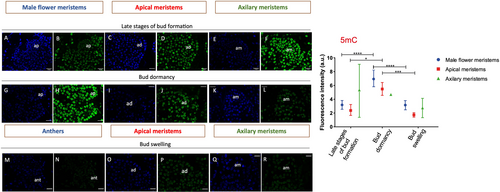
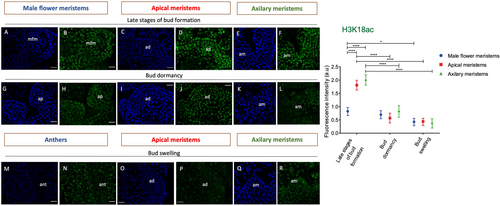
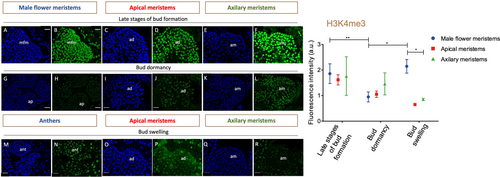
To get insights into how chromatin modifications may affect dormancy, the distribution of epigenetic marks in buds at different developmental stages was analysed. Immunolocalization of the repressive mark 5-methylcytosine (5mC) and active marks such as acetylation of histone H3 at lysine 18 (H3K18ac) and trimethylation of histone H3 at lysine 4 (H3K4me3) (Figure 5) were performed in buds containing both reproductive and/or vegetative meristems or tissues before growth cessation in summer, in dormant winter buds, and during bud swelling in the spring.
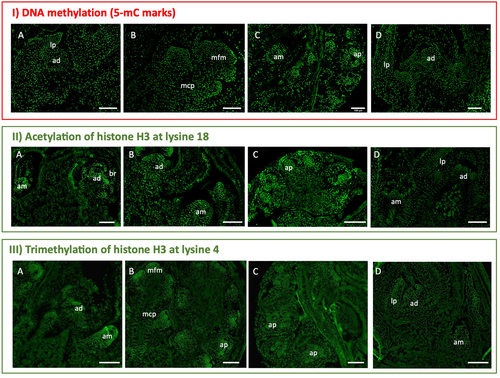
During the late stages of bud formation in the summer, the three epigenetic marks were detected in both apical and axillary meristems (Figure 5A-I, II, III). The marks were also observed in the early stages of male catkin primordia and in the flower meristems found in the already differentiated male catkins (Figure 5B – I, III). Throughout dormancy, the marks were likewise observed in both vegetative and reproductive primordia (Figure 5C-I, II, III), in male flowers and also in the apical and axillary meristems within the swollen bud (Figure 5D-I, II, III).
The intensity level of each epigenetic mark was evaluated in apical and axillary meristems, as well as in male flower meristems, during the late stages of bud formation (summer), bud dormancy (winter) and anters during bud swelling period (spring) (Figures 6, 7 and 8). A higher intensity of 5-mC signal was detected in male flower meristems and in the apical meristems of dormant buds when compared to the corresponding structures of summer and spring (Figure 6). H3K18 acetylation and DNA methylation in the apical meristem showed an opposite pattern regarding the transition from late stages of bud formation to bud dormancy (Figures 6 and 7). In both apical and axillary meristems, H3K18ac signal intensity was higher during the late stages of bud formation (Figure 7D, F). On the other hand, male flower meristems (Figure 7B) had lower levels of H3K18ac in comparison to the terminal (Figure 7D) and axillary meristems (Figure 7F). H3K18ac appeared to be similarly represented in male flower meristems throughout the dormancy-growth cycle (Figure 7B, H, N). Tri-methylation of H3K4 was weaker in male flower meristems of dormant buds (Figure 8H) when compared with the ones found during late stages of bud formation (Figure 8B) and during male flower emergence (Figure 8B). During bud swelling period, H3K4me3 was significantly higher in male flower meristems (Figure 8N) than in axillary meristems (Figure 8R).
4 DISCUSSION
Dormancy transitions are crucial environmental-dependent phenophases in perennial plants since they affect the appropriate time of flower development and, consequently, fruit production. The identification of the DAM/SVP genes as promoters of dormancy in peach was one of the major findings regarding molecular regulation of dormancy transitions, and since then, their involvement in dormancy has been further studied in several other perennial plants such as leafy spurge (Horvath et al., 2008), apple (Mimida et al., 2015), Japanese pear (Ubi et al., 2010; Saito et al., 2013), tea plant (Hao et al., 2017), kiwifruit (Wu et al., 2012), Japanese apricot (Yamane et al., 2008; Sasaki et al., 2011) and in poplar (Singh et al., 2018, 2019). The molecular mechanisms that regulate the induction, maintenance and release of bud dormancy remain poorly understood in Q. suber. In this species, QsSVP1 and QsSVP4 might be involved in the establishment of bud dormancy due to their transcript accumulation (higher during bud set and lower during dormancy and release) and to the ability to delay the flowering time in transgenic Arabidopsis plants (Sobral et al., 2020). Other Q. suber genes possibly involved in dormancy regulation were studied in this work.
In poplar, PtCENL1 down-regulation during growth cessation (Ruonala et al., 2008), is essential for bud release (Mohamed et al., 2010). PtCENL1 is also upregulated in spring when axillary meristem identity is established (Mohamed et al., 2010). In poplar, PtCENL1 and PtCENL2 regulate flowering but have an additional role in maintaining inflorescence identity (Mohamed et al., 2010). QsCENL expression is also higher before and during growth cessation (September/October), decreasing during dormancy (Figure 9), both in adults and juvenile trees, suggesting a role in growth cessation. However, in Q. suber, in two of the four studied periods, QsCENL was also upregulated during bud swelling, which may be indicative of the presence of new inflorescences meristems inside the buds (unknown at the time of bud collection).

QsDYL1 expression appears to increase after growth cessation in September/October, is maintained during the dormancy period (usually between September/October and February), and decreases at bud release. DYL1 expression was considered a good marker for bud and seed dormancy in other species (Pacey-Miller et al., 2003; Tatematsu, 2005; Naik et al., 2007; Carrera et al., 2008; Ueno et al., 2013; Wood et al., 2013). Pucker et al. (2020) proposed that V. vinifera July buds are already on their way to endodormancy, based on the increasing expression of the DYL1 homologue (VviDRM1). In Q. suber, QsDYL1 may also be a good marker for bud dormancy. Interestingly, the upregulation of QsDYL1 partially coincides with the downregulation of QsCENL (Figure 9).
Epigenetic control seems to play an essential role in bud developmental transitions. In this work, we evaluated the expression of several genes coding for enzymes that deposit epigenetic marks. The expression of QsHAC1 is higher during growth cessation and dormancy when compared to bud swelling. In Arabidopsis, HAC1 is involved in flowering time regulation by activating the upstream pathways involved in the down-regulation of the main repressor of flowering gene FLOWERING LOCUS C (FLC) (Deng et al., 2007) and is also more expressed during seed dormancy (Footitt et al., 2015). If the role of QsHAC1 in the acetylation of histones is indeed conserved and consequently associated with active chromatin, perhaps QsHAC1 may target genes that are required to be active in the stages in which growth is arrested. QsMET1 expression is always higher in March, prior to bud swelling. This upregulation seems to precede the swollen bud stage, suggesting that this gene may be involved in sensing bud release signals. In fact, in the vegetative SAM of peach trees, the accumulation of PpMET1 transcripts was associated with the resumption of growth and with the beginning of floral transition (Giannino et al., 2003). QsCMT3 expression decreases from the late stages of bud formation until bud dormancy and then increases again during bud release. This pattern of expression between dormant and non-dormant tissues is completely opposite of QsDYL1 (Figure 9), and further investigation will be required in the future to analyse whether chromatin modifications are implicated in the direct regulation of QsDYL1 and QsCENL expression. Here, we suggest that the expression levels of QsCMT3, together with QsDYL1, may help predict the relative rate of dormancy/growth between samples. CMT3 is essential to methylate cytosines in daughter strands during DNA replication (Bartee et al., 2001; Du et al., 2012). Due to its crucial action during cell division, higher QsCMT3 expression is suggestive of a higher growth rate, while higher QsDYL may be indicative of a higher dormancy state. In summary, bud samples with higher QsCMT3 expression and lower QsDYL1 expression might contain more actively growing tissues than samples with higher QsDYL1 expression and lower QsCMT3 expression. However, it remains unknown if the variation of QsCMT3 expression observed during the year is specific to bud growth-dormancy transitions or if it is likewise differentially regulated in other tissues in which the temporary growth cessation occurs.
Epigenetic regulation controls key developmental genes during the dormancy-growth cycle. Repressive (DNA methylation and H3K27me3) and active (H3K4me3 and H3ac) epigenetic marks have been shown to be present in the promoter regions of transcription factors such as SVP- and FT-like genes (Kumar et al., 2009; Horvath et al., 2010; Leida et al., 2012; de la Fuente et al., 2015; Saito et al., 2015; Rothkegel et al., 2017; Zhu et al., 2020; Gao et al., 2021). The immunolocalization of epigenetic marks allowed us to examine changes in 5-methylcytosine DNA and histone modifications at the cellular level in different tissues inside the buds. Different intensity levels of DNA methylation were observed in dormant buds versus actively growing buds in both apical and male flower meristem nuclei. The fluorescence signal is higher for both meristems in dormant buds. The higher DNA methylation levels in the nuclei of apical meristem in dormant buds are in agreement with what was previously reported in poplar meristems (Conde et al., 2013; Le Gac et al., 2018) and in chestnut (Santamaría et al., 2009). The decrease in DNA methylation during dormancy release was also found in other tissues, such as potato tubers and pepper seeds (Law and Suttle, 2002; Portis et al., 2004). Our results suggest that the cessation or activation of the apical meristems and male flower primordia growth might be related to some de novo methylation or demethylation events. The increase in DNA methylation in dormant buds could be triggered by the de novo DNA methyltransferase QsDRM2, repressing large chromatin regions. In contrast, chromatin regions might be more accessible to transcription during bud growth resumption to induce cell division and meristematic activity. So, a higher level of gene activation marks, such as H3K4me3 and H3K18ac in male flower primordia, during summer and spring was expected. In fact, in male flower primordia, the levels of tri- methylation of H3K4 had a completely opposite pattern to the 5mC labelling, whereas the acetylation of H3K18 remained constant throughout the year. The expression of histone acetyltransferases like QsHAC1, QsHAM1 and QsHAF1 may play a role in the maintenance of euchromatin in some loci in male flower meristems during winter. During later stages of bud formation, H3K18ac accumulation in apical and axillary buds is higher. The reduction in H3K18ac during dormancy might be related to the repression of growth genes, enabling the dormant apical meristem to remain unresponsive in case of exposure to growth-promoting conditions during winter. This was not observed in male flowers. Perhaps genes involved in male flower development may not be properly inactivated during the dormant period since, in some years, unusually hot temperatures trigger male flowers emergence in autumn. The biological replicates of axillary meristems analysed showed quite different values of 5mC and H3K4me3 fluorescence levels, which reflect the heterogeneity of these meristems that can originate either a vegetative or reproductive bud.
The global intensity of specific histone marks and DNA methylation during the dormancy cycle in Q. suber differs between each type of meristems and/or each dormancy stage. Likewise, the expression levels of the enzymes that deposit these marks vary according to the dormancy state, such as QsCMT3. Many of the genes discussed in this work appear to have an association with specific dormancy stages and to be part of some molecular regulatory mechanisms that may cooperate to establish, maintain, and release bud dormancy in Q. suber (Figure 9). This work provides new insights into the molecular mechanisms that may regulate dormancy transitions in this species and may help to monitor bud status throughout the seasons with particular importance in the context of the current climate change.
AUTHOR CONTRIBUTIONS
H.G.S., L.M.-C. M.M.R.C.conceptualized and designed the study. M.M.R.C., L.M.C were responsible for Funding acquisition, project administration and supervision. H.G.S. drafted the manuscript under the guidance of R.S., L.M.-C. and M.M.R.C. H.G.S., R.S., A.T.A., H.R.A. were involved in sample collection and phenological analysis. H.G.S. performed gene expression analysis and immunodetection of epigenetic marks. T.R., P.M.A.S, H.B. contributed to the quantification analysys of epigenetic marks immunodetection. All the authors have read and approved the manuscript for publication.
FUNDING INFORMATION
This work was supported by the FEDER funds through the Operational Competitiveness Programme- COMPETE and by National Funds through FCT—Fundação para a Ciência e a Tecnologia under the projects PTDC/AGR-GPL/118508/2010, “Characterization of Reproductive Development of Quercus suber”. This work is supported by UIDB/04129/2020 Centre grants from FCT, Portugal to LEAF, and by the “Contrato-Programa” UIDB/04050/2020 funded by national funds through the FCT I.P to CBMA. H.S., R.S., A.T.A. and T.R. were supported by funding from FCT with the grants ref. SFRH/BD/111529/2015, SFRH/BD/84365/2012, SFRH/BD/136834/2018 and SFRH/BPD/64618/2009, respectively.
Open Research
DATA AVAILABILITY STATEMENT
Data sharing is not applicable to this article as all new created data is already contained within this article.


