Morphology, photosynthetic and molecular mechanisms associated with powdery mildew resistance in Kentucky bluegrass
Abstract
Kentucky bluegrass (Poa pratensis L.), one of the most widely used cool-season turfgrasses around the world, is sensitive to powdery mildew (PM; Blumeria graminis). The PM strain identification and regulation mechanisms of Kentucky bluegrass in response to pathogens still remain unclear. Through morphological and molecular analyses, we identified that the pathogen in Kentucky bluegrass was B. graminis f. sp. poae. The infection of B. graminis led to a reduction of the sclerenchyma area, expansion of vesicular cells and movement of chloroplasts. The infected leaves had significantly lower values in net photosynthesis, stomatal conductance and transpiration rate, maximal quantum yield of PSII photochemistry, photochemical quenching and non-regulated energy dissipation compared to mock-inoculated leaves. Expressions of light-harvesting antenna protein genes LHCA and LHCB and photosynthetic electron transport genes petE and petH decreased significantly in infected leaves. Furthermore, upregulations of genes involved in plant-pathogen interaction, such as HSP90, RBOH, and RPM and downregulations of EDS, RPS and WRKY were observed in infected leaves. The findings may help design a feasible approach to effectively control the PM disease in Kentucky bluegrass and other related perennial grass species.
1 INTRODUCTION
Powdery mildew (PM), caused by Blumeria graminis, is one of the obligate fungal pathogens that pose a great threat to Kentucky bluegrass (Poa pratensis L.) (Zhang et al., 2022). This pathogen often occurs on Kentucky bluegrass grown in shaded areas or fields used for seed production (Sun et al., 2022). As a foliar disease, PM can severely inhibit plant growth and reduce the ornamental value of turfgrass. The fungus causing PM symptoms is usually seen as isolated wefts of grey-white spore mass and hyphal growth on the surface of leaf blades (Rimelspach et al., 2010). Eventually, the infected leaves turn yellow and wither. Although some Kentucky bluegrass varieties exhibit a high degree of PM resistance, none has complete resistance (Sun et al., 2022). It has been documented that B. graminis (DC.) speer was the causal agent causing PM in most Poaceae plants, such as wheat (Triticum aestivum L.), barley (Hordeum vulgare L.), ryegrass (Lolium perenne L.) (Inuma et al., 2007). Previous studies found that B. graminis was a type of host in Kentucky bluegrass grown in the Qinghai and Henan provinces of China (Bao et al., 2022; Zhu et al., 2021). The conidia in Henan were smaller than those in the Qinghai province, and chasmothecia were not found in the Henan province (Bao et al., 2022; Zhu et al., 2021). Recent trade brought European strains to China, and they hybridized with local ancestral strains (Guo et al., 2022; Sotiropoulos et al., 2022). But to date, the species of pathogen causing PM in Kentucky bluegrass is unclear in the Heilongjiang province, and physiological changes in Kentucky bluegrass induced by PM are rarely reported.
Host plants often exhibit anatomical, morphological, physiological, and molecular changes after fungus infection including B. graminis (Yang et al., 2021). Anatomical changes may represent the resistance of host plants to pathogen attacks (Samiyarsih et al., 2018). As the site of photosynthetic light reactions and carbon fixation reactions, the chloroplast is also a major generator of defence-related signalling molecules or their precursors (Lu et al., 2018). A previous study in wheat demonstrated chloroplast envelope mesophyll cells were disrupted and the thylakoid became enlarged when infected by B. graminis (Aboukhaddour et al., 2020). In rubber (Hevea brasiliensis Muell. Arg.) tree, PM (Oidium heveae steinm.) damaged the structure and function of chloroplasts, caused inner and outer membranes disruption, and decreased maximal photochemical efficiency (Fv/Fm) and electron transport rate (ETR) (Wang et al., 2014). Barley plants infected with B. graminis also showed decreased ETR and non-photochemical quenching (NPQ) (Swarbrick et al., 2006). Significant reductions of net photosynthesis (Pn), stomatal conductance (Gs) and transpiration rate (Tr) and increases in substomatal CO2 concentration (Ci) were observed in PM (Erysiphe alphitoides) inoculated oak (Quercus robur L.) (Vastag et al., 2019) and PM (Podosphaera xanthii) infected pumpkin (Cucurbita moschata) (Chen et al., 2020). In another study, the images of chlorophyll fluorescence parameters showed the emergence of local necrosis in leaves of Artemisia selengensis infected with PM (Golovinomyces artemisiae) (Guo et al., 2022). It appears that pathogen invasion damages the photosynthetic properties and function of the host.
At the molecular level, PM infection alters the gene expression of host plants. For example, genes related to photosynthesis, such as Rubisco (rbcS) and chlorophyll a/b binding protein (cab) genes, were suppressed in response to PM infection (Wang et al., 2014; Kurth et al., 2009). The downregulation of photosynthesis-related genes with the upregulated expression of the pathogenesis-related 1 (PR1) and pathogenesis-related 5 (PR5) were found in wheat infected with B. graminis. In Kentucky bluegrass, differentially expressed genes in photosynthesis were enriched in highly the PM resistant variety and had a feedback effect on plant immune defence (Zhang et al., 2022). When encountering pathogens, the specificity of pathogen recognition is often determined by a pathogen avirulence (avr) gene and a corresponding plant resistance (R) gene (Zhao et al., 2023). In Kentucky bluegrass, two R genes (PRM and RPS) and the RBOH gene were significantly inhibited, while the HSP90 gene was induced after infection with B. graminis (Sun et al., 2022). In Arabidopsis, PM induced the expression of WRKY and RPW genes simultaneously for balancing immunity and growth (Yang et al., 2023). Resistance to PM 8.2 (RPW8.2) interacted with PM protein GcR8IP1 and amplified its expression to boost immunity (Zhao et al., 2023), and RPW8.2 engaged EDS1-dependent and SA signalling to trigger a positive response to PM in Arabidopsis (Xiao et al., 2001). Collectively, molecular regulations can contribute to PM resistance in plants.
Given the complexity of plant-pathogen interactions, mechanisms of plant resistance to B. graminis are not fully understood, especially in perennial grass species. In this study, B. graminis was characterized using light microscopic and scanning electron microscopic (SEM) observations to investigate the responses of Kentucky bluegrass to this pathogen. ITS and 28S rDNA regions were sequenced to support the identification of pathogens. We further dissected chloroplast ultrastructure and examined photosynthetic parameters and related gene expression levels of Kentucky bluegrass infected by B. graminis. The results would reveal PM resistance mechanisms and provide basic knowledge for improving PM resistance of Kentucky bluegrass and other related perennial grass species.
2 MATERIALS AND METHODS
2.1 Plant materials and B. graminis isolation
The seeds of Kentucky bluegrass were collected from field plots at Northeast Agricultural University (Harbin, China; 45°43′55″N, 126°43′21″E). Ten seeds of Kentucky bluegrass were sown in each of ten PVC pots filled with sterile substrate soil in early September. After 30 days of cultivation, the pathogen inoculation was performed. Leaves with typical PM colonies were sampled in October, 2022 and used for insolating pathogen and inoculation. The individual isolate obtained from the farm was purified by single-colony inoculation on healthy seedlings for five consecutive generations (Guo et al., 2022). Culture conditions in greenhouse were set at 20/18°C (day/night) and 12 h of photoperiod (125 μmol m−2 s−1).
2.2 Morphological characterizations of B. graminis
For optical microscopic observation of B. graminis, conidia were removed from pathogen-infected leaves with a dissecting needle and mounted in water (Carl Zeiss Model Axioskop 40). Taxonomic characteristics were recorded, including lengths and widths of conidia, hyphal appressorium, and features of conidiophore. The observations of B. graminis were made for each sample and compared to the species pathogen described previously by Zhu (Zhu et al., 2021).
To observe B. graminis using the scanning electron microscope, infected leaves were cut into small squares sized 5 mm in length around veins, immediately put in a vial containing 2.5% glutaraldehyde and fixed with 2 mL of 0.1 mol L−1 phosphate buffer (pH 6.8) for 3 times, with 10 min each time. The leaves were gradually dehydrated using 2 mL of 50, 70 and 90% ethanol solutions for 15 min each, respectively. Leaves were transferred to a pure tert-butanol solution and stood for 20 min, and then washed with an equal volume of anhydrous ethanol and tert-butanol once and pure tert-butanol twice, with submergence for 15 min each time. Finally, the samples were put in a freezer at −20°C for 30 min and transferred into the ES-2030 (HITACHI) freeze dryer for 4 h. Ice crystals were evaporated and dried in vials, sputtered on a gold-plated film in ion coater, which were then observed and imaged by SEM (Hitachi SU-8010).
2.3 Molecular identification and phylogenetic analyses of B. graminis
Total genomic DNA was isolated from 100 mg of PM (conidia and mycelia) using the CTAB method (Johanson et al., 1994). The sequence of ITS and 28S rDNA were amplified using the ITS1/ITS4 and PM3/TW14 primers pair, respectively (White et al., 1990; Mori et al., 2000). The reaction procedure was 94°C for 10 min, 32 cycles (94°C for 30 s, 57°C for 30 s, 72°C for 90 s), 72°C for 5 min, and 4°C termination. PCR product was purified and ligated to pEASY-Blunt-Zero vector and transformed into Escherichia coli, and a positive strain was sequenced. The sequences were uploaded to the NCBI database and used as queries in BLAST (http://www.ncbi.nlm.nih.gov/BLAST) searches to identify the most similar sequences available in the GenBank. These sequences were aligned for constructing the phylogenetic tree using Clustal W (Thompson et al., 1994). The maximum likelihood (ML) method was used to generate phylogenetic trees based on tandem sequences of the ITS and 28S rDNA genes with the MEGA v.7.0 software (Kumar et al., 2016). Bootstrap analysis was made using 1,000 replications.
2.4 Pathogenicity assays of B. graminis
Different paint brushes were used to dust above purified conidia from B. graminis patch onto healthy seedlings (Attanayake et al., 2010). Mock-inoculated (CK) leaves (ie., no conidia were attached to the leaf surface) were used as controls to monitor and minimize potential contamination. Leaf symptoms were recorded every 1–2 days. Diseased leaves were collected for microscopic examinations to observe the morphological characteristics of the inoculated pathogens. After 14 days, B. graminis f. sp. poae inoculation (BI) and CK leaves were collected to dissect chloroplast ultrastructure and measure photosynthetic indicators and chlorophyll fluorescence (ChlF). Other leaves were immediately stored at −80°C for the determination of gene expression.
2.5 Dissection of leaf structure and chloroplast ultrastructure
Leaf structure was observed by paraffin section (Xie et al., 2020). The leaves of CK and BI were cut into small pieces with a sharp blade. Samples were fixed for 24 h with FAA fixative including 50% ethanol, 100% glacial acetic acid, and 40% formaldehyde. After dehydration with ethanol, samples were placed in pure xylene, and the pure xylene was replaced 3 times for 8 h each time. The samples were soaked in wax for 24 h, during which the pure wax was replaced 5 times. Embedding machine (TB-718D) was used to put the melted paraffin into the carton, and samples were cooled until solidified. Sectioning was performed using a microtome (LS-2065, Shenzhen). After sticking the wax piece on the slide, samples were spread out with slight heat on an alcohol lamp, and then put in an oven to dry. Safranin-fast green staining method was used, with safranin solution for 3 h and fast green solution for 40 s. After the paraffin sections were prepared, they were observed with a bio-optical microscope (Nikon E200MV) at 40 × .
The morphology of chloroplasts was examined by transmission electron microscope (JEOL-1400EX). Fresh leaves of CK and BI were cut into 0.5 × 2 mm rectangular strips with a blade, and placed in a fixative solution including 4% glutaraldehyde and 3% paraformaldehyde. About 10 pieces of each sample were placed in a 2 mL centrifuge tube. After vacuuming, they were fixed in 4°C refrigerator overnight. Then, the samples were rinsed with 0.1 mol L−1 of phosphate buffer (PB, pH = 7.0). The samples were fixed with 1% osmium tetroxide at room temperature for 4 h, and rinsed with 0.1 mol L−1 PB for 4 times, with 15 min each time. Dehydrated samples were sequentially dehydrated with 30%, 50, 70, 85, and 95% gradients of 100% ethanol twice, each for 15 min. Acetone was transferred twice for 20 min each time. The samples were infiltrated once with resin: acetone at ratios of 1:3, 1:1 and 3:1 for twice, and pure resin twice. After infiltration, it was embedded with an embedding medium. Ultrathin sections were performed using an ultramicrotome (EM-UC6) with a slice thickness of 80 nm. Double staining with uranyl acetate and citric lead nitrate was used for observation (Liu et al., 2021).
2.6 Photosynthetic and chlorophyll fluorescence parameters
Photosynthetic parameters were performed using a portable gas exchange system (Li-6400, Li-Cor) (Sun et al., 2021) from 8:00 am to 14:00 pm on a sunny day. The net photosynthetic rate (Pn), intercellular carbon dioxide concentration (Ci), transpiration rate (Tr), stomatal conductance (Gs) of CK and BI leaves were measured. The light intensity was set to 1000 μmol m−2 s−1.
Chlorophyll fluorescence parameters of BI and CK were measured using Imagining-PAM (MAXI) system (WALZ). The value (Ft) of the selected sample AOI areas was set within the range of 0.1–0.2. Plant saturation pulse light frequency was set to 20 s /times, the intensity to 4000 μmol m−2 s−1, and the light intensity for actinic light parameters to 86 μmol m−2 s−1. The plant samples were placed in darkness for 20 min; and then minimum fluorescence (Fo) and maximum fluorescence (Fm) of the samples were recorded by using the measuring light and saturated pulsed light, respectively (Shi et al., 2020). The value and image of NPQ (non-photochemical quenching), Y(II) (actual photochemical efficiency), Y(NO) (non-adjusting energy dissipation yield), qP (photochemical quenching), and electron quantum transport rate (ETR) were obtained through actinic light measurements. Fv/Fm was calculated as: Fv/Fm = (Fm − Fo)/Fm (Maxwell et al., 2020).
2.7 Quantitative real-time polymerase chain reaction
The levels of gene expression were determined by using the quantitative real-time polymerase chain reaction (qRT-PCR). The comparative Ct method was used to analyze the level of gene expression. Primers used for qRT-PCR are listed in Table S1. The relative genes expression was calculated via the 2−∆∆Ct method (Livak et al., 2001). The reaction procedure was as follows: 95°C for 2 min, 35 cycles (95°C for 30 s, 56°C for 30 s, 72°C for 30 s), and 5 min at 72°C. All experiments were performed in three biological and technical replicates, with each containing three technical repeats.
2.8 Data analysis
Data were analyzed using one-way analysis of variance with SPSS v10.0 software (SPSS, Inc.). Mean values were compared with the least significant difference test at the 0.05 probability level. Figures were plotted using R v3.4.0 and GraphPad Prism v 9.00 (Graphpad company).
3 RESULTS
3.1 Morphological observation of B. graminis f. sp. poae
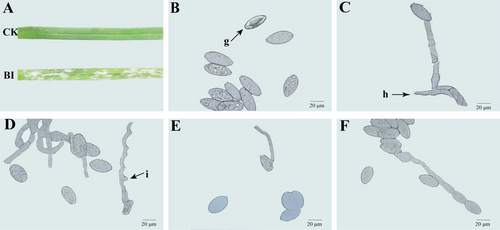
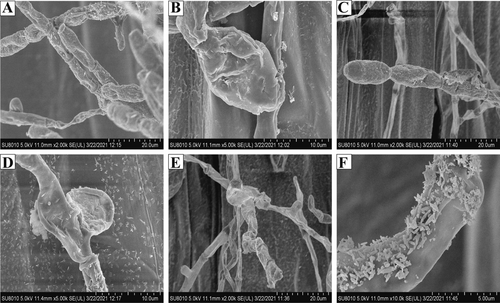
The leaves were the main tissue infected by B. graminis in Kentucky bluegrass (Figure 1A), with whitish colonies and abundant mycelium and conidia observed on surfaces of the infected leaves. Then, the lesions gradually expanded, and the infected parts of the leaves turned yellow. Optical microscopic (Figure 1B, C, F) and scanning electron microscopic (Figure 2A-C) observations revealed that the morphology of conidiophores arose from the hyphae, stood upright, and produced 5 to 10 conidia in a chain. Conidiophores were 102.5 to 154.2 μm in length (average 132.6 μm, n = 50) and spherical at the base (Figure 1C). Conidia produced in chains were ellipsoidal to ovoid with no fibrosin bodies, with size ranging from 22.4 to 35.4 × 12.1 to 18.3 μm (average 28.2 μm × 13.4 μm, n = 50) (Figure 1D-F). Hyphae were hyaline branched and ranged from 2.5 to 6.2 μm (average 4.3 μm) in diameter, while attached appressorium was 4.6 to 7.5 μm in diameter (average 5 μm, n = 50) (Figure 1D, 2E). The bud tube germinated from the base of the conidium, with observation of fragmented surface (Figure 1E). Surprisingly, the B. graminis mycelium was adhered to waxy appendage (Figure 2F). The morphological characteristics of the above-mentioned pathogen was typical of the B. graminis f. sp. poae.
3.2 Molecular phylogenetic analysis and pathogenicity identification of B. graminis
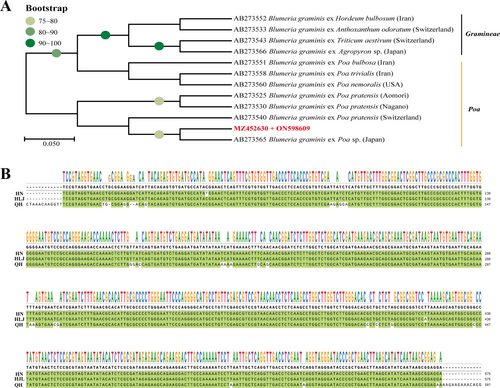
Phylogenetic tree was constructed by using ITS and 28S rDNA region (ITS: MZ452630, 28 rDNA: ON598609) sequence. A high level of sequence similarity (80% bootstrap support) was found between the pathogen isolated in our study and that on Poa sp. in Japan (Figure 3A). The sequences of ITS in Heilongjiang province were compared with those identified previously in Henan and Qinghai provinces of China, and the results showed that the ITS sequence of the fungi in Heilongjiang province was closer to that in Henan province (Figure 3B).
Pathogenicity identification exhibited that the mock-inoculated (CK) leaves remained free of symptoms during the entire period of the experiment in the greenhouse after 8–10 days cultivation. B. graminis f. sp. poae inoculation (BI) leaves showed typical symptoms, which were consistent with the field observations of disease-infected leaves. The experiment was repeated for 5 times and all produced the same results. ITS and 28S rDNA sequences of conidia from the infected leaves further validated the results of the purified B. graminis.
3.3 Leaf anatomy and chloroplast ultrastructure
For uninfected plants, leaf anatomy showed that the upper and lower epidermis was composed of a layer of cells, and the vascular bundles were evenly distributed (Figure 4A). Only mesophyll cells constituted the mesophyll part between the upper and lower epidermis. Furthermore, there was no differentiation of palisade tissue and sponge tissue. The sclerenchyma existed on both sides of the vascular bundle, and the upper epidermis were distributed with bulliform cells. PM infection reduced sclerenchyma area and expansion of vesicular cells in BI leaves compared with CK (Figure 4B), and part of the vascular bundle structure was destroyed in BI.
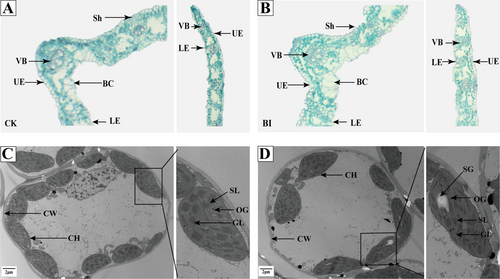
Transmission electron microscope observation further revealed the changes of chloroplast structure after Kentucky bluegrass was infected with B. graminis. Chloroplasts were close to the cell wall with a complete structure with a relatively regular oval shape in CK. The stroma lamellae were tightly stacked, and the grana was neatly arranged. However, stroma lamella and grana became loose in BI. The number of starvation granules and volume of starch granules were significantly increased compared with CK (Figure 4C, D). Chloroplasts also moved from the cell wall to the middle of the cell in BI.
3.4 Photosynthetic parameters and chlorophyll fluorescence
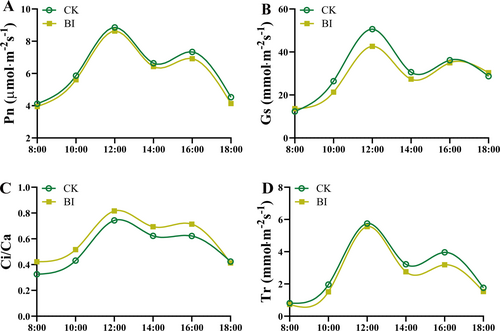
The diurnal variations in Pn followed a bimodal curve in both uninfected and infected leaves. The Pn increased with increasing light intensity, and reached maximum values around 12:00 h. A midday depression in Pn occurred around 14:00 h, then gradually increased in the afternoon and reached the second peak around 16:00 h. The Pn of BI was 16.0% lower than that in CK at peak point (Figure 5A). Similar to the Pn, the diurnal variation in gs also showed a bimodal curve in uninfected and infected leaves (Figure 5B). The gs at 12:00 h was 50.6 and 43.6 mmol·m−2·s−1 in CK and BI, respectively. Compared with CK, the gs of BI decreased the least 13.8% at 12:00 h (Figure 5B). In contrast, the Ci/Ca of BI increased by 60.1% and 45.4% around 12:00 and 16:00 h, compared with the CK, respectively (Figure 5C). The diurnal variation in Ts had a similar trend to that of Pn and Gs. There were no significant differences in Tr at 12:00 h between CK and BI (Figure 5D). A significant difference in Tr appeared at 16:00, when BI was 19.4% lower than CK (Figure 5D).
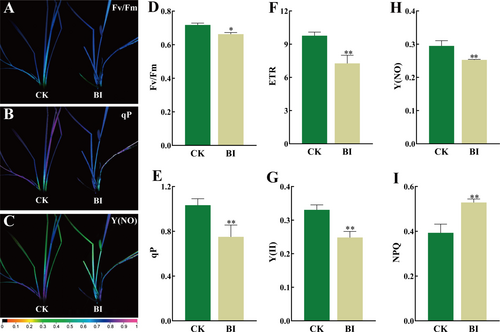
Chlorophyll fluorescence (Fv/Fm) significantly decreased in BI than in CK. Meanwhile, the chlorophyll fluorescence images of PM-infected sites in BI differed from the CK. The value of Fv/Fm was between 0.71 and 0.72 for CK and was below 0.70 for BI (Figure 6D). For parameters related to light energy absorption and electron transfer, the values of qP and ETR in CK were 37.7% and 34.4% higher than those in BI, respectively (Figure 6E, F). Obviously, the occurrence of PM inhibited the photosynthetic capacity in Kentucky bluegrass. The CK and BI had similar same trends in some ChlF parameters associated with light energy consumption such as Y(II) and Y(NO), with 33.2% and 16.6% higher in CK than in the BI, respectively (Figure 6G, H). The value of NPQ was 34.5% higher than BI in comparison with CK (Figure 6I).
3.5 Photosynthesis-related and plant-pathogen interaction genes
Expressions of photosynthesis genes were significantly inhibited by PM in BI (Figure 7A, B). Compared with CK, expression of PSII light-harvesting antenna protein gene LHCA decreased by 52.6% in BI, while expression of PSI light-harvesting antenna protein gene LHCB decreased by 93.8% in BI than that in CK (Figure 7A, B). Expression of photosynthetic electron transport genes petE and petH decreased by 53.5% and 63.8% in BI, compared to CK, respectively (Figure 7A, B).
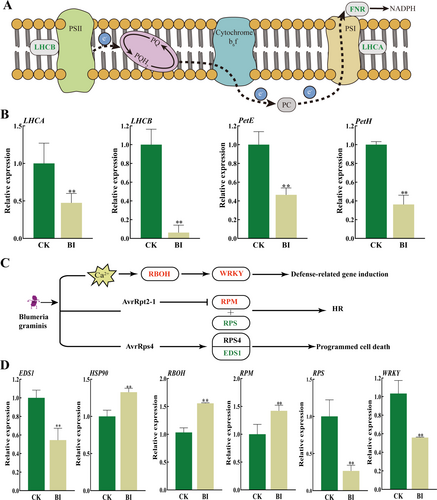
PM infection caused differential expression of genes related to plant-pathogen interactions in Kentucky bluegrass (Figure 7C, D). In comparison with CK, the immune regulator EDS1, the typical NB-ARC class disease resistance gene RPS2, and the WRKY transcription factor were significantly downregulated by 45.5%, 77.0%, and 47.2% in BI, respectively (Figure 7D). Nevertheless, the HSP90 gene encoding heat shock proteins, RBOH gene regulating plant ROS production, and RPM encoding disease resistance protein were significantly upregulated by 132.7%, 155.6% and 142.0% in BI, compared to CK, respectively (Figure 7D).
4 DISCUSSION
Powdery mildew is a foliar disease of lawns that generally weakens grass plants in late summer and fall (Steinberg Gero et al., 2020). Identification of PM fungus species is necessary for a better control of this disease. Many PM fungus species can be identified through morphological characterizations, including the location of the mycelium, the production of conidia singly or in chains, the presence or absence of conspicuous fibrosin bodies, the appressoria, and the size and shape of the conidia (Boesewinkel et al., 1980). In our study, the conidia with no fibrosin bodies were produced in a chain and conidiophores were spherical at the base, which was consistent with the typical characteristics of the genus of B. graminis (Figure 2, 3). Molecular sequence analysis can further facilitate identification of fungus species. For example, the nrDNA ITS sequences are often correlated with the delimitation of different species and formae speciales of the Erysiphales (Kovács et al., 2011). Based on our results of the ITS and 28S rDNA sequences, the phylogenetic tree further confirmed that B. graminis f. sp. poae was the pathogen of PM in Kentucky bluegrass.
The anatomical structure of leaves can somewhat reflect the adaptability of a plant to the environment (Hu et al., 2022). Since sclerenchyma cells are located outside surrounding parenchyma and vascular bundles, they are in a position to protect parenchyma and vascular bundles from fungal invasion in Poaceae (Gui et al., 2011). In rice (Oryza sativa L.), sclerenchyma cells became thickening near the epidermis, and such change could prevent Magnaporthe oryzae penetration at the early stage of infection (Li et al., 2020). In contrast, the reduced number of sclerenchyma cells and a larger volume of vesicular cells observed in BI of Kentucky bluegrass may increase plant susceptibility to B. graminis by enhancing pathogen penetration (Figure 4).
When plants are infected by pathogen, leaf chlorosis or necrosis is often observed, indicating perturbations in chlorophyll biosynthesis or increased degradation (Lu et al., 2018). In addition to discoloration, damages of the chloroplast structure also occurred in BI found in this study, which can inhibit photosynthesis. This was supported by the decreases of Pn, Tr, and Ci in the infected leaves (Figure 5). Similarly, early infection by PM (O. heveae steinm.) altered structure and function of chloroplasts and caused decreases in Fv/Fm and ETR in rubber tree (Wang et al., 2014). The decrease of Fv/Fm, qP and ETR were also shown in BI, reflecting the damages to the photosynthetic apparatus. Previous study in barley showed that increasing the NPQ level in PM-infected leaves, which could dissipate excess light energy absorbed by the light-harvesting complex (Swarbrick et al., 2006). Therefore, the progressively increased NPQ found in BI indicated the photooxidative damage. It can be further inferred that PM caused a decreased energy level used for photochemical reactions (Jitka et al., 2010), resulting in the reduction of the photosynthetic rate in Kentucky bluegrass following B. graminis infection.
Explorations of genes regulation involved in photosynthesis and disease resistance are of importance in elucidating molecular responses to PM infection (Hu et al., 2020). In our study, the decreased LHCA and LHCB gene expressions in BI suggested the restriction of photosynthesis, and decreased expressions of petH and petE indicated the limitation of photosynthetic electron transport (Figure 7), which agreed with the idea that photosynthesis genes took part in PM resistance in rubber and oak (Wang et al., 2014; Kurth et al., 2009). The downregulation of these genes might also activate the defense responses to restrain the fungus infection in Kentucky bluegrass (Zhang et al., 2022). Another important way to stimulate plant defense response is expression of R genes. It could speculate that the downregulation of RPS2 gene increased the susceptibility of Kentucky bluegrass to B. graminis. This speculation was supported by the results that expression of Arabidopsis NBS-LRR R gene (RPS2) conferred plant resistance to Pseudomonas syringae strains (Axtell et al., 2003). Contrary to the previous results of downregulated RPM gene (Sun et al., 2022), we found an upregulated RPM gene in BI of Kentucky bluegrass. In this study, the WRKY and EDS gene expression levels were repressed in BI, confirming that these genes suppressed RPW expression to resist PM in Arabidopsis (Yang et al., 2023). Also in Arabidopsis, the RBOH and HSP90 were observed as the effector secreted by pathogens (Takahashi et al., 2011). It appeared that RBOH and HSP90 gene were induced and acted a positive role in disease resistance, consistent with our previous study, which indicated that these genes inhibited the PM spread. Further research such as gene editing is needed to fully characterize gene function for PM resistance in Kentucky bluegrass.
5 CONCLUSIONS
The pathogen of PM was identified as B. graminis f. sp. poae in Heilongjiang province by integration of optical microscopic, scanning electron microscopic observations, and molecular analyses. Molecular amplified sequences showed a high similarity between Heilongjiang and Hokkaido (AB273565). The B. graminis infection changed leaf surface morphology, altered the movement of chloroplasts, and inhibited photosynthetic parameters. The B. graminis infection also suppressed the expression of photosynthetic genes and disease-related genes. The expressions of HSP90, RBOH and RPM genes increased rapidly following B. graminis infection. Fv/Fm, qP and Y(NO) could be used as indicators to monitor the disease of Kentucky bluegrass. Our results shed a light on the mechanisms underlying Kentucky bluegrass defense to B. graminis.
AUTHOR CONTRIBUTIONS
F.J. initiated and designed the research. S.X. and D.W. performed the experiments. Z.Y., Z.C. and Li X. analyzed the data. J.Y. and C.J drafted the manuscript.
ACKNOWLEDGMENTS
This research was funded by National Natural Science Foundation of China (No 31971772), major innovation platform construction project in National Center of Pratacultural Technology Innovation and herbaceous plant germplasm investigation project of Shandong Province (No. SDGP370000000202202004592).
CONFLICT OF INTEREST STATEMENT
The authors declare that there is no conflict of interests regarding the publication of this paper.
Open Research
DATA AVAILABILITY STATEMENT
The data that support the findings of this study are available in [repository name] at [DOI/URL]. These data were derived from the following resources available in the public domain: [list resources and URLs].


