Comparative metabolomics analysis reveals secondary cell wall thickening as a barrier to resist Aspergillus flavus infection in groundnut
Abstract
Aflatoxin contamination caused by Aspergillus flavus significantly threatens food safety and human health. Resistance to aflatoxin is a highly complex and quantitative trait, but the underlying molecular and biochemical mechanisms are poorly understood. The present study aims to identify the resistance-related metabolites in groundnut that influence the defense mechanism against aflatoxin. Here, metabolite profiling of resistant (55–437) and susceptible (TMV-2) groundnut genotypes, which exhibited contrasting levels of resistance to A. flavus growth and aflatoxin accumulation under pathogen- or mock-inoculated treatments, was undertaken using liquid chromatography and high-resolution mass spectrometry (LC-HRMS). Non-targeted metabolomic analysis revealed key resistance-related metabolites belonging to phenylpropanoids, flavonoids, fatty acids, alkaloids, and terpenoid biosynthetic pathways. The phenylpropanoids - hydroxycinnamic acid amides (HCAAs) and lignins were among the most abundantly accumulated metabolites in the resistant genotype compared to the susceptible genotype. HCAAs and lignins are deposited as polymers and conjugated metabolites to strengthen the secondary cell wall, which acts as a barrier to pathogen entry. Further, histochemical staining confirmed the secondary cell wall thickening due to HCAAs and lignin depositions. Quantitative real-time PCR studies revealed higher expressions of phenylalanine ammonia-lyase (PAL), 4-coumarate: CoA ligase (4CL), cinnamoyl CoA reductase (CCR2), cinnamoyl alcohol dehydrogenase (CAD1), agmatine hydroxycinnamoyl transferase (ACT), chalcone synthase (CHS), dihydroflavonol 4-reductase (DFR) and flavonol synthase (FLS) in the pathogen-inoculated resistant genotype than in the susceptible genotype. This study reveals that the resistance to aflatoxin contamination in groundnut genotypes is associated with secondary cell wall thickening due to the deposition of HCAAs and lignins.
1 INTRODUCTION
Aflatoxin contamination, majorly caused by the soil saprophytic fungi Aspergillus flavus and A. parasiticus, seriously threatens groundnut profitability and consumer health (Pandey et al., 2019). The permitted level of total aflatoxins in groundnut for human consumption is 4 ppb (parts per billion) in Europe and 20 ppb in the USA (Min et al., 2011). Aflatoxin represents a significant threat as a carcinogenic and hepatotoxic compound for the health of both humans and livestock (Pickova et al., 2021). Globally, aflatoxin contamination leads to an annual loss of more than US$932 million (Kumar et al., 2021). Despite decades of research on groundnut (Arachis hypogaea L.), only limited success has been obtained in developing resistant varieties, partly due to high environmental variability and the lack of highly resistant donors in the cultivated species (Nigam et al., 2009). Further, molecular and biochemical mechanisms underlying the aflatoxin resistance must be better understood and efficiently utilized in groundnut breeding.
Resistance to aflatoxin-producing A. flavus in groundnut has been divided into three types: (a) resistance to pod wall infection, (b) resistance to seed coat infection and colonization, and (c) resistance to aflatoxin formation by cotyledons (Bhatnagar-Mathur et al., 2015; Pandey et al., 2019). The resistance to pod infection is attributed to the pod-shell structure, which acts as a physical barrier (Commey et al., 2021; Mendu et al., 2022). On the other hand, the resistance to seed invasion and colonization is due to the moisture content and heat stress that is correlated with the density and thickness of palisade cell layers, fungistatic phenolic compounds, and presence of wax layers, indicating that the phenolic compounds and proteins play a critical role in groundnut aflatoxin resistance (Liang et al., 2005). Advances in functional genomics approaches, such as transcriptomics, proteomics, and metabolomics, revealed resistance's molecular and biochemical mechanisms (Yang et al., 2014). Transcriptomic studies have reported the induction of lipid, flavonoid, and carbohydrate metabolic pathways in resistant groundnut genotypes compared to susceptible ones during A. flavus infection (Soni et al., 2020; Soni et al., 2021). In addition, the comparative proteomics analysis of transgenic groundnut expressing Mt-Defensin and wild type-JL24 revealed a higher accumulation of phenylpropanoids and fatty acids in transgenic plants following A. flavus infection (Bhatnagar-Mathur et al., 2021). Nevertheless, transcriptomics and proteomics have detected several resistance genes that failed to decipher the resistance mechanisms, as they are not as close to the phenotype as metabolites (Fiehn, 2001). Considering these, it is essential to shift the gears and invest efforts and resources in identifying the secondary metabolites inhibiting aflatoxin biosynthesis.
The use of metabolomics can unveil the biochemical responses within host-plant interactions, especially in the face of biotic and abiotic stresses. In groundnut genotypes, the derivatives of hydroxybenzoic and hydroxycinnamic acids, pivotal biochemicals in the seed coat to inhibit A. flavus infection and colonization, were identified (Commey et al., 2021). Notably, the study's data heavily relied on high-performance liquid chromatography (HPLC). This method discerns compound accumulation by comparing them with established standards, thereby presenting some limitations in the detection range. Nonetheless, non-targeted metabolomics has proven successful in identifying host biochemical resistance mechanisms in various crop plants against a multitude of pathogens (Kushalappa et al., 2016). Through liquid chromatography high-resolution mass spectrometry (LC-HRMS), non-targeted metabolomics has uncovered resistance-related metabolites against pathogens (Gunnaiah et al., 2012; Yogendra et al., 2015). Plants have evolved effective defense responses, including recognizing pathogens and monitoring cell wall integrity. This, in turn, leads to secondary cell wall thickening, a crucial defense mechanism to impede disease progression (Bellincampi et al., 2014). Additionally, the deposition of hydroxycinnamic acid amides (HCAAs), lignin, and flavonoids serves to thicken cell walls, confining the pathogen to the initial infection site. This phenomenon has been observed in various crops such as wheat (Gunnaiah et al., 2012), barley (Kumar et al., 2016), potato (Yogendra et al., 2015), and Arabidopsis (Muroi et al., 2009). These compounds function as both physical barriers and chemical antagonists against invading pathogens (Kaur et al., 2022). The present study was formulated to investigate the biochemical and molecular foundations of resistance in groundnut against aflatoxin contamination. The approach involved analyzing variations in metabolite concentrations in two contrasting groundnut genotypes varying in resistance to A. flavus infection. The primary objective was to pinpoint metabolites associated with resistance in the resistant genotype. The two contrasting genotypes activated distinct metabolic pathways as part of their resistance mechanisms. Previous findings indicate that the resistant genotype showcased a higher concentration of phenylpropanoid metabolites, suggesting a crucial role in conferring resistance to aflatoxin contamination. This resistance mechanism involves enhancing secondary cell wall thickening through the deposition of polyaromatic domains of suberin (Liu et al., 2022) and lignins (Liu et al., 2018; Lee et al., 2019). Therefore, the candidate metabolites were mapped onto metabolic pathways to identify their biosynthetic candidate genes based on genomic databases. Based on metabolomics, the candidate genes identified here demonstrated a genotype-specific metabolic pathway regulation unraveling the resistance mechanisms in groundnut to A. flavus infection.
2 MATERIALS AND METHODS
2.1 Plant material
Arachis hypogea seeds of the resistant genotype (55–437) and susceptible genotype (TMV-2) were obtained from the groundnut breeding unit at ICRISAT, India. 55–437 is a drought-tolerant Spanish-type genotype derived by pedigree selection from plant materials received from Hungary at the National Centre for Agronomic Research in Bambey, Senegal. TMV-2 is a Spanish-type groundnut derived by mass selection from Gudiatham bunch (AH-32) at the Department of Oilseeds, Tamil Nadu Agricultural University, Coimbatore, India. These genotypes were selected based on their consistent low and high aflatoxin contamination in previous studies (Commey et al., 2021).
2.2 Inoculum preparation and inoculation
Aspergillus flavus toxigenic strain AF 11–4 obtained from the groundnut pathology collections at ICRISAT, India (Mehan et al., 1995) was used for fungal bioassays. The fungal cultures were grown on Potato Dextrose Broth (PDB) medium (Himedia; product no. GM403) at 30°C in the dark and maintained as 30% glycerol stocks at −80°C. For inoculum preparation, the fungus was multiplied on soaked and autoclaved groundnut seeds, to which 5 mL of A. flavus spore suspension was added. These were incubated at 30°C for 4–5 days to allow sporulation. Virulent spores were collected in sterile distilled water containing 0.05% Tween 20 and diluted to a concentration of 5x10⁴ spores/mL using a Neubauer hemocytometer and the colony forming units (CFUs) determined by standard 10-fold dilutions to obtain ~40,000 cfu/mL on A. flavus parasiticus agar (AFPA) medium (Sigma Aldrich; Product no.17121) (Pitt et al., 1983).
Postharvest-stored mature seeds from the resistant and susceptible groundnut genotypes were used for aflatoxin quantification. Seeds were washed with 70% ethanol, soaked in 0.1% mercuric chloride for 4 mins, and then washed thrice with sterile water. Further seeds were soaked in sterile water, followed by the removal of seed coats to eliminate the potential barrier to A. flavus infection and growth. The embryonated half of the cotyledon was further divided into two pieces and placed in Petri dishes containing sterile agar (1.7% agar/water; w/v; 12 halved cotyledons per plate), with cut surface exposed. Each piece was infected with 2 μL of A. flavus spore suspension containing 5x10⁴ spores/ml (Arias et al., 2015). The Petri dishes containing the inoculated half seeds were then covered with the lid (not sealed to allow aeration), arranged in a tray, and incubated under aeration at 30°C in the dark, maintaining humid conditions to promote fungal growth. The inoculated samples were collected at 72 hpi (hours post-inoculation) and were observed for visual scoring based on the intensity of mycelial colonization on the seed surface. Further, samples were used for aflatoxin estimation using indirect competitive ELISA (Waliyar and Sudini, 2012). The infected seed sample was incubated with 1 mL methanol (HPLC grade) in the dark for 16 h at room temperature. Sample extracts were used for quantitative ELISA using the standard protocol.
2.3 Fungal biomass quantification
The 72 hpi seed samples were collected and observed for visual scoring based on the intensity of mycelial colonization on the seed surface. The relative biomass of A. flavus in the infected cotyledons was quantified based on quantitative PCR (qPCR) (Prasad et al., 2023) using three replications. Genomic DNA was isolated from A. flavus infected cotyledons at 72 hpi using PureLink Plant Total DNA Purification kit (Invitrogen). qPCR was performed using SYBR Green mix (Bioline) in a CFX96™ Real-Time System (Bio-Rad) according to the manufacturer's instructions. Fungal gene-specific primers (FLAV) were used to amplify the A. flavus ITS2 region (Sardinas et al., 2011), and groundnut ADH 3 (EG529529) (Reddy et al., 2013) was used to amplify groundnut DNA using qPCR, according to the manufacturer's instructions (Table S1).
2.4 Metabolite extraction and LC-high-resolution MS (LC-HRMS) analysis
The experiment was conducted as a completely randomized block design, with two contrasting groundnut genotypes (55–437 and TMV-2) and two types of inoculations (pathogen and mock), with three replications (one plant per replication, all groundnuts from that plant). The mature seeds were infected with A. flavus and water and harvested at 48 hpi. There were four samples for metabolite extraction and LC-HRMS: RP (resistant genotype with pathogen inoculation), RM (resistant genotype with mock inoculation), SP (susceptible genotype with pathogen inoculation), and SM (susceptible genotype with mock inoculation). Samples were flash-frozen in liquid nitrogen and stored at −80°C, and 100 mg of the sample was homogenized into a fine powder (Salem et al., 2017). The metabolites were extracted from this using 80% aqueous methanol with 0.1% formic acid (De Vos et al., 2007) and analyzed in a positive ionization mode using The Waters I-Class Ultra Performance Liquid Chromatography coupled to a Waters Xevo G2-XS utilizing Electrospray Ionization-Quadropole Time of Flight-Mass Spectrometry system (UPLC-XEVO-G2-XS- ESI-QTOF) equipped with an ACQUITY C18 column (10 cm × 2.1 mm, particle size 1.7 μm, Waters) containing LC–MS grade water in 0.1% formic acid (v/v; mobile phase A) and methanol in 0.1% formic acid (mobile phase B). The mass resolution was set from m/z 50 to 2000 and recorded in centroid mode. All the acquisitions were performed using leucine encephalin (Leu-Enk, m/z 554.262) as a standard for mass calibration, and MS/MS fragmentations were performed at a normalized collision energy of 40 eV. Data was collected with MassLynx™ V4.1 workstation in continuum mode.
2.5 LC-HRMS data processing
The LC-HRMS output raw data files were converted into mzXML format using MZmine-2 with the high-sensitivity peak detection algorithm ADAP wavelets (Pluskal et al., 2010). The observed masses, m/z, retention time, and abundance (relative intensity) of compounds were imported to MS Excel; peaks that were inconsistent among replicates and those annotated as isotopes and adducts were excluded from further analyses.
2.6 Metabolomic data analysis
Peak height data of compounds were exported and formatted for data analysis. The metabolites were putatively identified based on two criteria: (1) accurate mass match (accurate mass error (AME < 10 ppm) with metabolites reported in different databases: METLIN, Plant Metabolic Network (PMN), LIPID MAPS, and KEGG and (2) fragmentation pattern match with those in databases or in silico verification (Yogendra et al., 2015). The data was log-transformed and normalized using median values and was uploaded to the MetaboAnalyst 5.0 [https://www.metaboanalyst.ca] (Pang et al., 2021) for Principal component analysis (PCA) and Partial least squares - discriminant analysis (PLS-DA) to observe the overall distribution between samples.
The data with the abundance of metabolites in four samples (RM, RP, SM, and SP) with three biological replicates were averaged and subjected to pairwise Student's t-test for four comparisons: RM_ SM, RP_SP, RP_RM, and SP_ SM. The fold change (FC) difference was calculated as the average concentration of metabolites in R samples and the average concentration of metabolites in S samples. Differentially accumulated metabolites were selected using the criteria of P < 0.05 and log2FC >1.0. Volcano plots were used to visualize and screen differential metabolites based on p-value and fold change value. The volcano plots were generated using SR plot online (https://www.bioinformatics.com.cn/en?keywords=volcano). Venn and heatmap diagrams were generated using Venn Diagram (https://bioinformatics.psb.ugent.be/webtools/Venn/) and Heatmapper software (http://www.heatmapper.ca/expression), respectively.
2.7 Identification of resistance-related (RR) metabolites
The metabolites exhibiting higher abundance in resistant than susceptible samples were considered RR metabolites. These were further grouped into RR constitutive [RRC = RM > SM] and RR induced [RRI = (RP/RM)/(SP/SM)] metabolites.
2.8 Histochemical analysis of groundnut cotyledons
Pathogen- and mock-inoculated groundnut cotyledons were collected at 72 hpi, immediately frozen in liquid nitrogen, and stored at −80°C for histochemical staining of lignin and HCAAs. The cotyledon tissue cross sections of 10 μM thickness were obtained using a CryoStar™ NX50 Cryostat (Thermo Scientific) and collected on glass slides.
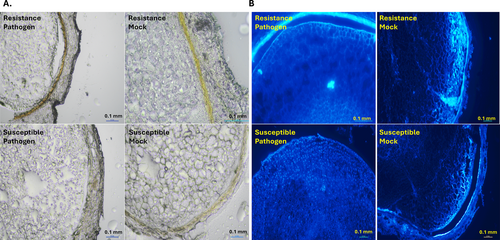
For lignin staining, the cross sections were treated with a (1:3 ratio) mixture of 2 volumes of 3% phloroglucinol in absolute ethanol and 1 volume of concentrated HCl (37 N). Further, the cross sections were observed under a bright field filter using a fluorescent microscope (Nikon). For hydroxycinnamic acid amides (HCAAs) staining, the cross sections were treated with Neu's reagent [1% 2-amino ethyl diphenyl borinate (Sigma-Aldrich) in absolute methanol] for 5 min and washed with distilled water (Alemanno et al., 2003). Neu's reagent stains not only hydroxycinnamic acid amides but also a number of other phenolics and flavonoids with ortho-hydroxy groups, including kaempferol and quercetin (Sheahan and Rechnitz, 1992). The fluorescence of HCAAs was observed under a fluorescent microscope (Nikon) for chemifluorescence with blue laser diode excitation at 405 nm using an HQ442/45 emission filter.
2.9 RNA isolation and quantitative real-time PCR (qRT-PCR)
For quantitative reverse-transcription polymerase chain reaction (qRT-PCR), total RNA was isolated from the pulverized frozen cotyledons inoculated with the pathogen or mock solution at 48 hpi using the RNeasy Plant Mini kit (Qiagen) in three replications. 2.0 μg aliquot of purified RNA was used for cDNA synthesis following the recommended protocol (Thermoscript RT-PCR system, Invitrogen). Quantitative PCR was carried out with gene-specific primers (Table S1) in a CFX96™ Real-Time System (Bio-Rad). For the normalization of cycle threshold (Ct) values, groundnut ADH-3 (EG529529) and G6Pd (EG030635) genes were used as housekeeping genes (Reddy et al. 2013). Relative fold expression was calculated by the 2−ΔΔCt method (Livak and Schmittgen, 2001).
3 RESULTS
3.1 A. flavus infection and aflatoxin estimation
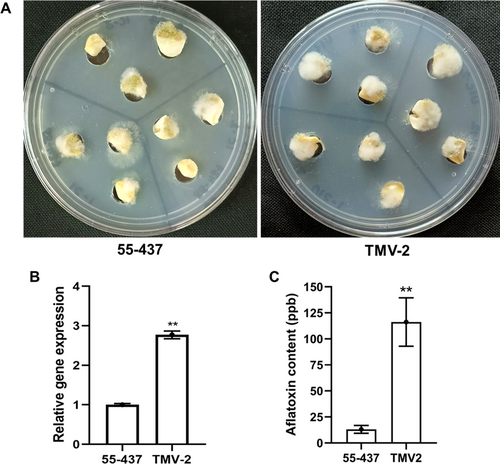
The cotyledons of resistant (55–437) and susceptible (TMV-2) groundnut genotypes were evaluated for fungal resistance using in vitro seed colonization (IVSC) assays using A. flavus toxigenic strain AF 11–4 (Figure 1A). Based on visual scoring, the 55–437 showed less than 50% mycelial coverage of kernels after 72 hpi, compared to TMV-2, which showed over 85% coverage (Figure S1). Furthermore, the fungal biomass in the infected cotyledons of both 55–437 and TMV-2 was quantified by qPCR. At 72 hpi, A. flavus specific gene copy number (DNA, FLAV) was 2.77-fold higher (P < 0.001) in the TMV-2 than 55–437 (Figure 1B). ELISA revealed significantly lower aflatoxin levels in the inoculated 55–437 cotyledons (P ≤ 0.001) than the TMV-2 (Figure 1C). The resistant genotype accumulated 13 ppb of aflatoxin compared to 116 ppb detected in the susceptible genotype, indicating a high resistance level to aflatoxin contamination.
3.2 Differential accumulation of metabolites in cotyledons of groundnut genotypes
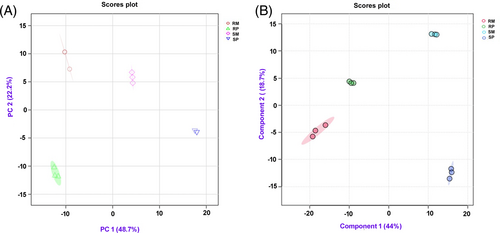
Non-targeted metabolomic analysis was performed to understand the metabolomic changes in the cotyledons of resistant and susceptible genotypes at 48 hpi following inoculation with A. flavus or water. A total of 4146 consistent peaks of monoisotopic masses were detected in all the replicates and treatment combinations. All 2050 metabolites were putatively identified using accurate mass error < 10 ppb and fragmentation matching (Table S2) (Sumner et al., 2007). Next, we checked the robustness and repetition of our experimental design. A principal component analysis (PCA) score plot demonstrated variances between the samples (genotypes and treatments) (Figure 2A). PC1 explained 48.7% variance, discriminating between the resistant and the susceptible genotype. Each genotype formed its cluster of metabolites with a slight overlap between the biological replicates. The PC2 explained 22.2% variance, discriminating pathogenesis and separating pathogen inoculation from mock inoculation. A Partial Least-Squares Discriminant Analysis (PLS-DA) is a supervised method and was subsequently performed to distinguish the overall differences in metabolic profiles between groups. The score plots illustrated the evidence of variation between two groundnut genotypes under mock and pathogen-inoculated treatments (Figure 2B), suggesting minimal experimental error. The PLS-DA score plots verified the results obtained through PCA. This analysis revealed noticeable differences between the samples under mock treatment (RM and SM) and pathogen-inoculated treatment (RP and SP).
A total of 1886 metabolites exhibited a differential response with P < 0.05 and log2FC >1 (Table S3). Venn diagrams were generated to compare metabolites detected in different comparisons for resistant and susceptible genotypes (Figure S2A). A higher number of differentially accumulated metabolites were seen in the RP_RM comparison (1523), followed by SP_SM (1462), RM_SM (1459), and RP_SP (1335) (Figure S2A). However, the highest number of unique metabolites were identified in RM_SM (29) as compared with the other three combinations (Table S4).
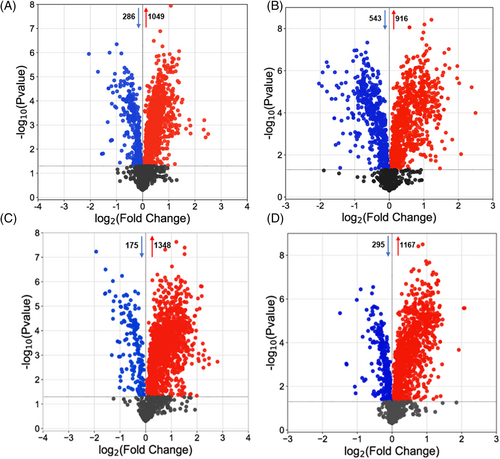
The volcano plot revealed the up-and-downregulation of metabolites in groundnut genotypes after either pathogen or mock treatment (Figure 3). Within the resistant and susceptible genotypes, RP_RM comparison illustrated the highest number of upregulated metabolites (↑1348 and ↓175, Figure 3C) compared to SP_SM comparison (↑1167 and ↓295, Figure 3D). However, when we compared resistant and susceptible genotypes, RM_SM comparison represents the basal metabolome genotypic difference in control conditions with ↑916 and ↓543 metabolites (Figure 3B) without any treatment effect. Interestingly, on the other hand, the RP_SP comparison depicts the differentially accumulated metabolites (↑1049 and ↓286) due to both treatment and genotype effects (Figure 3A). This indicated a clear initial response and a change at the metabolomic level, implying a remarkable reprogramming toward accumulating resistant metabolites (Figure S2B).
3.3 Metabolomic changes in contrasting groundnut genotypes following A. flavus infection
3.3.1 Resistance-related constitutive metabolites (RRC)
A total of 1459 constitutive metabolites were differentially accumulated in the RM_SM comparison, of which 801 metabolites showed higher accumulation in the resistant genotype. These metabolites were confirmed based on database/in-silico fragmentation patterns matching at respective retention time using LC-HRMS and with AME <10 ppm (Figure S3 and Tables S5, S6). These metabolites were designated resistance-related constitutive (RRC) (Table 1). RRC metabolites were classified into different chemical groups to identify the biological pathways that were significantly altered following treatment with either A. flavus or water (Figure 4; Tables 1 and S5, S6). Some of the essential metabolites with their fold change values were as follows: (1) Phenylpropanoids: N-feruloyltyramine (9.10 FC), sesartemin (6.19 FC), (−)-pinoresinol glucoside (5.04 FC), trans-3-hydroxycinnamate (3.54 FC), N1, N5, N10-tricoumaroyl spermidine (2.59 FC) and sinapyl alcohol (2.24 FC); (2) Flavonoids: 2′-hydroxy-2,4′,6′-trimethoxychalcone (11.11 FC), isochamanetin (9.65 FC) and dihydrokaempferol (6.00 FC); (3) Fatty acids: 16-fluoro-hexadecanoic acid (13.55 FC), phytosphingosine (10.32 FC), PS(18:3(6Z,9Z,12Z)/0:0) (11.92) and PE(0:0/20:4;O2) (13.65 FC); (4) Alkaloids: cyclopamine (12.54 FC) and nicotine (10.00 FC); (5) Terpenoids: monotropein (8.83 FC) and secologanate (6.88 FC).
| Observed mass (Da) | Exact mass (Da) | Metabolite name | Fold change (FC) |
|---|---|---|---|
| 162.0313 | 162.0317 | 3-hydroxycoumarin | 1.56 RRC** |
| 162.0672 | 162.0681 | 4-Hydroxycinnamoylmethane | 1.75 RRI**; 2.09 RRC** |
| 164.0468 | 164.0473 | trans-3-Hydroxycinnamate | 3.54 RRC** |
| 178.0625 | 178.0630 | Coniferyl aldehyde | 2.23 RRC** |
| 178.0626 | 178.0630 | 2-Oxo-4-phenyl butyric acid | 2.94 RRC** |
| 181.0735 | 181.0739 | 3-Hydroxy-L-phenylalanine | 1.56 RRC** |
| 206.0599 | 206.0579 | 2-Hydroxy-3-methylbenzalpyruvate | 3.92 RRC** |
| 210.0872 | 210.0892 | Sinapyl alcohol | 2.24 RRC** |
| 216.0427 | 216.0423 | Sphondin | 1.33 RRI** |
| 306.1665 | 306.1692 | Feruloylagmatine | 9.39 RRI** |
| 309.0629 | 309.0637 | N-(6-Oxo-6H-dibenzo[b,d]pyran-3-yl)maleamic acid | 2.38 RRI**; 3.12 RRC** |
| 310.1198 | 310.1205 | 7-Hydroxy-3-(4-methoxyphenyl)-4-propyl-2H-1-benzopyran-2-one | 1.63 RRC** |
| 313.1326 | 313.1314 | N-Feruloyltyramine | 9.10 RRC** |
| 326.1509 | 326.1518 | Dehydrodieugenol | 2.81 RRI** |
| 328.1297 | 328.1311 | (−)-Deltoin | 4.71 RRI** |
| 336.0824 | 336.0845 | 5-O-Caffeoylshikimic acid | 1.74 RRC** |
| 342.1293 | 342.1315 | Coniferol alcohol | 1.36 RRI** |
| 352.0772 | 352.0794 | 4-Methylumbelliferone glucuronide | 1.99 RRI** |
| 368.1076 | 368.1107 | 5-O-Feruloylquinic acid | 2.02 RRC** |
| 372.1188 | 372.1209 | Sesamolinol | 2.02 RRC** |
| 430.1603 | 430.1628 | Sesartemin | 6.19 RRC** |
| 454.1457 | 454.1416 | epsilon-Viniferin | 4.27 RRC** |
| 454.1460 | 454.1416 | Gnetin A | 2.60 RRC** |
| 520.1987 | 520.1945 | (−)-Pinoresinol glucoside | 5.04 RRC** |
| 547.1261 | 547.1227 | Coumermic acid | 2.80 RRC** |
| 554.2867 | 554.288 | Acrovestone | 2.17 RRC** |
3.3.2 Resistance-related induced metabolites (RRI)
A total of 1335 metabolites were differentially accumulated between resistant and susceptible groundnut genotypes in the RP_SP comparison. 333 metabolites were found to be induced at a greater abundance in the resistant genotype and were designated as resistance-related induced (RRI) metabolites (Figure 4, and Tables 1, S7, S8). All these metabolites were further confirmed based on database/in-silico fragmentation patterns and with AME <10 ppm. These metabolites belonged to different chemical groups, and some of the important and high-fold change metabolites were as follows: (1) Phenylpropanoids: feruloylagmatine (9.39 FC), coniferol alcohol (1.36 FC) and 4-hydroxycinnamoylmethane (1.75 FC); (2) Flavonoids: apigenin (18.61 FC), 2′,4′-dihydroxydihydrochalcone (4.66 FC) and 6,3′,4′-trimethoxyflavanone (4.00 FC); (3) Fatty acids: hexadecasphinganine (58.20 FC), PE(18:2(9Z,12Z)/0:0) (5.03 FC) and PG(18:0/0:0) (7.97 FC); (4) Alkaloids: 3′,4′-anhydrovinblastine (8.16 FC) and germine (4.86 FC); (5) Terpenoids: vernoflexuoside (12.32 FC) and resiniferonol (8.07 FC).
3.4 Metabolites related to secondary cell wall thickening
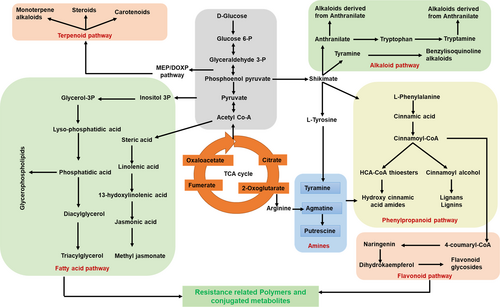
Most of the metabolites from RRC and RRI with high fold-change values belonged to the phenylpropanoid pathway (Figure 5), including the HCAAs - N-feruloyl tyramine, feruloyl agmatine, and lignins- sesartemin, coniferol alcohol, coniferyl aldehyde, sinapyl alcohol, 5-O-caffeoylshikimic acid, sesamolinol, and (−)-pinoresinol glucoside, which are known to be involved in cell wall thickening (Barros et al., 2015; Kushalappa et al., 2016; Liu et al., 2018). A histochemical staining technique was used to confirm lignin deposition and HCAAs in the cell wall. Deposition of lignin (red-pink color intensity) (Figure 6A) and HCAAs (blue fluorescence intensity) (Figure 6B) was observed to be higher in pathogen-infected resistant than mock-treated and pathogen- and mock-treated susceptible genotypes.
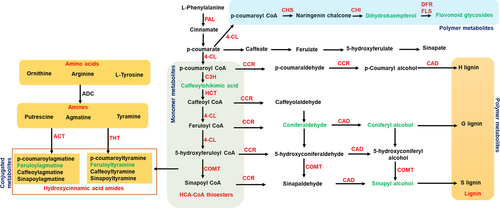
The catalytic enzymes involved in lignin biosynthesis and HCAAs were searched in the PeanutBase (https://peanutbase.org/) and other genomic databases to identify the candidate genes. The candidate genes associated with the RR metabolites were phenylalanine ammonia lyase (PAL, arahy.Tifrunner.gnm2.ann1.V1SQAY.1), 4-coumarate: CoA ligase (4CL, arahy.Tifrunner.gnm2.ann1.IT8P61.1), cinnamoyl CoA reductase (CCR2, arahy.Tifrunner.gnm2.ann1.FW0QWP.1), cinnamoyl alcohol dehydrogenase (CAD1, arahy.Tifrunner.gnm2.ann1.8LFH5W.1), agmatine hydroxycinnamoyl transferase (ACT, XM_025794257.2), tyramine n-hydroxycinnamoyl transferase (THT, XM_025766980.2), chalcone synthase (CHS, arahy.Tifrunner.gnm2.ann1.ALW2B1.1), chalcone isomerase (CHI, arahy.Tifrunner.gnm2.ann1.WYW97W.1), dihydroflavonol 4-reductase (DFR, arahy.Tifrunner.gnm2.ann1.X8EVF3.1) and flavonol synthase (FLS, arahy.Tifrunner.gnm2.ann1.4WXU8P.1) (Table S1).
3.5 Differentially expressed genes in response to A. flavus infection
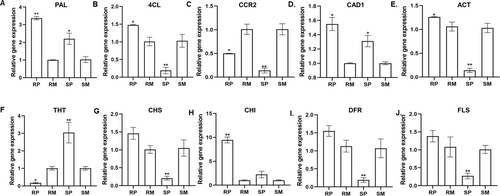
qRT-PCR was performed to analyze the changes in the expression of candidate genes from the phenylpropanoid pathway in resistant and susceptible genotypes following pathogen or mock inoculation (Figure 7). The expression of PAL (1.53 FC), 4-CL (7.64 FC), ACT (8.68 FC), CCR2 (3.50 FC), CAD1 (1.18 FC), CHS (6.86 FC), CHI (4.23 FC), DFR (8.07 FC) and FLS (5.12 FC) was significantly increased in the resistant genotype compared to the susceptible genotype following A. flavus infection. However, the expression of THT (17.90 FC) was significantly (P ≤ 0.05) higher in the susceptible genotype. These revealed substantial agreement for all the genes differentially expressed upon pathogen infection in resistant genotypes and exhibited specific differential expression profiles between the contrasting genotypes.
4 DISCUSSION
Plants have evolved intricate strategies to recognize and establish effective defense responses against pathogen infection. Resistance in plants is controlled by several resistance genes that eventually biosynthesize resistance-related metabolites and proteins that directly suppress and contain the pathogen to initial infection through their antimicrobial and/or cell wall reinforcement properties (Kushalappa et al., 2016; Roumani et al., 2021). This study used integrated metabolomics and gene expression to discover the metabolites conferring resistance and their biosynthetic resistance genes in resistant (55–437) and susceptible (TMV-2) groundnut genotypes against A. flavus infection. Most of the high-fold-change metabolites identified in the resistant genotypes belonged to the phenylpropanoid pathway, especially HCAAs, and lignin. These antimicrobial compounds are known for their role in cell wall thickening (Dangl et al., 2013; Campos et al., 2014; Liu et al., 2018; Liu et al., 2022). Some of these compounds were complex polymers and conjugates, which were not detected in previous studies based on HPLC (Commey et al., 2021). Since hundreds of metabolites additively contribute at varying levels to resistance, only those metabolites with high fold change and known resistance mechanisms were emphasized.
4.1 Resistance to A. flavus infection through secondary cell wall thickening by depositing phenylpropanoid metabolites
We observed differentially induced phenylpropanoid pathway metabolites during the A. flavus infection, which have well-known antioxidants with a role in plant defense (Figure 5). Hydroxycinnamic acid amides (HCAAs) and the precursors of lignin, lignans, and flavonoid glycosides are end products of the phenylpropanoid pathway (Gray et al., 2012). HCAAs have been reported to protect plant cells against pathogen attack by secondary cell wall thickening or directly act as antifungal, antimicrobial, and antibacterial agents (Campos et al., 2014). We observed high fold accumulation of resistant-related metabolites such as N-feruloyltyramine and feruloylagmatine, and their associated candidate genes (PAL, 4-CL, and ACT) were upregulated in the resistant genotype upon A. flavus infection (Table 1 and Figure 7). Furthermore, histochemical staining of HCAAs confirmed the higher intensity of blue fluorescence in the A. flavus-infected resistant genotype compared to susceptible genotype (Figure 6). The HCAAs constitute the polyaromatic domain of suberin, an intractable biopolymer deposited in the cell wall to prevent the spread of the pathogen by increasing the cell wall thickness (Graça, 2010). No studies have reported the accumulation of HCAAs during groundnut-A. flavus interaction so far. Nevertheless, many previous studies have reported HCAAs in different plant-pathogen interactions. For example, high-fold-change accumulation of resistance metabolites N-feruloyltyramine, N-caffeoyltyramine, and N-feruloyloctopamine, along with high-fold-change expression of 4-CL, THT, and tyrosine decarboxylase (TyDC) genes was reported in resistant potato genotypes after Phytophthora infestans infection (Yogendra et al., 2015). During Alternaria brassicicola infection, the expression of AtACT and the associated metabolite (p-coumaroylagmatine) were upregulated in Arabidopsis (Muroi et al., 2009). In addition, overexpression of AtACT increased the resistance to Botrytis cinerea in torenia plants (Muroi et al., 2012). Further, p-coumaroylagmatine and the associate gene, TaACT, were significantly induced in wheat during Fusarium graminearum infection (Kage et al., 2017). These findings suggest that HCAAs prevent the infection of pathogens by being directly involved in secondary cell wall thickening to strengthen the cell wall and reduce its degradation.
Many studies have demonstrated that lignin is a complex polymer of aromatic compounds involved in secondary cell wall thickening in plants (Liu et al., 2018; Lee et al., 2019). Lignin metabolism protects plants from pre- and post-harvest pathogen infections (Zhao, 2016; Mendu et al., 2022). We observed high fold change accumulation of sesartemin, coniferol alcohol, coniferyl aldehyde, sinapyl alcohol, 5-O-caffeoylshikimic acid, sesamolinol, and (−)-pinoresinol glucoside, and the associated genes (PAL, 4-CL, CCR2, and CAD1) were significantly induced in resistant genotype following A. flavus infection. The high intensity of the red-pink color intensity further confirmed the deposition of a higher amount of lignin polymers in the resistant genotype (Figure 6). Lignin accumulation makes the cell wall more resistant to mechanical pressure applied during penetration by fungal appressoria (Bechinger et al., 1999). Our results are consistent with previous work identifying lignin monomers and the associated gene(CAD) as induced in the groundnut resistant genotype following A. flavus infection (Commey et al., 2021). Other studies have also shown that increased lignification and cross-linking of lignins in the stems of the resistant genotype enhance wilt resistance in cotton (Xu et al., 2011). In addition, 4-CL3 enhanced resistance to cotton wilt by promoting vascular lignification (Alariqi et al., 2023). The reinforcement of cell walls in the roots of tomatoes was due to the deposition of lignin and phenolic compounds following fungal elicitor treatment (Mandal and Mitra, 2007). Further, the knockout of monolignol biosynthetic genes made the wheat susceptible to the powdery mildew pathogen Blumeria graminis (Bhuiyan et al., 2009). This suggests that secondary cell wall thickening due to lignin deposition forms a formidable structural barrier, possibly explaining the enhanced resistance against A. flavus infection and growth.
In addition to HCAAs and lignin, high fold change accumulation of flavonoids and their conjugates, including apigenin, dihydrokaempferol, 2′-hydroxy-2,4′,6′-trimethoxychalcone, 2′,4′-dihydroxydihydrochalcone and 6,3′,4′-trimethoxyflavanone were observed in resistant genotype following A. flavus infection. In addition, the biosynthetic genes CHS, CHI, DFR, and FLS were highly induced in the resistant genotype compared to the susceptible one. Flavonoids are antioxidants and antimicrobial compounds that prevent pathogen entry into plants (Ramaroson et al., 2022). Further, flavonoids combined with glycosides form the conjugated polymers deposited on the cell wall to help thicken secondary cell walls (Kushalappa et al., 2016; Yogendra et al., 2017a). The increased resistance to A. flavus infection was consistent with previous findings that showed a significant increase in expression of CHI and DFR in the resistant genotype. This is due to the accumulation of proanthocyanins in the cellular vacuoles, which may act as a secondary barrier, strengthening the seed coat and making it resistant to A. flavus infection (Commey et al., 2021; Castano-Duque et al., 2022). In addition, groundnut testa with higher antimicrobial flavonoids act as A. flavus inhibitors (Turner et al., 1975). Several other studies have also noted that the seed testa has a role in passing enhanced resistance to pathogen infection due to higher accumulation of flavonoids, for example, deposition of glycosylated and methoxylated flavonoids in rachises enhanced resistance in wheat (Gunnaiah et al., 2012) and kaempferol and its glucosylated forms improved resistance in barley (Bollina et al., 2011; Kumaraswamy et al., 2011) against F. graminearum infection. Further, catechin, rutin, and flavanol glycoside were considered to resist P. infestans infection in potatoes (Henriquez et al., 2012). Our results and previous investigations suggest that preformed flavonoids confer durability to cell walls, indicating an essential role in A. flavus resistance.
4.2 Resistance due to antimicrobial fatty acids-related secondary metabolites
We observed differential accumulation of fatty acid pathway metabolites in resistant genotype following infection with A. flavus. In this study, we observed higher accumulation of 16-fluoro-hexadecanoic acid, phytosphingosine, (+)-9,10-dihydrojasmonic acid, PS(18:3(6Z,9Z,12Z)/0:0), PE(0:0/20:4;O2), hexadecasphinganine, PE(18:2(9Z,12Z)/0:0) and PG(18:0/0:0) in resistant genotype during A. flavus infection. Fatty acid metabolites are major structural and metabolic constituents of the cell wall, involved in fatty acid biosynthesis, elongation, and degradation. They were found to be responsive to A. flavus infection in the resistant genotype. Previous reports have also shown that lipoxygenase-mediated hydroperoxy fatty acids production acted as a substrate for oxylipin synthesis (Dave and Graham, 2012), an antimicrobial for various pathogens, including A. flavus (Jayashree and Subramanyam, 2000). Further, free fatty acids (FFAs) linoleic and palmitic acids were induced in the resistant barley genotype, which is deposited as cutin monomers and oligomers to reinforce cell wall to prevent F. graminearum infection (Kumar et al., 2016). Emerging evidence identifies fatty acids as a second messenger and regulator of signal-transducing molecules (Lim et al., 2017; Bhatnagar-Mathur et al., 2021; Prasad et al., 2023). Fatty acids, including α-linolenic acid and hexadecatrienoic acid, mainly involve synthesizing signaling molecules, such as jasmonates, antimicrobial compounds that play a key role in resistance to Aspergillus infection (Van der Ent et al., 2009) by activating systemic acquired resistance (SAR) near the infection site or by activating transcription factor to regulate the downstream resistance genes (Ruan et al., 2019). Our data shows that fatty acids are involved in synthesizing signaling and antimicrobial compounds to act as physical and chemical barriers to the entry of Aspergillus during infection.
4.3 Resistance due to antimicrobial alkaloids and terpenoids-related secondary metabolites
Numerous studies have demonstrated that alkaloids and terpenoids are a diverse group of plant secondary metabolites involved in plant defense against various pathogens through antioxidant and antimicrobial properties (Dixon, 2001; Ali et al., 2019; Huang and Osbourn, 2019). We identified a high fold abundance of alkaloid metabolites (cyclopamine, nicotine, 3′,4′-anhydrovinblastine (8.16 FC), and germine) and terpenoid metabolites (monotropein, secologanate, vernoflexuoside and resiniferonol) in the resistant genotype. No previous studies have been reported on alkaloids and terpenoids providing resistance to A. flavus infection and aflatoxin contamination. However, other plant-pathogen interactions have reported resistance from these antimicrobial compounds. Increased accumulation of antimicrobial benzylisoquinoline alkaloids, codeine-6-glucuronide, and morphine-3-glucuronides in resistant potato genotypes provides resistance to P. infestans infection, which is possibly involved in cell wall reinforcement through cross-linking cell wall pectin (Yogendra et al., 2017b). Further, glycoalkaloids, α-chaconine, and α-solanine were associated with resistance to P. infestans and Erwinia carotovora in potato (Andrivon et al., 2003). In addition, terpenoids are essential to the plant's defense against pests and diseases. Terpenoids can act as phytoalexins, which are small, antimicrobial compounds produced by plants in response to pathogen infection (Ninkuu et al., 2021). Furthermore, terpenoids like phytoalexin and capsidiol 3-acetate act as an antiviral response against RNA virus Potato Virus X (PVX) in Nicotiana benthamiana (Li et al., 2015). Based on our results, we speculated that as our understanding of these compounds grows, we may be able to develop new strategies for using alkaloids and terpenoids to protect against A. flavus infection.
5 CONCLUSION
In conclusion, the current study integrates metabolomics and gene expression data to help understand the molecular and biochemical mechanisms of quantitative resistance in groundnut against A. flavus. Non-targeted metabolomics analysis revealed the crucial role of resistance-related metabolites, and only those with significant effects belonging to phenylpropanoids, especially the HCAAs and lignins, were induced following pathogen infection. We also have shown that the deposition of these metabolites reinforces the secondary cell wall, providing a physical barrier, thus leading to aflatoxin resistance in groundnut. Following validation, the resistance-related metabolites or the genes involved in the biosynthesis of the most significant metabolites can be used as potential biomarkers in breeding to improve quantitative resistance in groundnut against A. flavus infection. Knowledge generated from this research will provide novel targets for precision breeding in groundnuts for resistance to aflatoxin contamination.
AUTHOR CONTRIBUTIONS
Conceptualization: KY and NS; methodology: TA, HS, KP, HKS, and KY; software, KY, HS, and NS; data analysis: KY, HS, KP, and NS; writing—original draft preparation, TV, and KY; writing—review and editing, KP, HKS, NS, and KY; supervision and funding acquisition: KY. All authors have read and agreed to the published version of the manuscript.
ACKNOWLEDGMENTS
This work was carried out with the aid of a grant from the Start-up Research Grant (SRG) (File No. SRG/2021/000422) from the Science and Engineering Research Board (SERB), Govt. of India. The authors thank Dr H. B. D. Prasada Rao for providing the microscopy facility and facility to conduct histochemical staining experiments.
Open Research
DATA AVAILABILITY STATEMENT
The data that support the finding of this study are available in the Supplementary Figures S1- S3 and Supplementary Tables S1 - S8 of this article.


