Physiological and transcriptomic analysis provides novel insight into growth in Kam sweet rice under different nitrogen supplies
Abstract
Kam Sweet Rice (KSR) is a rice cultivar cultivated for thousands of years in China. Proper and balanced use of nitrogen sources is essential for achieving optimal growth and yield in KSR. This study was carried out to find the most effective hydroponic nutrient solution for cultivating and promoting the growth of KSR. Different nitrogen treatments were applied to KSR cultivars GouDan (GD), GouHa (GH), HongHe (HH), LeiLongGang (LG), and ZaiBianXiaoXiangHe (ZH), resulting in noticeable changes in both growth and physiological traits. Our findings revealed that D3 treatment [1.2 mM NH4Cl + 2.4 mM NaNO3+ neutral amino acids (0.1 mM Ser + 0.2 mM Thr + 0.2 mM Gly + 0.2 mM Pro +0.3 mM Ala)] had a notable positive impact on the growth of GH and ZH which showed the best performance in terms of plant height, root length and fresh weight when compared to the control (CK). Through transcriptome analysis, we discovered that these treatments altered the expression levels of genes associated with carbon metabolism, photosynthesis, and nitrogen pathways within 40 days. Interestingly, by altering the growth and tillering in rice transgenic plants, we validated the role of amino acid transporter OsAAP13 identified in transcriptome profiling, underscoring its significance. Our results are helpful for large-scale production of KSR with the key methods for controlling the growth of KSR. It is a valuable asset for future investigations aimed at unravelling the intricate mechanisms governing plant growth in the context of different nitrogen supplies.
1 INTRODUCTION
Rice serves as a main dietary component in Asia. It provides a substantial portion of daily caloric intake and is a crucial carbohydrate source (Mohidem et al., 2022). Rice cultivation and trade contribute significantly to the global economy and are considered a major cash crop for many countries, providing livelihoods for millions of farmers and labourers worldwide (Pandey et al., 2010). The rice demand has been increasing from quantity to quality and taste, with the continuous improvement of their living standards and changes in their dietary habits (Wang et al., 2020). Rice growth and cultivation vary across different regions of China due to differences in climate, soil, water availability, and local agricultural practices. These regional disparities have given rise to genetically diverse local rice cultivars, which have undergone extensive selection during domestication. These rice varieties boast a rich genetic diversity housing numerous advantageous genes that confer resistance to diseases and stress, as well as contribute to high yield and quality rice production (Rothenberg et al., 2012; Liu et al., 2022). Therefore, local rice has progressively gained significance as an essential material for breeders aiming to cultivate high yields and superior quality varieties. This is attributed to their distinctive diversity and adaptability, making them valuable resources in the breeding process (Shin et al., 2018).
Kam Sweet Rice (KSR) is the main food of the Dong people in Liping and Congjiang counties of Guizhou Province in China. Steamed KSR has excellent quality, including stickiness, softness, and gorgeous fragrance (Bao et al., 2012). However, due to the low yield and insufficient rural labour, there is an urgent need to understand the planting conditions of KSR to achieve factory planting. Therefore, KSR has been chosen to address specific challenges in cultivation, growth and nutrition to investigate the best formula for their growth.
Nitrogen (N) is a key macronutrient and has a strong influence on plant growth (Li et al., 2023). Modulating the N levels can lead to changes in morphological, physiological, and biochemical aspects (Wu et al., 2022; Amin et al., 2016). The application of N has significantly improved crop yield for food security (Zhang et al., 2015). Inorganic nitrogen, comprising nitrate and ammonium, is absorbed by plants and serves as a building block for amino acid synthesis. Nitrate is the main type of N that plants can take up and use, however, ammonium is considered the preferential form of N for most crops in paddy fields (Luo et al., 2023). Moreover, these amino acids undergo transport from sources to sinks by xylem and phloem in plants (Baqir et al., 2019). Previous studies suggested that nitrate and ammonium encourage chlorophyll synthesis and can increase chlorophyll content in seedlings (Shin et al., 2018; Sedmak et al., 1977), while amino acids can enhance chlorophyll content in plants during the vegetative stage (Taylor et al., 2015). The transport and utilization of amino acids depend on membrane proteins called amino acid transporters (AATs). AATs play a crucial role in the growth and development of plants (Zhao et al., 2012). Amino acid permeases (AAPs), which belong to the AAT family, have undergone extensive functional investigation in plants. For instance, in rice, OsAAP1 plays a pivotal role in promoting growth and increasing yield. It exhibits high expression in axillary buds, leaves, and panicles (Ji et al., 2020). OsAAP3 is responsible for basic amino acid transport, contributing to the distribution of essential nutrients, while their negative regulation boosts grain yield by promoting rice tillering (Lu et al., 2018). OsAAP4 transports neutral amino acids like Val and Pro, and it has been demonstrated that OsAAP4 over-expressing lines boost tillering and yield by controlling amino acid levels (Fang et al., 2021). Moreover, CRISPR of OsAAP5 significantly increases tillers by decreasing levels of basic amino acids Lys and Arg (Wang et al., 2019). OsAAP14 overexpression leads to increased tillers in rice subjected to melatonin concentrations (Yang et al., 2022). The response of OsAAP15 negatively influences panicle branching under high nitrogen conditions, affecting the levels of endogenous amino acids Tyr and Val in rice panicles (Yang et al., 2023).
In this study, we cultured five rice KSR cultivars to explore nutrient solution formulas and cultivation methods that are suitable for industrial rice cultivation on a large-scale production and intensive planting management. Moreover, morpho-physiological characteristics and RNA sequencing of KSR seedlings under different nitrogen supplies were analyzed to validate the suitable nutrient solution for KSR seedling growth. In addition, amino acid transporter OsAAP13 in transcriptome profiling was found to play a crucial role in KSR seedling growth. Overall, these findings enhance our understanding of the regulatory mechanisms and associated genes involved in KSR growth under different ammonium nitrate and amino acid treatments.
2 MATERIALS AND METHODS
2.1 Plant material and growth conditions
In this study, five KSR cultivars, including GouDan (GD), GouHa (GH), HongHe (HH), LeiLongGang (LG), and ZaiBianXiaoXiangHe (ZH) with similar plant height and tiller number during the heading stage, as well as similar growth period, were cultured in basic rice nutrient solution. The seeds were soaked in a Petri dish and placed in an incubator at 32°C for 72 h, with water changed every 12 h. Once sprouted, the seeds were transferred to trays for growth and development in the basic rice nutrient solution. The composition of basic nutrient solution contains 1.8 mM NH4Cl, 1.8 mM NaNO3, 0.32 mM NaH2PO4, 0.51 mM K2SO4, 1.0 mM CaCl2, 1.65 mM MgSO4, 8.9 μM MnSO4, 0.5 μM Na2MoO4, 18.4 μM H3BO3, 0.14 μM ZnSO4, 0.16 μM CuSO4, and 40.0 μM FeSO4. The nitrogen source of control (CK) was 1.8 mM NH4Cl and 1.8 mM NaNO3. The specific formulas for each treatment had been shown in Tables S1 and S2. The nutrient solution in rice was updated every three days, and the artificial climate chamber maintained a light cycle of 14/10 h day/night with a temperature of 32/25°C. At 40 days after germination, plant height, root length and fresh weight of the rice plants were measured. Afterwards, the leaves were taken and stored at −80°C for measurement of physiological properties and RNA sequencing at Beijing Nuohezhiyuan Technology Co. Ltd. The data of RNA-seq is available at the National Center for Biotechnology Information (NCBI): https://dataview.ncbi.nlm.nih.gov/object/PRJNA976077?reviewer=ke53q3da1jhh6peqee7tgk9po8
2.2 Identification of differentially expressed genes
Differential expression analysis of various rice cultivars was conducted utilizing the DESeq2 R package (version 1.16.1). Significantly differential expression was determined based on an adjusted P-value <0.05 and a fold change >2. Subsequently, only genes with FPKM values ≥1 in at least one sample were included in further analysis. The differential expression genes (DEGs) in rice leaf samples were identified under different N treatments among these rice cultivars. Heatmaps were generated with TB tools to visualize the expression patterns of genes involved in specific biological processes (Hiei et al., 1994).
2.3 Gene Ontology and KEGG enrichment analysis
Gene Ontology (GO) enrichment analysis of differentially expressed genes (DEGs) was conducted using the cluster Profiler R package, with correction for gene length bias. Significantly enriched GO terms were identified based on a corrected P-value <0.05. In addition, statistical enrichment analysis for DEGs in the Kyoto Encyclopedia of Genes and Genomes (KEGG) pathways was performed using the cluster Profiler R package.
2.4 RNA extraction and qRT-qPCR analysis
Total RNA of the rice samples was extracted with TRIzol (Vazyme). Then, first-strand cDNA was generated using 3 μg of total RNA and MLV reverse transcriptase (Vazyme). Quantitative real-time PCR (qRT-PCR) was conducted in a 20 μL reaction volume, comprising 10 μL 2 × SYBR Green Mix (Vazyme), 1 μL 10 μM primers, and 1 μL cDNA solution. The amplification conditions included an initial step at 94°C for 2 min (1 cycle), followed by 40 cycles of 94°C for 30 s, 55°C for 30 s, and 72°C for 30 s, and a final extension at 72°C for 1 min (1 cycle), using the CFX96 Touch qRT-PCR system (BioRad). Three technical replications were performed, and the relative gene expression was determined using the 2−ΔΔ Ct method (Amin et al., 2022). The primers used are given in the Table S3.
2.5 Chlorophyll pigments and free amino acids analysis
Chlorophyll pigments were extracted in subdued light conditions using the acetone reagent, following the procedure outlined in our prior publication (Amin et al., 2021). A 0.25 g of leaf sample was ground, and 5 mL of 80% acetone was added, followed by centrifugation at 10,000 g for 5 min. The supernatant was collected, and the pellet was discarded. Absorbance readings for total chlorophyll, chlorophyll a, and b were recorded at 663.6 and 646.6 nm, respectively. Additionally, total free amino acids were determined using HPLC 1260 Infinity II (Agilent) (Fang et al., 2021). The samples were prepared as follows: 1.0 g of rice tissue was placed in 80% ethanol (10.0 mL) and heated at 80°C in a water bath for 20 min, this step was repeated twice. The upper phase extracts were subjected to ethanol evaporation at 80°C in a drying oven. The sediment was dissolved using 1 mL of 0.5 M NaOH. The samples were centrifuged at 12000 g for 15 min, and the supernatant was filtered using a 2 μm filter membrane. Subsequently, 0.8 mL of each filtered solution was analyzed using HPLC 1260 Infinity II.
2.6 Soluble protein and soluble sugar analysis
For the determination of soluble protein, the Coomassie brilliant blue method was used (Sedmak et al., 1977). In brief, 0.5 g of fresh leaf tissue was homogenized and assorted with 10 mL of buffer solution (pH 7.0), followed by centrifugation at 15,000 g for 20 min. The supernatant was combined with SERVA Blue-G, and the absorbance was recorded. For the assessment of soluble sugar, fresh rice leaf was grinded with mortar and pestle using the method described by Atif et al. (2020). In brief, extracts were diluted with 80% methanol to a concentration of 10 mg mL−1. 1 mL of diluted extracts was mixed with 1.0 mL of 5% phenol, and 5.0 mL of H2SO4 was added. Then, the absorbance was detected for soluble sugar.
2.7 Vector construction and transgenic plant generation
For the construction of the OsAAP13 overexpression (OE) vector, 1401 bp cDNA sequence of OsAAP13 (LOC_Os4g39489) was incorporated in the pCAMBIA1306 vector through KpnI and XbaI restriction enzymes like previous method (Nadeem et al., 2023). The construction of the OsAAP13 CRISPR vector was accomplished using the CRISPR/Cas9-based multiplex genome editing system suitable for rice (Ma et al., 2015; Rehman et al., 2022). To design the OsAAP13 promoter-GUS vector, a 1981 bp fragment upstream of the start codon (ATG) of OsAAP13 was inserted into the pCAMBIA1391Z vector with HindIII and SmalI restriction enzymes. Subsequently, these vectors were transformed into ZH11 using Agrobacterium tumefaciens strain EHA105, and the seedlings were selected with 50 mg L−1 hygromycin.
2.8 GUS signal analysis
Three-week-old OsAAP13 promoter-GUS transgenic seedlings were planted in CK (basic rice nutrient solution as mentioned above), S3 (0.2 mM Gly + basic rice nutrient solution), D3 (1.2 mM NH4Cl + 2.4 mM NaNO3+ neutral amino acids + nitrogen-free rice basic nutrient solution), D6 (2.88 mM NH4Cl + 0.72 mM NaNO3 + 0.5 mM GABA + nitrogen-free rice basic nutrient solution) and M1 (1.8 mM NH4Cl + 1.8 mM NaNO3 + 0.5 mM GABA + neutral amino acids) treatments for 1 and 2 h, respectively. The neutral amino acids mentioned were composed of 0.1 mM Ser, 0.2 mM Thr, 0.2 mM Gly, 0.2 mM Pro, and 0.3 mM Ala. The GUS staining was performed using the histochemical staining method (Fang et al., 2021). The stained tissues were observed using a stereomicroscope (OLYMPUS SZX16).
2.9 Statistical analysis
The data were presented as mean ± SD, and statistically analyzed with GraphPad 8.0. *, ** and ***indicate significant differences by one-way ANOVA with t-test at P < 0.05, P < 0.01 and P < 0.001, respectively.
3 RESULTS
3.1 Effect of different N treatments on the growth of Kam Sweet Rice
To investigate the formulation of nutrient solutions to promote the growth of Kam Sweet Rice (KSR), different nitrogen treatments were set up for KSR seedling cultivation. We found that plant height and fresh weight of GH (GouHa) (Figure S1A-C), GD (GouDan) (Figure S1D-F), ZH (ZaiBianXiaoXiangHe) (Figure S1G-I), HH (HongHe) (Figure S1J-L) and LG (LeiLongGang) (Figure S1M-O) significantly increased under treatments t4 [basic rice nutrient solution + neutral amino acids (0.1 mM Ser + 0.2 mM Thr + 0.2 mM Gly + 0.2 mM Pro +0.3 mM Ala)] and t8 [basic rice nutrient solution +0.5 mM GABA] compared to those of control. In inorganic nitrogen treatments, GH (Figure S2A-C), GD (Figure S1D-F), LG (Figure S1M-O) grew faster than control under treatments T1 (2.4 mM NH4Cl + 1.2 mM NaNO3 + nitrogen-free rice basic nutrient solution), T4 (1.2 mM NH4Cl + 2.4 mM NaNO3 + nitrogen-free basic nutrient solution), T6 (3.6 mM NaNO3 + nitrogen-free basic nutrient solution), respectively, whereas ZH (Figure S2G-I) and HH (Figure S2J-L) grew more rapidly than control under treatment T2 (2.88 mM NH4Cl + 0.72 mM NaNO3 + nitrogen-free basic nutrient solution).
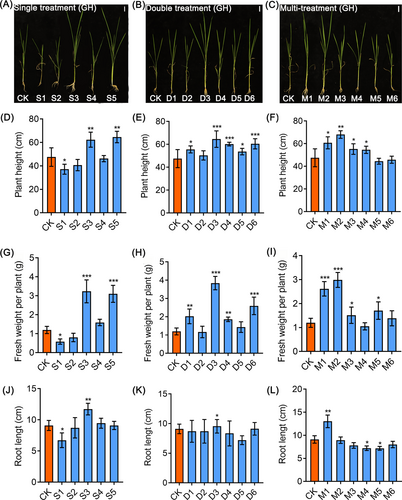
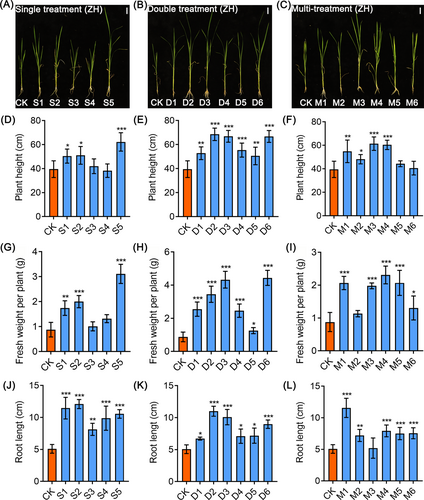
In order to further understand which amino acid in the organic nitrogen treatments mentioned above has a promoting effect on the growth of KSR, we conducted separate hydroponic experiments on each of these amino acids. Our results showed that GH (Figure 1A, D, G, J), HH (Figure S4A, D, G, J) and LG (Figure S5A, D, G, J) grew faster than control under S3 treatment (0.2 mM Gly + basic nutrient solution). Moreover, ZH (Figure 2A, D, G, J) and GD (Figure S3A, D, G, J) had significantly higher growth rates under S5 treatment (0.2 mM Pro + basic nutrient solution) in contrast to control. In order to obtain a formula with better growth effect of KSR, we conducted a new combination of experiment on different types of organic or inorganic nitrogen that have significant growth promoting effects. The result indicated that GH (Figure 1B, E, H, K) and ZH (Figure 2B, E, H, K) showed faster growth under D3 treatment [1.2 mM NH4Cl + 2.4 mM NaNO3 + neutral amino acids (0.1 mM Ser + 0.2 mM Thr + 0.2 mM Gly + 0.2 mM Pro +0.3 mM Ala) + nitrogen-free basic nutrient solution] than control. The GD (Figure S3B, E, H, K), HH (Figure S4B, E, H, K), and LG (Figure S5B, E, H, K) displayed significantly enhanced growth under D2 treatment (2.88 mM NH4Cl + 0.72 mM NaNO3 + neutral amino acids (0.1 mM Ser + 0.2 mM Thr + 0.2 mM Gly + 0.2 mM Pro +0.3 mM Ala) + nitrogen-free basic nutrient solution) in comparison to the control. Furthermore, in the multi-treatment group, GH (Figure 1C, F, I, L) under M2 treatment (2.4 mM NH4Cl + 1.2 mM NaNO3 + neutral amino acids (0.1 mM Ser + 0.2 mM Thr + 0.2 mM Gly + 0.2 mM Pro +0.3 mM Ala) and 0.5 mM GABA + nitrogen-free basic nutrient solution) showed improved growth than the control. Meanwhile, ZH (Figure 2C, F, I, L) showed rapid growth in terms of plant height and fresh weight under M4 treatment (2.88 mM NH4Cl + 0.72 mM NaNO3 + neutral amino acids (0.1 mM Ser + 0.2 mM Thr + 0.2 mM Gly + 0.2 mM Pro +0.3 mM Ala) + 0.1 mM GABA + nitrogen-free basic nutrient solution) compared to control. GD (Figure S3C, F, I, L) and LG (Figure S5C, F, I, L) have faster growth under M1 treatment (0.5 mM GABA + neutral amino acids (0.1 mM Ser + 0.2 mM Thr + 0.2 mM Gly + 0.2 mM Pro +0.3 mM Ala) + basic nutrient solution) while the plant height and fresh weight in HH (Figure S4C, F, I, L) accelerated under M3 treatment (2.88 mM NH4Cl + 0.72 mM NaNO3 + neutral amino acids (0.1 mM Ser + 0.2 mM Thr + 0.2 mM Gly + 0.2 mM Pro +0.3 mM Ala) + 0.5 mM GABA + nitrogen-free basic nutrient solution) as compared to control. These results suggest that modifying the ammonium nitrate composition or incorporating specific amino acid concentrations promotes faster growth in KSR compared to basic rice nutrient solutions. However, it's worth noting that different plant varieties may require slightly different optimal nutrient formulations.
3.2 Effect of different N treatments on chlorophyll pigment, soluble protein and soluble sugar of Kam Sweet Rice
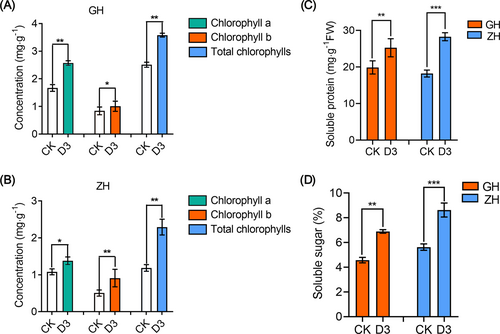
To investigate the changes in chlorophyll content, soluble sugar, and soluble protein of leaf blades of KSR under basic nutrient solution and optimal nutrient solution cultivation, the above physiological indicators were measured under different nitrogen treatments. We found that the concentration of chlorophyll a, chlorophyll b and total chlorophyll were significantly increased in GH (Figure 3A) and ZH (Figure 3B) under D3 (1.2 mM NH4Cl + 2.4 mM NaNO3 + neutral amino acids + nitrogen-free basic nutrient solution) treatment compared to control. The concentrations of soluble sugars and soluble proteins were also significantly higher in GH and ZH under D3 treatment than in the control (Figure 3C, D). Furthermore, chlorophyll a, chlorophyll b and total chlorophyll concentrations were significantly increased in GD under M1[1.8 mM NH4Cl + 1.8 mM NaNO3 + neutral amino acids (0.1 mM Ser + 0.2 mM Thr + 0.2 mM Gly + 0.2 mM Pro +0.3 mM Ala) + 0.5 mM GABA] treatment, HH under S3 (0.2 mM Gly + basic rice nutrient solution) treatment and LG under D6 (2.88 mM NH4Cl + 0.72 mM NaNO3 + 0.5 mM GABA) treatment as compared to control (Figure S6A-C). Lower content of soluble sugar and soluble protein were detected in GD under control than in M1 treatment [1.8 mM NH4Cl + 1.8 mM NaNO3 + neutral amino acids (0.1 mM Ser + 0.2 mM Thr + 0.2 mM Gly + 0.2 mM Pro +0.3 mM Ala) + 0.5 mM GABA] (Figure S7A, B). HH had higher concentrations of soluble sugars and soluble proteins in the S3 treatment (0.2 mM Gly + basic nutrient solution) than in the control (Figure S7A, B). The soluble sugar and soluble protein concentrations of LG under D6 treatment (2.88 mM NH4Cl + 0.72 mM NaNO3 +0.5 mM GABA) was significantly augmented than those of the control (Figure S7A, B). Overall, our results indicated that KSR grows faster in the optimal nutrient solution than in the basic nutrient solution of rice, and the concentrations of chlorophyll, soluble sugar, and soluble protein are also significantly higher in the optimal nutrient solution.
3.3 Effect of N treatments on endogenous amino acid of Kam Sweet Rice
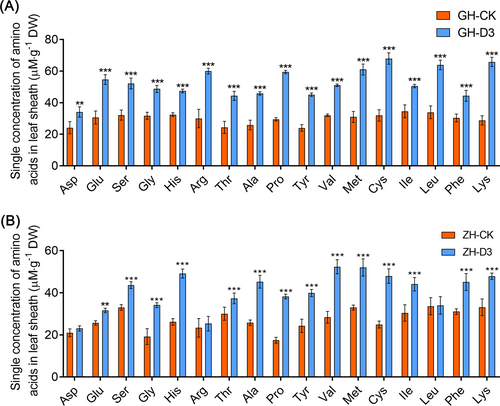
To further investigate whether optimal nutrient culture affects the accumulation of endogenous amino acids in KSR, the endogenous amino acid concentration in leaf blades of KSR was measured under basal and optimal nutrient culture. It indicated that the concentration of endogenous amino acid in the leaf blades of GH and ZH was altered under D3 treatment than under control. Interestingly, we found that individual amino acids Cys, Leu and Lys were significantly increased in GH under D3 treatment, whereas Val, Met and Cys in ZH surged significantly (Figure 4A-B). Moreover, the amino acid contents rapidly enhanced in GD under M1 treatment (1.8 mM NH4Cl + 1.8 mM NaNO3 + 0.5 mM GABA + neutral amino acids) than the control (Figure S8A). A higher concentration of amino acids was found in HH under S3 treatment (1.8 mM NH4Cl + 1.8 mM NaNO3 + 0.2 mM Gly) than in control (Figure S8B). In LG, the amino acid concentration was significantly higher under D6 treatment (2.88 mM NH4Cl + 0.72 mM NaNO3 +0.5 mM GABA) (Figure S8C). These findings suggest that cultivating KSR in an optimized nutrient solution leads to a substantial enhancement in the accumulation of endogenous amino acids compared to basic rice nutrient solution, which facilitates and promotes plant growth.
3.4 Expression profiles from KEGG analysis of Kam Sweet Rice
In order to delve into the regulatory mechanisms responsible for promoting KSR growth through the use of an optimal nutrient solution, leaf blades were collected for RNA-seq analysis from 40-day-old KSR seedlings that were cultivated in the optimal nutrient solution. 884 DEGs in GH and 906 DEGs in ZH were identified under D3 treatment compared to control. Moreover, 1534 DEGs in GD under M1 (1.8 mM NH4Cl + 1.8 mM NaNO3 + 0.5 mM GABA + neutral amino acids), 2130 DEGs in HH under S3 (1.8 mM NH4Cl + 1.8 mM NaNO3 + 0.2 mM Gly), and 3162 DEGs in LG under D6 (2.88 mM NH4Cl + 0.72 mM NaNO3 + 0.5 mM GABA) treatments were detected in contrast with control (Figure 5A).
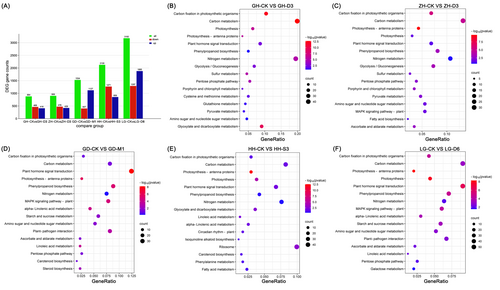
To investigate the processes associated with KSR growth under optimal nutrient solution, KEGG enrichment analysis was performed. The genes with optimal nutrient solution in the KSR were primarily involved in carbon fixation in photosynthetic organisms and carbon metabolism, photosynthesis, photosynthesis antennae, nitrogen metabolism and plant hormone signal transduction (Figure 5B-F). KEGG enrichment analysis showed that most of the genes were enriched in the carbon metabolism pathway in GH and ZH under D3 treatment (Figure 5B, C). DEGs in GD were mainly enriched in plant hormone signal transduction under M1 treatment (1.8 mM NH4Cl + 1.8 mM NaNO3 + 0.5 mM GABA + neutral amino acids) (Figure 5D). DEGs in HH and LG were enriched in photosynthesis antennae protein under S3 (1.8 mM NH4Cl + 1.8 mM NaNO3 + 0.2 mM Gly) and D6 (2.88 mM NH4Cl + 0.72 mM NaNO3 +0.5 mM GABA) treatment, respectively (Figure 5E, F).
We also perform KEGGs analysis among KSR cultivars in the control. It revealed that the phenylpropanoid biosynthesis pathway was highly enriched in GH compared to GD, ZH, HH and LG (GH-CK vs. GD-CK, GH-CK vs. ZH-CK, GH-CK vs. HH-CK, and GH-CK vs LG-CK) respectively (Figure S9). Moreover, it showed that phenylpropanoid biosynthesis, plant hormone signal transduction, and photosynthesis pathways were mainly enriched in ZH compared with other KSR cultivars (Figure S10). DEGs were mainly enriched in phenylpropanoid biosynthesis plant hormone signal transduction, photosynthesis, and glutathione metabolism pathway among GH, ZH, GD, HH and LG cultured in normal nutrient solution (Figures S11-S13). Additionally, the DEGs were mainly enriched in phenylpropanoid biosynthesis, plant pathogen interaction, and carbon metabolism pathways of KSR cultivars exposed to an optimal nutrient solution (Figures S14-S18). These results indicate that carbon metabolism, photosynthesis, nitrogen metabolism, and phytohormone signalling pathways play important roles in response to optimal nutrient solution culture to promote the growth of KSR.
3.5 Expression profiles from GO analysis of Kam Sweet Rice
To investigate the processes associated with the growth of KSR in optimal nutrient solution, GO enrichment analysis was performed. DEGs of GH and ZH under D3 treatment compared with control were mainly involved in carbohydrate metabolic processes and thylakoid (Figure S19A, B). Furthermore, DEGs of GD under the control and M1 treatment were mainly concentrated in response to stress, extracellular region or transcriptional regulatory activity (Figure S20A). DEGs of HH exposed to S3 treatment were mainly involved in cellular carbohydrate metabolism and amide biosynthesis (Figure S20B). Moreover, DEGs of LG under D6 treatment and the control were mainly concentrated in carbohydrate metabolism and the thylakoid process (Figure S20C). Furthermore, DEGs among GH, ZH, GD, HH, and LG cultured in a normal nutrient solution were mainly enriched in response to stimulus, cell wall, and heme binding pathway (Figures S21-S25). DEGs of KSR were mainly enriched in carbohydrate metabolic process and photosystem pathways exposed to an optimal nutrient solution (Figures S26-S30). These results indicated that the optimal nutrient solution for cultivating KSR affects the carbohydrate metabolism and thylakoid process.
3.6 Expression profiles of enriched genes from KEGG analysis of Kam Sweet Rice
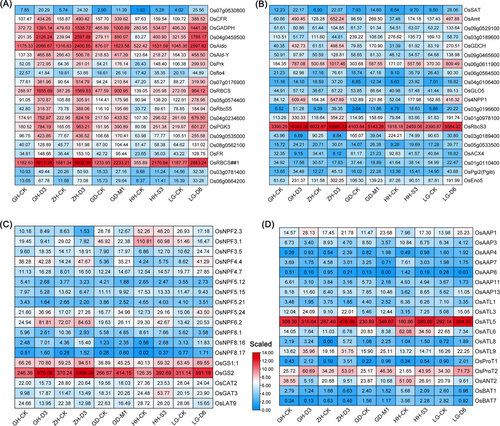
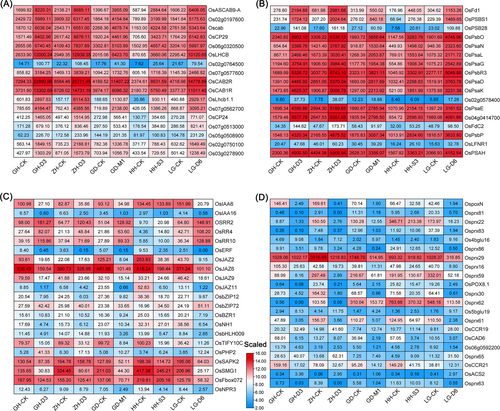
Based on the enriched processes associated with carbon metabolism, photosynthesis, nitrogen metabolism, phytohormone signalling and phenylpropanoid biosynthesis pathways of KSR, we inferred that these processes predominantly determined the growth of KSR. Therefore, we analyzed the expression profiles of genes involved in these pathways using a heatmap (Figures 6, 7). Tillering related FR and Rubisco small subunit coding genes OsRBCS, OsRBCS1 and OsRBCS5 were highly expressed upon treatment with optimal nutrient solution, indicating that gluconeogenesis and photorespiration were activated by an optimal nutrient solution to promote KSR growth (Figure 6A-B). Besides, the expression of glutamine synthetase genes (OsGS1;1 and OsGS2), nitrate transporter genes (OsNPF3.5 and OsNPF4.4) and amino acid transporter genes (OsAAP1, OsAAP4, OsAAP13 and OsATL5) was higher in KSR leaf blades upon treatment with optimal nutrient solution compared to treatment with control, indicating that nitrogen assimilation and amino acid transporter were activated by optimal nutrient solution to promote KSR growth (Figure 6C, D). In the photosynthesis pathway, the expression of OsCP29, OsLHCB, OsCAB1R, OsCAB2R, OsPsbR3, OsPsaD, OsPsbP and OsPsbO was higher in KSR leaf blades upon treatment with optimal nutrient solution compared to control treatment (Figure 7A, B). However, in the plant hormone signalling pathway, the expression of small grain gene OsSMG1, auxin-responsive gene OsIAA1 and OsIAA6, and JAZ-interacting transcription factor OsbHLH009 in KSR leaves were significantly lower in the optimal nutrient solution than in control (Figure 7C). Similarly, compared to the control, the expression of genes related to phenylpropanoid biosynthesis, such as OspoxN6, OspoxN, Osprx29, Osprx30 and Osprx61 were significantly decreased when KSR cultured with optimal nutrient solution (Figure 7D). Additionally, we also found that the differentially expressed genes of KSR cultured in normal nutrient solution were mainly enriched in the pathways of phenylpropane biosynthesis (Figure S31A, B1) and linoleic acid metabolism (Figure S31B2) pathways, however, the differentially expressed genes of KSR were mainly enriched in phenylpropanoid biosynthesis and the phytohormone transduction pathway under optimal nutrient solution (Figure S32A-D).
3.7 Nitrogen responsive OsAAP13 from transcriptome positively regulates growth and tillering in rice
Since the expression of OsAAP13, which is involved in the nitrogen metabolism pathway, was affected by different nitrogen treatments (Figure 6D), OsAAP13 promoter-GUS transgenic lines were performed for experiments. OsAAP13 promoter-GUS transgenic lines were treated with D3, D6, M1 and S3 to determine the expression of OsAAP13 (Figure S33). The results showed that the expression of OsAAP13 dramatically increased in roots from 1 to 2 h by D6, M1 and S3 treatments, while it increased rapidly and then decreased slightly with D3 treatment (Figure S33A, C), whereas the expression increased continuously in leaf blades from 1–2 h by different nitrogen treatments (Figure S33B, D). The results of GUS staining also showed the same trend with RT-qPCR (Figure S33E). To further determine the role of OsAAP13 in regulating rice growth, we generated OsAAP13 OE and CRISPR lines in the japonica ZH11 background (Figure 8). We found that OsAAP13 OE lines enhanced grain yield by increasing tillers and grains per plant, while the OsAAP13 CRISPR line showed the opposite result (Figure 8A-D). Our results suggested that nitrogen responsive OsAAP13 from transcriptome positively regulates growth and tillering in rice.

4 DISCUSSION
KSR is a special glutinous rice with excellent nutritional quality (Liu et al., 2022), however, we found that KSR grew slowly in normal basic rice nutrient solution, which is not conducive to the intensive production of KSR in rice seedling culture. A nutrient cultivation method that is suitable for large-scale production of KSR is an urgent problem that needs to be solved. For rice, N nutrient is essential for growth, especially for biomass, tillering, and yield (Gao et al., 2019; Huang et al., 2018). Nitrate is a critical N source of rice, and as much as 40% of the total N taken up by rice is absorbed as nitrate (Xu et al., 2012), but rice plants with nitrate as the sole N resource displayed slower growth (Kirk et al., 2005). In this study, we found that the growth of KSR in the D4 treatment with the addition of only nitrate as an inorganic nitrogen source was significantly lower than in the treatment with a mixture of nitrate and ammonium as an inorganic nitrogen source (Figures 1, 2; S3-S5). Moreover, it is widely known that rice prefers ammonium for growth, but high ammonium concentration becomes toxic to the rice, then inhibits growth (Gazzarrini et al., 1999; Straub et al., 2017; Zhang et al., 2016). Our study demonstrated the same results, with KSR having lower plant height and fresh weight than control in a nutrient solution to which only ammonium was added as a source of inorganic nitrogen (Figure S2). Importantly, previous studies have shown that a combined supply of nitrate and ammonium boosts plant growth beyond that observed with the N source provided alone (George et al., 2008; Poothong et al., 2016). Recent reports indicate that NO3− can mitigate NH4+ toxicity by accelerating ammonium assimilation, even at a very low concentration (0.1 mM) (Li et al., 2023; Yan et al., 2023). Similarly, we found that the growth rate of KSR was accelerated when the concentration ratio of ammonium and nitrate was 2: 1 or 1: 2 (Figures 1, 2; S3-S5). Importantly, we also found that among several treatments in which nitrate and ammonium were added proportionally as inorganic nitrogen sources, the most significant effect on promoting KSR growth was when the ratio of nitrate to ammonium was 2: 1 (Figures 1, 2; S3-S5).
Besides, plants also absorb organic nitrogen sources such as amino acids (Miller et al., 2005; Kojima et al., 2007). Previous reports have pointed out that low concentrations of amino acids promote the growth of rice, especially adding low doses of Gly and Pro, which can significantly increase the biomass of rice (Lu et al., 2018; Ji et al., 2020). In this study, we showed that adding 0.2 mM Pro to the basic nutrient solution of rice significantly increased the growth rate of KSR (Figures 1, 2; S3-S5). Interestingly, the growth of HH in rice nutrient solution supplemented with 0.2 mM Gly was faster than that supplemented with 0.2 mM Pro (Figures 1, 2; S3-S5). Moreover, there have been reports indicating that exogenous application of a certain concentration of GABA can significantly increase the growth of rice (Ma et al., 2016). It was confirmed that KSR grew more rapidly in the basic nutrient solution when supplemented with 0.5 mM GABA than in the control (Figures 1, 2; S3-5). Previous studies have reported that amino acids act as biological stimulants to promote the synthesis of chlorophyll pigments, soluble proteins, soluble sugars, and free amino acids in plants, thereby promoting plant growth (Hussein et al., 2022; Abdelkader et al., 2023). Therefore, changing the nitrogen source in the basic rice nutrient solution can obtain the optimal formula for the nutrient solution for the cultivation of KSR.
Furthermore, we found that the expression of the rice fructose-1,6-bisphosphate aldolase gene OsAld-Y, the cytosolic fructose-1,6-bisphosphatase OsFR, the glycine decarboxylase complex H-protein OsGDCH in the carbon metabolism pathway in the leaf blades of KSR was up-regulated in optimal nutrient solution compared to the control (Figure 6A-B). Previous studies have demonstrated that OsAld-Y plays a positive role in mediating chlorophyll accumulation and promoting plant growth by regulating the sugar metabolism in rice (Zhang et al., 2016). Knockout of OsFR significantly reduced tillers and growth rate in rice (Koumoto et al., 2013). Likewise, OsGDCH knockdown lines exhibited fewer tillers and lower height, accumulated lower fresh and dry biomass compared with the wild-type, and leaves of these lines also had significantly less total soluble protein and chlorophyll (Lin et al., 2016). In this study, we also found that the concentrations of chlorophyll, soluble sugars, and soluble proteins in KSR in the optimal nutrient solution were significantly higher than those in the control solution (Figures 3; S6-7). Moreover, we found that the expression of rice photosynthetic ferredoxin gene OsFd1, ferredoxin-like protein gene OsFdC2, leaf-type ferredoxin-NADP+ oxidoreductase gene OsLFNR1 in the photosynthesis pathway of KSR was up-regulated in optimal nutrient solution compared with control (Figure 7A-B). Previously, osfd1 and osfdc2 plants were shown to exhibit a decrease in photosynthetic capacity, chlorophyll, and carotenoid content (Li et al., 2015; Yang et al., 2016; He et al., 2020). Therefore, it suggests that genes involved in carbon metabolism and the photosynthesis pathway participates in the growth of KSR regulated by the external nitrogen treatments.
In particular, we found that the expression of the amino acid transporter OsAAP13 involved in the nitrogen pathway was controlled by different nitrogen treatments, and the expression of the genes was up-regulated in optimal nutrient solution than in rice basic nutrient solution (Figure 6C-D). Moreover, the GUS staining experiment showed that the expression of OsAAP13 was affected by different nitrogen treatments (Figure S33). Similarly, it was shown that OsAAP5 expression is up-regulated by nitrate and ammonium concentrations (Wang et al., 2019). Additionally, it has been reported that OsAAP14 expression levels are regulated by exogenous basic amino acids (Yang et al., 2022). The expression of OsAAP15 is significantly up-regulated under 0.5–15 mM N treatment (Yang et al., 2023). Therefore, the expression of some genes involved in the nitrogen pathway is affected by exogenous nitrogen treatment. Furthermore, our results revealed that overexpression of OsAAP13 resulted in improved grain production by improving tillering compared to WT (Figure 8). This indicates that OsAAP13 is a key gene in the nitrogen metabolism pathway that responds to exogenous nitrogen and positively regulates rice growth.
In addition, the expression of glutamine synthase genes OsGS1;1 and OsGS2, amino acid transporter OsAAP1 in the nitrogen pathway of KSR increased under the optimal nutrient solution compared to the control, whereas the expression of nitrate transporter gene OsNPF3.1 decreased (Figure 6C-D). Moreover, we also found that the concentrations of endogenous amino acids in KSR in the optimal nutrient solution were significantly higher than those in the control (Figures 4; S8). Previously, it has been reported that the mutant of OsGS1;1 showed severe reduction in growth rate (Tabuchi et al., 2005), and suppressed expression of OsGS2 exhibited decreased plant height, dry weight, and few tillers (Cai et al., 2010; Wang et al., 2020). Similarly, Reduced expression of OsAAP1 impairs plant growth and tillering in rice by affecting the neutral amino acid transport Pro and Tyr (Ji et al., 2020), whereas knockout of OsNPF3.1 increases tiller number and filled grain number in rice (Hang et al., 2023). Therefore, it suggests that genes involved in the nitrogen pathway participate in the growth of KSR regulated by external nitrogen treatments. Overall, this study provides insights into the nutrient solution formula suitable for KSR growth, providing a certain foundation for the intensive production of KSR.
5 CONCLUSION
This study showed that nitrogen D3 treatment [1.2 mM NH4Cl + 2.4 mM NaNO3+ neutral amino acids (0.1 mM Ser + 0.2 mM Thr + 0.2 mM Gly + 0.2 mM Pro +0.3 mM Ala)] has a notable positive impact on the growth of KSR seedlings GH and ZH. Transcriptome analysis indicated that the growth of KSR seedlings under this treatment are primarily governed by the regulation of genes involved in carbon metabolism, photosynthesis, nitrogen pathway related to sugar, chlorophyll and protein. Moreover, overexpression of nitrogen responsive amino acid transporter OsAAP13 in our transcriptome boosts growth and tillering compared with wild-type, while the OsAAP13 mutant lines shows the opposite effect. Our results provide the key method for controlling the growth of KSR and could be helpful for the large-scale production of KSR.
AUTHOR CONTRIBUTIONS
ZF conceived and designed the project, and WH performed the transgenic experiments. BA and JL collected physiological data, performed the analysis of transcriptomes and wrote the manuscript. JS collected the RNA-seq samples. ZF revised the manuscript. All authors have read and approved the final version of this manuscript.
ACKNOWLEDGEMENTS
Not applicable.
FUNDING INFORMATION
This research was supported by the National Natural Science Foundation of China (32260498/32060064), the Guizhou Provincial Science and Technology Projects (qiankehejichu-ZK (2022) Key 008; Qiankehepingtairencai-YQK (2023)002; qiankehejichu-ZK (2021) General 128), the Guizhou Provincial Science and Technology Support Plan (qiankehezhicheng (2022) Key 026), the Qiandongnan Science and Technology Support Project (Qiandongnan Kehe Support (2023) 06), and the Talent Project from Thousands of Innovative and Entrepreneurial in Guizhou Province (GZQ202007085).
CONFLICT OF INTEREST STATEMENT
The authors declare that they have no competing interests.
Open Research
DATA AVAILABILITY STATEMENT
The raw data collected from RNA-seq was availability in national center for biotechnology information (NCBI): https://dataview.ncbi.nlm.nih.gov/object/PRJNA976077?reviewer=ke53q3da1jhh6peqee7tgk9po8
The datasets used and/or analysed during the current study are available from the corresponding author on reasonable request.


