Comprehensive analysis of the 2R-MYB family in Nicotiana tabacum and functional characterization of NtMYB35 in pigment metabolism
Abstract
MYB transcription factors (TFs) play important roles in plant growth and development, metabolic regulation, and stress responses. In the current study, 258 2R-MYB TFs were identified in Nicotiana tabacum and systemically analyzed. The 2R-NtMYB TFs were unevenly distributed on 23 chromosomes and were classified into 33 subgroups according to the Arabidopsis thaliana 2R-MYB classification. The promoters of the 2R-NtMYB harbor numerous potential cis-acting elements involved in plant growth, metabolism, hormone signaling, and stress responsiveness. Chip-based expression profiling of different tissues and growth stages revealed that the 2R-NtMYBs showed constitutive or spatiotemporally specific expressions. RNA-sequencing data indicated that some 2R-NtMYBs, including NtMYB16, NtMYB27, NtMYB35, and NtMYB170, are involved in the response to one or several abiotic and biotic stresses, namely drought and resistance to black shank and bacterial wilt. Quantitative PCR results further revealed that NtMYBs respond to different hormones (abscisic acid, indole acetic acid, gibberellic acid, methyl jasmonate, and salicylic acid) and confirmed their involvement in abiotic stress responses like heat, drought, and salt. NtMYB35 overexpression and mutant lines generated using CRISPR-Cas9 gene editing were used to verify the important role of NtMYB35 in regulating tobacco growth, pigment metabolism, and aphid resistance. These results provide a detailed overview of this TF family in N. tabacum and valuable insights for future functional analyses of NtMYB TFs.
1 INTRODUCTION
MYB transcription factors (TFs) form the largest plant TF family and are distinguished by the highly conserved MYB DNA-binding domain in their N-terminus (Li et al., 2004). Each repeat of the MYB domain is approximately 52 amino acids long. The MYB domain contains three tryptophan residues regularly arranged at the hydrophobic center of the protein, forming a helix-turn-helix (HTH) structure capable of binding DNA. Their C-terminus contains a transcriptional activation region rich in acidic amino acids that determines the transcriptional activity of MYB TFs and participates in the interaction with other TFs or DNA (Stracke et al., 2001).
According to the number of MYB domain repeats, MYB TFs are divided into 1R-MYB (R1/R2, R3-MYB), 2R-MYB (R2R3-MYB), 3R-MYB (R1R2R3-MYB), and atypical MYB TFs containing four or five MYB domains (Katiyar et al., 2012). 2R-MYB TFs are the most abundant in plants, followed by 1R, 3R, and atypical MYB TFs. MYB TF families are present in all eukaryotes. ZmMYBC1 in Zea mays L. was the first successfully cloned MYB TF, and is involved in pigment synthesis (Paz-Ares et al., 1987). The development of high-throughput sequencing technologies had greatly promoted the identification of MYB TFs. For example, 126 2R-MYB TFs have been identified in Arabidopsis thaliana (Chen et al., 2006; Liu et al., 2015), 111 2R-MYB TFs in potato (Solanum tuberosum L.; Li et al., 2020), 393 2R-MYB TFs in Wheat (Triticum aestivum L.; Wei et al., 2020), 167 2R-MYB TFs in flax (Linum usitatissimum L.; Tombuloğlu, 2020), and 174 2R-MYB TFs in tobacco (Nicotiana tabacum L. ‘K326’).
MYB TFs participate in many biological processes, including plant growth and the development of organs and tissues, including the wax layer (Zhang et al., 2021) and axillary meristem (Jia et al., 2020), as well as in the regulation of the plant flowering time and fruit ripening (Fan et al., 2018; Yang et al., 2021). They also regulate the biosynthesis of plant secondary metabolites, such as anthocyanins, capsaicin, chlorogenic acid, artemisinin, carotenoids, and other substances (Sun et al., 2019; Wu et al., 2020; Katja et al., 2021; Shi et al., 2021; Tang et al., 2021). In addition, MYB TFs are involved in plant responses to multiple biotic and abiotic stresses. In apples, MdMYB73 is involved in the resistance to the fungal pathogen Botryosphaeria dothidea by regulating the salicylic acid (SA) pathway (Gu et al., 2020). In Arabidopsis thaliana, AtMYB4 regulates cadmium tolerance via the antioxidant defense system (Agarwal et al., 2020). In Lilium longiflorum, LlMYB305 functions in thermotolerance via the activation of heat-protective genes (Wu et al., 2021). Tobacco is an important economic crop and model plant. It is of great importance to identify and analyze the 2R-MYB TF subfamilies in this species. Although Yang et al. (2022) have identified 174 2R-MYB members from the genome of N. tabacum L.var.K326, our data retrieved from N. tabacum L. ‘Honghudajinyuan’ seemed to be different from those of Yang et al. (2022). In order to comprehensively understand this TF family from different varieties, this study identified and characterized 2R-MYB TFs from the genome of N. tabacum L. ‘Honghudajinyuan’ in the China Tobacco Genome Database. Through global bioinformatics analysis of the 2R-MYB TF family combined with expression analysis in different tissues and in response to hormones and biotic and abiotic stresses, we explored their potential functions. Overexpression (OE) and knockout vectors were constructed to characterize the function of NtMYB35 in the regulation of tobacco pigment metabolism. We expected our study to provide insights into the functional properties of 2R-MYB TFs in N. tabacum and to contribute to the understanding of the molecular mechanisms by which 2R-MYB TFs regulate the biosynthesis of plant secondary metabolites and plant growth.
2 MATERIALS AND METHODS
2.1 Identification of NtMYB TFs
The coding and promoter sequences of MYB TFs of N. tabacum L. ‘Honghuadajinyuan’ were retrieved from the China Tobacco Genome Database (http://10.6.0.76/; restricted) based on the hidden Markov model profiling of the MYB conserved domain (PF00249) in the PFAM database (http://pfam.xfam.org/search#tabview=tab1) to identify all 2R-MYB TFs in the N. tabacum genome. Conserved domains in the 2R-MYB proteins were analyzed and confirmed using the NCBI Conserved Domain Database (CDD; https://www.ncbi.nlm.nih.gov/cdd). The Visualize NCBI CDD Pattern plugin in TBtools was used to exclude sequences containing incomplete MYB domains (Chen et al., 2020). Additionally, 126 A. thaliana 2R-MYB protein sequences were downloaded from The Arabidopsis Information Resource (TAIR, www.arabidopsis.org).
2.2 Phylogenetic, gene structure and motif analysis of NtMYB TFs
An unrooted phylogenetic tree was constructed with the neighbor-joining method using the Jones–Taylor–Thornton matrix model with 1000 bootstrap replicates and validated using the maximum likelihood method in MEGA7.0. The phylogenetic tree was visualized using the EvolView software (https://www.evolgenius.info/evolview/#login; Subramanian et al., 2019).
Conserved motifs in the 2R-NtMYB TFs were identified by the MEME software (http://meme-suite.org/tools/meme) setting the maximum number of motifs to 15 (default). The intron/exon structure was illustrated using the online Gene Structure Display Server (http://gsds.cbi.pku.edu.cn/index.php). The gene structure and motif distribution of the 2R-NtMYB TFs were visualized using the Gene Structure View (Advanced) plugin TBtools.
2.3 Chromosome localization and gene duplication analysis
All 2R-NtMYB TFs identified were mapped to the chromosomes using MapChart v2.2 (http://mg2c.iask.in/mg2c_v2.0/). The collinearity relationships of NtMYB homologs were identified using the Circos tool and visualized using TBtools.
2.4 3-Dimensional (3D) structure prediction and analysis of promoter cis-acting elements
3D protein structures of the 2R-NtMYB TFs were predicted using the online SWISS-MODEL (https://swissmodel.expasy.org/) program and visualized using the PyMoL (https://pymol.org/2/) software. The 2000-bp upstream sequences of the 2R-NtMYB TFs were submitted to the PlantCARE database (http://bioinformatics.psb.ugent.be/webtools/plantcare/html/) to analyze the cis-elements in the promoters.
2.5 Gene expression profiling of 2R-NtMYBs in different tissues and organs and in response to abiotic and biotic stresses
Chip-based expression profiling data of 2R-NtMYBs in different tissues and organs and growth stages (seed germination, seedling stage, fast-growing period, budding period, full flower stage, and one day after topping) of N. tabacum L. ‘Honghuadajinyuan’ plants were retrieved from the Chinese Tobacco Genome Database. Raw RNA-sequencing (RNA-seq) data of N. tabacum ‘Honghuadajinyuan’ plants after drought treatment and infection with Phytophthora parasitica var. nicotianae and Ralstonia solanacearum were downloaded from the NCBI SRA database (https://www.ncbi.nlm.nih.gov/sra/ PRJNA576540, PRJNA320659, PRJNA451198). Data processing was conducted as previously reported (Yang et al., 2022). Gene expression levels were calculated using the Transcripts Per Million (TPM) method. Heatmaps showing the expression patterns were generated using the HeatMap plugin in TBtools.
2.6 Plant materials and treatments
Seeds of N. tabacum L. ‘Honghuadajinyuan’ were seeded in a floating seedling tray and cultured in an artificial climate chamber at 28°C under a 16 h light/8 h dark cycle. Before germination, the seeds were sterilized first with 10% ethanol solution for 30 s, followed by 10% sodium hypochlorite for about 10 min. Then, they were washed with sterile distilled water six times. After one month, when four true leaves appeared, approximately 300 tobacco seedlings were subjected to hormone and stress treatments. For hormone treatments, seedlings were sprayed with 2 mmol l−1 SA or 100 μmol l−1 indole acetic acid (IAA), methyl jasmonate (MeJA), or abscisic acid (ABA) for 48 h. For drought and salt treatments, seedlings were treated with 200 mM polyethylene glycol (PEG) and 150 mmol l−1 NaCl solution for 48 h, respectively. For high-temperature stress treatments, seedlings were incubated in illuminated incubators at 37°C for 48 h. Tissue samples from the second leaf from the top were collected at 0, 1, 3, 6, 9, 12, 24, and 48 h after the treatments. The samples were snap frozen in liquid nitrogen and immediately stored at −80°C. Samples were collected in three biological and three technical replicates.
2.7 Quantitative reverse transcription (q-RT) PCR
Total RNA from the samples was isolated using a Plant Total RNA Isolation Kit (Foregene) and reverse transcribed into cDNA using a HiScript II Reverse Transcriptase Kit (Vazyme). Primers for q-RT PCR were designed using Primer 5.0 (Table S1). The q-RT PCR reaction mixtures contained 1 μl of cDNA template, 0.5 μl of primers, 5 μl of SYBR qPCR Master Mix (Vazyme), and 3 μl of double distilled water (ddH2O). PCRs were run on a real-time fluorescence quantitative PCR instrument (plex2 cycler; Eppendorf), per the manufacturer's instructions. The 2−ΔΔCT algorithm was used to calculate relative gene expression with the L25 gene as an internal reference gene for normalization.
2.8 Generation and identification of NtMYB35 OE and knockout transgenic plants
An NtMYB35 OE vector was constructed based on the in-fusion method using an In-Fusion® HD Cloning Kit (Kanto) per the manufacturer's instruction. The primers used are listed in Table S1. Positive colonies were transferred into Agrobacterium GV3101 competent cells, which were transformed into tobacco plants using the leaf disc method. Selection was performed using differentiation medium containing 100 mg l−1 kanamycin. Resistant buds were transferred to rooting medium and cultivated for one month. Transgenic plants were confirmed by PCR using primers covering parts of NtMYB35 and the vector. NtMYB35 expression levels were determined by q-RT PCR. T3 homozygous seeds (OE9 and OE10) were used in subsequent experiments.
ntmyb35-knockout mutants were generated using the CRISPR/Cas9 gene editing system. Three targeting sequences were used to construct the gene editing vector using CRISPR Primer Designer (http://www.multicrispr.net/index.html) for CAS9 target site design. The methods for transformation and generation were the same as those used for the OE transgenic plants. Mutants were confirmed by PCR and sequencing until homozygous mutants were obtained. Homozygous mutant lines (ntmyb35-32 and ntmyb35-39) were used in subsequent experiments.
2.9 Measurements of morphology, photosynthetic parameters, and pigment content
Seeds of the OE lines (OE9 and OE10, T3 generation), knockout lines (ntmyb35-32 and ntmyb35-39, homozygous), and wild-type (N. tabacum K326) plants were germinated and cultured on floating seedling plates in a climate chamber for two months, after which the seedlings were transplanted to the field. Seventy days after transplantation, morphological and photosynthetic parameters, and pigment contents were measured. The stem circumference was measured near the middle of the plant, and leaf length and leaf width were averaged from the three middle leaves.
Photosynthetic parameters, including the net photosynthetic rate (Pn), transpiration rate (Tr), intercellular CO2 concentration (Ci), and stomatal conductance (Gs), of the sixth leaf from the top were measured using an LI-6400XT portable photosynthetic measuring system (LI-COR) between 9:30 am and 11:30 am on a sunny day. The photosynthetic indices were recorded with six replicates per line, and each replicate was measured three times. Chlorophyll SPAD values were measured using a SPAD-502 chlorophyll analyzer (Konica) on the same leaves, also with six replicates per line, and each replicate was measured three times.
Fresh tobacco leaves near the middle of the seedlings were collected with three biological replicates per line, rapidly frozen in liquid nitrogen, and stored at −80 °C. The types and contents of leaf carotenoids were detected by liquid chromatography–tandem mass spectrometry at Metware Biotechnology Co. Ltd. (Wuhan).
2.10 Aphid resistance analysis of transgenic lines
Tobacco seedlings were cultivated in floating seedling plates. When the third true leaves appeared, three tobacco plants with similar growth from each line were transplanted into flower pots. After two weeks of cultivation, the tobacco plants were inoculated with 21 aphids per line and cultured in a 100-mesh insect breeding cage for 14 days. Then, the aphids on each tobacco seedling were counted.
2.11 Statistical analysis
SPSS 23.0 (IBM) was used for the data statistical significance analysis in this study, and an one-way ANOVA followed by Student's t-test was used to evaluate the significance of differences at p < 0.05. All data were presented with standard deviation (SD) from at least three biological replicates.
3 RESULTS
3.1 Identification and phylogenetic analysis of 2R-NtMYBs in tobacco
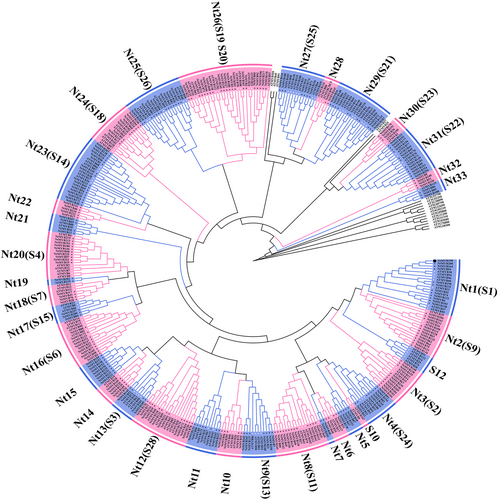
Using the MYB conserved domain (PF00249) as a query, a BLAST search against the China Tobacco Genome Database ((http://10.6.0.76/; restricted) was performed. After removing 43 1R-MYBs and 3R-MYBs, a total of 258 2R-MYB sequences (sequences provided in Supplementary Material as Sup S1) were retrieved and named NtMYB1 to NtMYB258 according to the gene number. Detailed information on the 258 2R-MYBs, including chromosome localization, gene length, and coding sequence length, are provided in Table S2. Gene length ranged from 483 bp (NtMYB246) to 23 239 bp (NtMYB234), and coding sequence length varied from 291 (NtMYB145) to 3,186 (NtMYB165). According to the classification method for Arabidopsis thaliana 2R-MYB TFs (22 subgroups and some single AtMYBs not belonging to any subgroup), the tobacco 2R-MYB TFs were divided into 33 subgroups (Nt1–Nt33), with subgroups Nt5, Nt7, Nt15, Nt22, and Nt32 containing only tobacco 2R-MYB TFs (Figure 1).
3.2 Analysis of the gene structure and conserved motifs of 2R-NtMYBs
To better understand the structural components of the tobacco 2R-MYB TFs, the gene exon and intron distribution and potential conserved protein motifs were analyzed. Most members of the same subgroup exhibited the same intron-exon structural design (Figure 2A). Among all 258 NtMYB TFs, 12 TFs were intron-less, with only one exon, and these were mainly concentrated in the Nt31 subgroup except for NtMYB246 which was in subgroup Nt24. Thirty-three members contained 4–10 exons, and these were mainly distributed in the Nt28 and Nt32 subgroups, followed by the Nt18, Nt22 and Nt37 subgroups. The remaining 213 members harbored 1–3 exons.
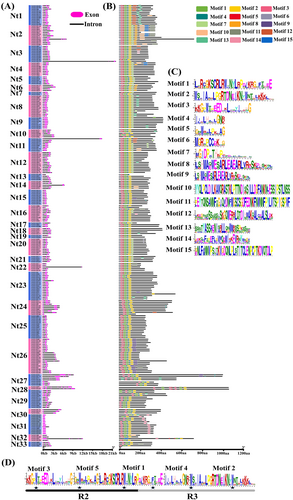
Most members in the same subgroup contained similar conserved motifs. In total, 15 conserved motifs were identified. The NtMYB TFs contained 4–11 conserved motifs (Figure 2B, C). All NtMYBs contained motifs 1, 2, 3, 4, and 5, except for the absence of motif 3 in NtMYB247, NtMYB192 and NtMYB51, motif 2 in NtMYB145, NtMYB173 and NtMYB246, motif 4 in NtMYB225, NtMYB59 and NtMYB165, and motif 5 in subgroups Nt27, Nt29, Nt30, Nt31, Nt33 and NtMYB159, NtMYB115, NtMYB163, NtMYB20. Based on their motif composition, motifs 3 and 5 and part of motif 1 constituted the MYB R2 domain, and part of motifs 1, 2, and 4 composed the R3 domain. The R2 domain contained three highly conserved tryptophan residues (W), whereas the R3 domain had two highly conserved W residues, with the first W often replaced with a phenylalanine (F), isoleucine (I), leucine (L), or tyrosine (Y) residue (Figure 2D). Some motifs existed only in specific subgroups or a few members. For example, motif 8 was only found in subgroups Nt2, Nt6 and NtMYB21 in subgroup Nt4. Motif 14 was shared by all members of subgroup Nt31, NtMYB103 and NtMYB104 in subgroup Nt3, NtMYB23 in subgroup Nt16, NtMYB51 in subgroup Nt32, whereas motif 15 was specific to six members in subgroup Nt2, NtMYB21 and NtMYB53 in subgroup Nt4.
3.3 3D protein structure prediction of NtMYBs
One representative member of each 2R NtMYB subgroup was selected for 3D protein structure prediction. As shown in Figure S1, NtMYB proteins were mainly composed of an α-helix and random coil, and each MYB domain contained “helix-turn-helix” structures, of which the three highly conserved residues formed a hydrophobic core. It is worth noting that the first W of the R3 domain was often replaced with F (21 out of 33), followed by I (4), L (4), or Y (2). Only two of them had a conserved W. Most NtMYB proteins showed highly similar configurations, except for five proteins. Among them, NtMYB195, NtMYB183, and NtMYB176 showed relatively high similarity, but were different from other NtMYB proteins. In addition, the R2 domain of NtMYB165 and NtMYB33 had a distinct structure from that of other proteins.
3.4 Chromosomal localization and gene duplication analysis of tobacco
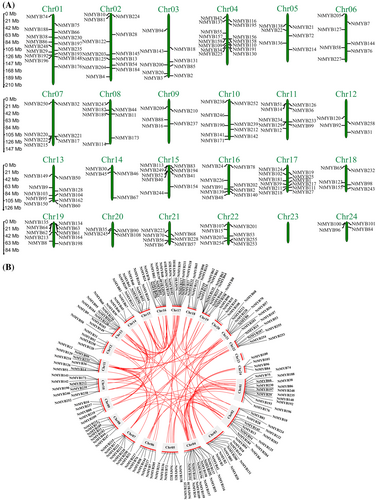
The chromosomal locations of the NtMYBs were determined and displayed based on the information obtained from the China Tobacco Genome Database. 190 out of 258 (73.6%) NtMYB TFs were unevenly distributed across 23 tobacco chromosomes. No NtMYBs were mapped to chromosome 23, and 68 (26.47%) were anchored to unattributed scaffolds. Chromosome 1 harbored most of the NtMYB TFs (16 members), followed by chromosome 4 with 15 members and chromosome 2 with 13 members, whereas chromosomes 12, 14, 20, and 24 contained the fewest NtMYB TFs, 4 members each.
Gene duplication events can provide expansion information for the NtMYB TF family during species evolution. According to a criterion reported by (Zhu et al., 2014), a total of 18 adjacent homologous gene pairs on the same chromosome comprising 23 genes were characterized as tandem duplications, which were distributed mainly on chromosome 19, followed by chromosomes 4, 15, and 22. The remaining 102 paralogous gene pairs were identified as whole-genome or segmental duplications scattered across the chromosomes except chromosome 23 (Figure 3). The genes considered as segmental duplications were distributed mostly on chromosome 1, followed by chromosomes 2, 15, and 17. Overall, segmental duplication events (85%) dominated the expansion of the NtMYB TF family in N. tabacum, whereas tandem duplications were limited (15%).
3.5 Cis-elements in the NtMYB promoters
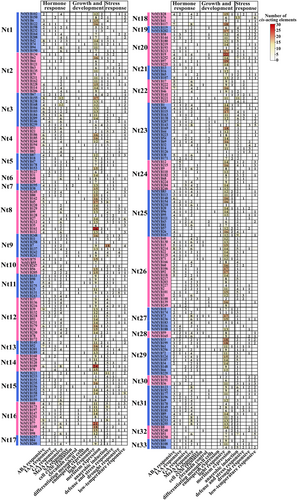
Promoter cis-elements play important roles in gene expression initiation. To investigate the regulatory mechanisms of NtMYB TFs, the promoter cis-acting elements of the 258 NtMYBs associated with plant growth and development, phytohormone responses, and stress responses were identified using PlantCARE and visualized using the TBtools (Figure 4). Among hormone -responsive elements (ABA, IAA, GA, MeJA, and SA), the ABA-responsive element (ABRE) and MeJA-responsive elements (TGACG and CGTCA motifs) were the most abundant in most NtMYB promoters. For example, the promoters of NtMYB23 and NtMYB39 harbored nine ABRE elements, and NtMYB155 and NtMYB168 contained 12 MeJA-responsive elements. Auxin-responsive elements (TGA-element, AuxRR-core, and AuxRE), GA-responsive elements (TATC box, P-box, and GARE-motif) and SA-responsive elements (TGA-element and SARE) were also detected in the promoters of tobacco NtMYB TFs. As for cis-acting elements associated with plant growth and development, light-responsive elements (including G-box, Box 4, GT1-motif, TCT-motif, GATA-motif, AE-box, chsCMA1a, I-box, and MRE) were the most common. The promoters of NtMYB161, NtMYB109, NtMYB19, and NtMYB77 harbored 26, 24, 22, and 21 light-responsive cis-acting elements, respectively. Four stress-responsive cis-acting elements, including the anaerobic-responsive element (ARE), defense and stress-responsive elements (TC-rich repeats), drought-responsive element (MBS), and low temperature-responsive element (LTR), were identified. Most NtMYB TFs contained one or several types of stress-related regulatory elements. The promoters of NtMYB7 harbored 18 AREs, NtMYB131 contained five MBSs, and NtMYB158 contained nine LTRs. The expression of these NtMYBs may be regulated by different hormones, diverse light-responsive elements, defense signals, and abiotic stresses during tobacco growth and development.
3.6 Expression of NtMYB family genes
3.6.1 Spatiotemporal expression profiles of NtMYBs
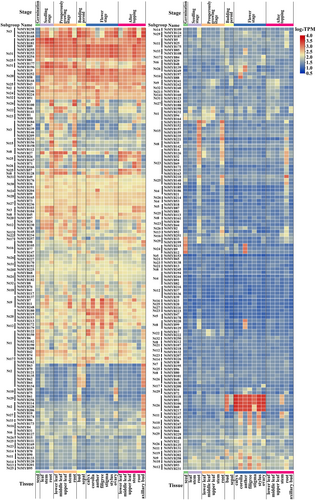
To elucidate the potential functions of the NtMYB TFs in tobacco growth and development, transcript data in six developmental stages including different tissues in N. tabacum L ‘Honghuadajinyuan’ were extracted from the China Tobacco Genome Database. The expression profiles of the NtMYB family genes are shown in Figure 5. Among the 258 NtMYB genes, 25 genes, mainly distributed in subgroups Nt3, Nt20, Nt24, Nt25, Nt27, Nt28, Nt30, and Nt31, were expressed in nearly all stages and tissues. Thirty-three genes showed lower expression levels (less than 1.5 normalised log2 TPM value) throughout the tobacco growth period. The remaining genes showed obvious stage- and tissue-specificity in their expressions. For example, NtMYB33 and NtMYB199 in Nt29 and NtMYB215, NtMYB9, and NtMYB12 in Nt24 showed higher expressions in germinating seeds. Thirty-three genes, including NtMYB100, NtMYB151, and NtMYB35, showed increased expression in seedling roots and prosperously growing stages. NtMYB118, NtMYB92, NtMYB106, NtMYB60, and NtMYB217 in Nt26 expressed higher levels in the buds and flowers. Several genes in subgroup Nt2, including NtMYB63, NtMYB79, and NtMYB134 and Nt27 (NtMYB10 and NtMYB174), were highly expressed in the axillary buds after topping. NtMYB55 and NtMYB75 expressed higher levels in the ovary and buds. NtMYB85, NtMYB108, NtMYB139, and NtMYB249 displayed higher expression levels in the anthers than other organs. The spatiotemporal expression profiles of the NtMYBs suggested their functional significance in different growth stages and tissues.
3.6.2 NtMYB TFs expressions in response to drought and infection with P. parasitica var. nicotianae or R. solanacearum
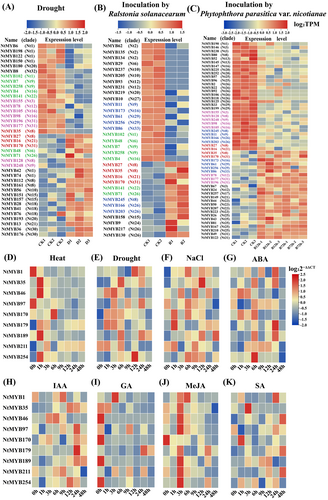
To investigate the potential functions of the NtMYB TFs in response to abiotic and biotic stresses, transcript data of N. tabacum L. ‘Honghuadajinyuan’ under different stress treatments, including drought, R. solanacearum inoculation, and P. parasitica inoculation, were downloaded from the NCBI SRA database. After removing linkers and low-quality bases, differentially expressed genes (DEGs) in the NtMYB TF family were identified and their expression levels were determined using the TPM method. The expression profiles of the DEGs are shown in Figure 6A-6C. Under drought stress, the expression of 21 NtMYB genes was significantly induced, whereas that of 18 genes were suppressed. After infection with R. solanacearum, 13 NtMYB genes were significantly upregulated and 20 were downregulated. The expression levels of 24 and 30 NtMYB genes were up- and downregulated, respectively, after inoculation with P. parasitica var. nicotianae. Overall, the expression levels of 39, 33, and 54 NtMYB genes were significantly altered after drought treatment, P. parasitica inoculation, and R. solanacearum inoculation, respectively. NtMYB27, NtMYB35, NtMYB16, and NtMYB170 appeared among the three treatments, although they displayed varied expression patterns. Except for NtMYB27, these DEGs were all upregulated after drought and R. solanacearum treatments. The expression of NtMYB35 and NtMYB170 was enhanced, whereas that of NtMYB27 and NtMYB16 was suppressed after P. parasitica var. nicotianae inoculation. Some NtMYB genes were significantly induced or inhibited under two simultaneous treatments. For instance, under both drought and R. solanacearum treatments, the expression levels of seven genes, including NtMYB102, NtMYB48, NtMYB7, NtMYB258, NtMYB4, NtMYB141, and NtMYB71, were significantly altered. Most of these showed similar expression patterns, except for NtMYB48 and NtMYB141. Under both drought and P. parasitica var. nicotianae treatments, the expression levels of eight genes changed evidently, among which five genes, including NtMYB128, NtMYB78, NtMYB248, NtMYB196, and NtMYB177 displayed opposite expression patterns, whereas NtMYB155, NtMYB105 and NtMYB98 were all downregulated under both treatments. NtMYB8, NtMYB245, NtMYB173, NtMYB166, NtMYB203, NtMYB61, and NtMYB256, but not NtMYB11 changed obviously in expression and showed opposite expression patterns under R. solanacearum and P. parasitica var. nicotianae treatments. These results indicated the functional significance of the NtMYB family TFs in response to abiotic and biotic stresses.
3.6.3 NtMYB TFs expressions in response to hormone and abiotic stresses
To further investigate the roles of tobacco NtMYB TFs, the gene expression patterns of nine randomly selected NtMYBs in response to abiotic stresses (drought, salt, cold, and heat) and different hormones (ABA, SA, IAA, MeJA, and GA) were analyzed using q-RT PCR (Figure 6D-6 K, Table S3a-3 h). All genes responded to different stresses and hormones. High temperature induced the expression of NtMYB35, NtMYB4, NtMYB170, NtMYB179, NtMYB211, and NtMYB254, peaking at different time points, but decreased that of NtMYB1 and NtMYB97. Drought significantly induced the expression of NtMYB35, NtMYB170, NtMYB179, and, particularly, NtMYB35, but inhibited that of NtMYB211. Under high-salt treatment, the expression of NtMYB1, NtMYB35, and NtMYB179 was significantly induced, whereas that of NtMYB211 was suppressed.
In response to the hormone treatments, the following genes displayed diverse expression patterns: under ABA treatment, NtMYB1, NtMYB35, and NtMYB179 were obviously upregulated, peaking three times at different points. NtMYB46 and NtMYB170 were initially upregulated, then downregulated. Following IAA treatment, several genes, including NtMYB1, NtMYB97, NtMYB189, NtMYB211, and NtMYB254, initially were downregulated, then upregulated, and then downregulated again. NtMYB35 and NtMYB46 were upregulated at 3 h or 6 h. The expression of NtMYB35, NtMYB46, NtMYB170, NtMYB189, and NtMYB254 was obviously suppressed in response to exogenous GA treatment, whereas others were induced to different degrees at different time points. After MeJA treatment, NtMYB1 expression was enhanced. After SA treatment, the expression levels of all nine genes except NtMYB97 were upregulated at different time points and showed a multimodal or unimodal trend. These results provided a basis for the functional exploration of the NtMYB TF family.
3.7 Generation and identification of NtMYB35 transgenic plants
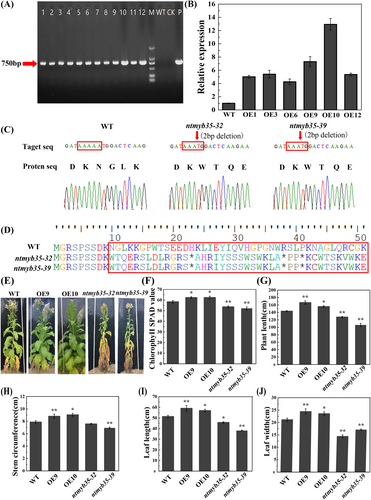
As the RNA-seq and q-RT PCR data indicated that NtMYB35 plays important roles in tobacco plant growth and responses to (a)biotic stresses, we generated NtMYB35-overexpressing and -mutant plants to confirm its function. The OE lines were confirmed using PCR and the expression levels were determined by q-RT PCR (Figures 7A and 7B). Two mutants, ntmyb35-32 and ntmyb35-39, were confirmed by sequencing, and they both contained a 2-bp (AA) deletion, leading to a premature termination codon (Figures 7C and 7D). These two mutants and the two OE lines with highest expression levels (OE9 and OE10) were selected for the use in subsequent experiments.
3.8 NtMYB35 OE enhances the photosynthetic capacity, changed the pigment component contents and aphid resistance in tobacco
Under the same field growth conditions, the NtMYB35-OE plants grew best and had significantly increased plant length, stem circumference, leaf length, and leaf width 70 days after transplantation to the field (Figure 7G–7J), whereas the mutants showed chlorosis and premature aging (Figure 7E). To verify the phenotype, the chlorophyll content was measured (Figure 7F) and the chlorophyll SPAD values of the OE lines were significantly higher than those of the wild type and knockout lines.
As expected, NtMYB35 OE significantly enhanced the photosynthetic capacity, with Pn, Gs, and Tr values being obviously higher for the OE lines than for the wild type. The knock-out plants showed opposite trends for these parameters (Figure 8A–8D). Three types of carotenoids, including (E/Z)-phytoene, ε-carotene, and β-carotene, and five types of lutein, including violaxanthin palmitate, 8′-apo-beta-carotenal, capsanthin, lutein, and neoxanthin, were detected at significant levels (Figure 8E–8 L). The contents of ε-carotene, capsanthin, lutein, and neoxanthin were significantly increased in OE plants, whereas they were significantly decreased in the knockout lines. In contrast, the content of (E/Z)-phytoene was significantly decreased in the OE lines, but significantly increased in the knockout lines. The contents of β-carotene and 8′-apo-beta-carotenal aldehyde were significantly higher in the OE lines than in the wild type, whereas there was no significant change in the knockout lines.
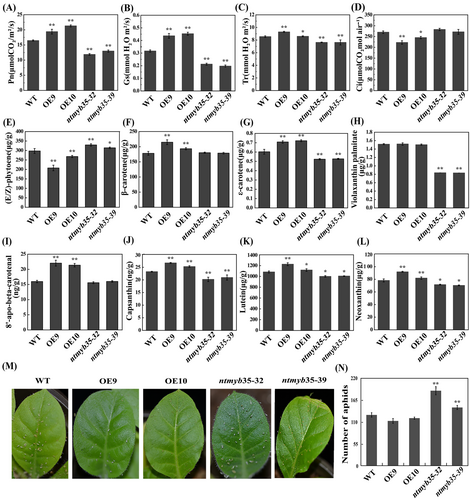
As we observed that ntmyb35 mutant plants were more infested by aphids in the field, we analyzed the aphid resistance of wild-type, OE, and mutant plants by inoculating them with the same number of aphids under the same controlled conditions. Fourteen days after inoculation, the numbers of aphids on the plants of the mutant lines were significantly higher than those on wild-type plants and plants of the OE lines (Figure 8 M-8 N).
4 DISCUSSION
In this study, 258 2R-MYB TF family members were identified in N. tabacum L. ‘Honghuadajinyuan’, which were classified into 33 subgroups according to the classification of Arabidopsis thaliana 2R-MYB TFs, compared to Yang et al. (2022) identified 174 members in N. tabacum L. ‘K326’ (Table S4). We found that the tobacco 2R-MYB TF family did not contain homologs to the fifth subgroup of Arabidopsis 2R-MYB TFs, which was consistent with previous findings in Solanum tuberosum L. (Li et al., 2020). During evolution, segmental duplication events other than tandem duplications dominated the expansion of the NtMYB TF family, which may be because tobacco is an allotetraploid plant. Gene structure analysis showed that 2R-NtMYB TFs within the subgroups had similar structures, and most members (87%) were intron-less or harbored only one to three introns. Motif patterns showed the same phenomenon, with similar types and numbers of motifs within the subgroups. These results are highly consistent with Arabidopsis thaliana and Solanum tuberosum L. (Dubos et al., 2010; Li et al., 2020). Some motifs were specific to certain subgroups or few members and may play a role in functional specificity. The R2 and R3 domains of NtMYB TFs both contained three or two highly conserved tryptophan residues, which are considered to be critical for the interaction of MYBs with DNA helices and necessary for DNA binding activity (Dubos et al., 2010).
Cis-acting elemental analysis showed that the promoters of 2R-NtMYB harbored various cis-acting elements that participate in regulating plant growth and development, secondary metabolism, hormone signaling, and stress responses. The promoter of NtMYB23 harbors nine ABRE elements, NtMYB155 contains 12 MeJA-responsive elements, NtMYB161 contains 26 light-responsive cis-acting elements, and that of NtMYB7 contains 18 ARE elements, suggesting potentially important regulatory roles for NtMYB TFs.
In contrast to Yang et al. (2022), who focused on analyzing the expression profile of NtR2R3-MYB genes in the middle leaves (8th to 10th) of the tobacco variety Cuibi 1 (CB-1) at five senescence stages, our study analyzed expression data from six growth stages and 16 different tissues. Chip-based expression profiling of the NtMYB family genes in different tissues and developmental stages revealed that part of the NtMYB family genes were constitutively expressed, whereas most showed stage- and tissue-specific expression. For example, five members of subgroup Nt26 had higher expression levels in the buds and flowers and 33 members were highly expressed in the roots, indicating that these TFs may be important in regulating tobacco growth, development, and secondary metabolism. In line herewith, a previous study reported that the 2R-MYB TF NtMYB330 regulates proanthocyanidin biosynthesis and seed germination in tobacco (Zhao et al., 2022).
Gene expression profiling by RNA-seq provided useful information for functional assessments. Drought is a key restrictive stress factor affecting tobacco growth, yield, and quality. Tobacco black shank and bacterial wilt are two of the most devastating tobacco diseases in major production areas in China. Therefore, it is urgent to mine the key regulatory genes and understand the disease resistance mechanisms. RNA-seq data analysis revealed 21, 13, and 24 up- and 18, 20, and 30 downregulated 2R-NtMYB DEGs after drought treatment, P. parasitica infection, and R. solanacearum infection, respectively. Notably, four 2R-NtMYBs (NtMYB27, NtMYB35, NtMYB16, and NtMYB170) responded to three types of stress with varied expression patterns, which suggests that these TFs have multiple roles in the responses to different abiotic and biotic stresses. q-RT PCR results confirmed that the expression of 2R-NtMYB can be induced by different hormones and abiotic stresses. Previous studies have displayed that MYB TFs participate in the regulation of the biosynthesis of plant antibacterial substances and the response to the pathogen invasion. For example, CsMYB96 enhances the resistance to Penicillium italicum by activating the transcription of CsCBP60g, which encodes a calmodulin-binding protein, to promote SA biosynthesis and increase the phenolic acid content in Citrus reticulata (Zhang et al., 2021). MdMYB73 improves a resistance to Botryosphaeria dothidea by enhancing SA signaling in Malus domestica ‘Royal Gala’ (Gu et al., 2020). In Gossypium hirsutum, the 2R-MYB TF GhODO1 positively regulates the resistance to Verticillium dahliae through mediating lignin biosynthesis and jasmonic acid signaling (Zhu et al., 2022).
To verify the key functions of NtMYB35, NtMYB35 OE and mutant lines were generated. The OE lines grew better than the wild type and the mutant lines, whereas the mutant lines displayed reduced photosynthetic capacity, with lower contents of chlorophyll, several carotenoid types, and their degradation metabolites, and showed chlorosis and premature aging in the field. It is worth noting that the content of (E/Z)-phytoene, which is located upstream of the carotenoid metabolic pathway, accumulated less in the OE lines, which may partly explain the higher contents of downstream carotenoid degradation metabolites in these plants. Phytocarotene is mainly synthesized via the methyl erythritol phosphate pathway. Studies have shown that in tomato and pepper, MYB TFs regulate the carotenoid content by regulating the expression of carotenoid metabolism-related genes (Wu et al., 2020; Song et al., 2023). In line herewith, we found that NtMYB35 may be involved in the regulation of tobacco carotenoid metabolism. Additionally, these pigments are also implicated in the plant's response to various stresses. Previous studies have shown the disruption of chloroplast function and changes in the contents of chlorophylls and carotenoids could influence aphid feeding preferences, multiplication rate, and population build-up (DeBlasio et al., 2018; Ipsita et al., 2022). Given that ntmyb35 mutant plants were more susceptible to aphid infestation in the field, we conducted an evaluation of aphid resistance in wild-type, overexpression, and mutant plants by inoculating them with an equal number of aphids under controlled conditions. The result showed that NtMYB35 OE in tobacco increased its resistance to aphids. However, the potential mechanism of NtMYB35 regulating pigment synthesis and aphid resistance remains to be elucidated.
5 CONCLUSION
We identified 258 2R-MYB TFs in N. tabacum. Referring to the classification of A. thaliana 2R NtMYB TFs, they were classified into 33 subgroups. The gene structures and motifs were found to be conserved within the subgroups. Segmental duplication dominated the evolution of the NtMYB TF family. The promoters of 2R-NtMYB harbor numerous potential cis-acting elements related to plant growth and development, metabolism, hormone signaling, and stress responses. NtMYB expression is constitutive or spatiotemporally specific. Some NtMYBs potentially involved in the response to abiotic (drought) and biotic stresses (P. parasitica and R. solanacearum inoculation) were identified. Further, we found NtMYBs responsive to different hormones like ABA, IAA, GA, MeJA, and SA and abiotic stresses in form of heat, drought, and salt. NtMYB35 TF plays an important role in tobacco growth, pigment metabolism, and resistance to aphids. This study provided a comprehensive overview of the NtMYB TF family and valuable insights for their further functional characterization.
AUTHOR CONTRIBUTIONS
C.L. conceived the study and drafted the manuscript. D.C. performed the main bioinformatics analyses. X.C. and W.Z. participated in the experiments and analysis of the results. S.Z. and H.J. helped in the experiments. Y.Y. conceived and revised the manuscript. All authors read and accepted the final manuscript.
ACKNOWLEDGEMENTS
The authors are grateful to the providers who submitted the RNA-seq data to the public expression databases which can be applied freely.
FUNDING INFORMATION
This work was supported by Henan provincial key science and technology research projects (Grant number 192102110002) and Key Scientific Research Foundation of the Higher Education Institutions of Henan Province (Grant number 22A210019).
Open Research
DATA AVAILABILITY STATEMENT
The sequence of MYB TFs of N. tabacum L. ‘Honghuadajinyuan’ was retrieved from China Tobacco Genome Database (http://10.6.0.76/; restricted), All data and supplementary materials for supporting the findings of this analysis are available from the corresponding author upon the reasonable request. RNA-seq data of N. tabacum L. ‘Honghuadajinyuan’ after drought treatment, Phytophthora parasitica var. nicotianae and Ralstonia solanacearum infection were download from the NCBI SRA database (https://www.ncbi.nlm.nih.gov/sra/ PRJNA576540, PRJNA320659, PRJNA451198).


