Unravelling the Functional Role of GthGAPC2 in Cotton's Defense Against Verticillium dahliae through Proteome
Abstract
Cotton (Gossypium spp.) is an economically important crop, but its productivity is often hindered by the soil-borne pathogen Verticillium dahliae. This study aimed to investigate the response of cotton roots to V. dahliae infection by analysing the proteome of Gossypium thurberi (resistant) and Gossypium raimondii (susceptible) at 0 h, 24 h, and 48 h post-infection. Through weighted protein coexpression network analysis, fifteen hub proteins crucial for defense against V. dahliae were identified. Expression analysis revealed the pivotal role of GthGAPC2, encoding GLYCERALDEHYDE-3-PHOSPHATE DEHYDROGENASE 2, in conferring resistance to V. dahliae in cotton. Virus-induced gene Silencing (VIGS) of GthGAPC2 increased susceptibility to V. dahliae, which was supported by oxidant and antioxidant enzyme activities. Furthermore, GthGAPC2 silencing influenced lignin content, indicating its involvement in lignin biosynthesis regulation. Transient overexpression of GthGAPC2 in tobacco supported its role in cell death processes. Subcellular localization studies showed predominant nuclear localization of GthGAPC2. Overexpression of GthGAPC2 in Arabidopsis also confirms its significant role in V. dahliae resistance. These findings shed light on the molecular mechanisms of disease resistance in Gossypium thurberi. Identification of GthGAPC2, as a key protein involved in V. dahliae resistance, and its functional implications can aid breeding strategies for enhancing cotton's disease resistance.
1 INTRODUCTION
Cotton holds paramount significance as a pivotal economic crop globally, contributing approximately to 35% of the total natural fiber utilized by the textile industry. Additionally, it functions as a vital source of edible oil and livestock feed (Man et al., 2022). Cultivated across more than 80 countries, approximately 30 of these nations consider cotton a commercially predominant crop (Abdelraheem et al., 2019). According to data from the U.S. Department of Agriculture, the aggregated global cotton production for the 2022–2023 period reached 25.343 million tons (Zhu et al., 2023). China emerged as the primary raw cotton producer, with a production volume of 6.1 million tons, followed by India, the USA, Brazil, and Pakistan, contributing 5.99, 3.06, 2.83, and 0.98 million tons, respectively. The cotton genera, Gossypium spp., encompass 45 diploid species (2n = 2x = 26) and seven tetraploid species (2n = 4x = 52) (Zhu et al., 2023).
Exposure to diverse environmental stimuli results in a significant reduction in both yield and fiber quality in cotton cultivation. Various adverse factors, including drought, salinity, temperature stress, pests, nematodes, bacteria, viruses, and fungi, contribute to this decline (Kamburova et al., 2022). Notably, Verticillium dahliae, identified as the cancer of cotton crops, stands out as the most destructive disease due to its widespread prevalence and potent pathogenicity under favorable conditions (Umer et al., 2023). In 2021, the impact of V. dahliae on cotton crops in China resulted in losses amounting to 32.49% of the overall losses attributed to various diseases (Zhu et al., 2023). Despite considerable efforts in traditional breeding to develop wilt-resistant cotton cultivars, only a limited number of varieties have shown resistance to the wilt in Gossypium hirsutum, which is the predominant cotton species currently grown worldwide (Baran et al., 2022; Yang et al., 2023; Zhu et al., 2023).
The wild counterpart of domesticated cotton, Gossypium thurberi, has been found to possess remarkable resistance against V. dahliae. This discovery highlights its potential as a valuable source of resistance in breeding programs aimed at developing resistant cotton varieties (Fang et al., 2012; Yang et al., 2021).
Proteomics is a vital tool for studying plant-pathogen interactions and understanding plant defense mechanisms (Liu et al., 2019). Using techniques like mass spectrometry, it identifies key proteins involved in pathogen recognition and defense responses. This approach unveils dynamic changes in protein expression, post-translational modifications, and protein–protein interactions, providing a comprehensive view of plant immunity (Elmore et al., 2021). Proteomics also sheds light on metabolic shifts during interactions, offering insights into resource allocation for defense. Additionally, it facilitates biomarker discovery for assessing plant health. Overall, proteomics provides a concise and powerful platform for deciphering the molecular complexities of plant defense, essential for targeted strategies in agriculture and disease management (Liu et al., 2019). Proteomics has the potential to reveal a complete picture of the intricate events at the protein level, shedding light on the key proteins and pathways involved in plant defense against pathogens.
Cotton's resistance to V. dahliae involves a multitude of cellular processes. Recent studies have shown that GaRPL18, a ribosomal protein in Gossypium arboreum, plays a crucial role in the plant's defense against V. dahliae. This protein has been identified as a key player in the resistance mechanism, further highlighting the intricate and diverse strategies employed by cotton to fend off V. dahliae (Gong et al., 2017). Moreover, GbERF1-like, an ethylene response-related factor present in Gossypium barbadense, plays a significant role in promoting resistance against V. dahliae. This factor has been found to upregulate lignin synthesis, a crucial process that contributes to the plant's defense response. The enhanced lignin production helps strengthen the cell walls, providing an additional barrier against the pathogen and ultimately increasing the cotton's resistance to V. dahliae (Guo et al., 2016). Post-translational modifications play a crucial role in facilitating the proper functioning of numerous cellular processes. These modifications can have significant effects on protein activity, interactions with other proteins, and protein targeting within the cell (Zulawski et al., 2012). A comparative proteomic analysis was conducted on mock and V. dahliae inoculated roots at different time points using Hai 7124, a sea-island cotton cultivar commonly employed for genetic mapping and transcriptional analysis in relation to resistance mechanisms (Zhang et al., 2002; Zhang et al., 2020).
This study aimed to identify proteins associated with resistance to V. dahliae in Gossypium raimondii and Gossypium thurberi. To achieve this, cotton roots infected with V. dahliae were analysed using label free-based protein quantification to assess changes in protein expression levels. A weighted protein coexpression network analysis (WPCNA) was conducted to identify hub proteins potentially involved in the resistance. Among the candidate hub proteins, GthGAPC2 was selected for further investigation. Its expression changes in response to V. dahliae were confirmed using qRT-PCR. Additionally, the function of GthGAPC2 in V. dahliae resistance was studied using virus-induced gene silencing (VIGS) and overexpression in Arabidopsis. The findings of the study indicated that GthGAPC2 plays a role in conferring resistance to V. dahliae and could be a valuable target for breeding programs aimed at enhancing disease resistance in cotton.
2 MATERIALS AND METHODS
2.1 Plant material, Verticillium dahliae strain, and culture conditions
Plant materials representing wild diploid species in Gossypium of the D genome, namely Gossypium raimondii (D5) highly susceptible (Zhang et al., 2013), and Gossypium thurberi (D1), highly resistant to V. dahliae (Fang et al., 2012) were acquired from the National Wild Cotton Nursery managed by the Institute of Cotton Research, Chinese Academy of Agricultural Sciences (ICR-CAAS) in Sanya City, Hainan Island, China. The cotton seeds underwent delinting with sulfuric acid, sterilization with 1% sodium hypochlorite for 15 minutes, and three washes with sterilized water to eliminate pathogens. To ensure optimal germination, the seed coat was slightly slit, and the seeds were pre-germinated on sterilized moist filter paper in an incubator at 28°C with >90% ambient humidity for 2–3 days until the radicle reached about 1 cm in length. V. dahliae GFP-labelled strain (Vd-GFP-991) was obtained from The College of Biology and Food Engineering, Anyang Institute of Technology, Anyang, Henan, 455000, China. After culturing on potato dextrose agar (PDA) solid medium at 25°C for 5 days, the V. dahliae was transferred to Czapeks medium and incubated at 25°C for 5 days (W. Gao et al., 2013; Sun et al., 2021). Protein quantification, evaluation of physiological and biochemical parameters, and quantitative real-time PCR (RT-qPCR) analysis were performed on samples collected as three biological replicates at 0 h, 24 h, and 48 h.
2.2 Plant inoculations
Cotton plants at the same growth stage (having two true leaves) were used for root injury. Conidial suspensions were diluted with sterile water to a final concentration of about 1 × 10⁷ conidia/mL and 10 mL of suspension was injected into the soil near the injured cotton roots (Gong et al., 2018).
2.3 Confocal observation of the infection process of V. dahliae in cotton roots
The seeds of cotton varieties were placed in a seed germination bag and grown for 5 days. Cotton with the same growth vigour were selected and immersed in Vd991-GFP conidial suspension (1 × 10⁷ conidia/mL) for 3 min. Stem sections were cut longitudinally at 0, 24, 48 hours, and 21 days post-inoculation, and examined under a confocal laser scanning microscope (Leica TCS SP8 DTED) (Sun et al., 2021).
2.4 Proteomics via label-free approach
2.4.1 Sample preparation
The samples were homogenized in lysis buffer containing 2.5% SDS and 100 mM Tris–HCl (pH 8.0), and then treated with ultrasonication. Proteins were precipitated from the supernatant using pre-cooled acetone, and the resulting pellet was dissolved in 8 M Urea and 100 mM Tris-Cl. After reduction and alkylation reactions, protein concentration was measured using the Bradford method. Trypsin was added at a ratio of 1:50 (enzyme:protein, w/w) and the resulting mixture was digested overnight at 37°C. The pH was lowered to 6.0 using TFA to end the digestion, and the peptide eluate was purified using a Sep-Pak C18 desalting column before being vacuum-dried and stored at −20°C (Yang et al., 2020; Zhao et al., 2020).
2.4.2 LC–MS/MS analysis
The LC–MS/MS data acquisition was performed using an Easy-nLC 1200 system, coupled with a Q Exactive plus mass spectrometer. A C18 analytical column (50 μm × 15 cm, C18, 2 μm, 100 Å) was used to separate peptides. The mobile phase A consisted of 0.1% formic acid, and mobile phase B was a mixture of 80% ACN and 0.1% formic acid. The peptides were loaded through an auto-sampler and were separated with a constant flow rate of 300 nL/min. The scan cycle for DDA mode analysis included one full-scan mass spectrum (R = 70 K, AGC = 3e6, max IT = 20 ms, scan range = 350–1800 m/z) followed by 15 MS/MS events (R = 17.5 K, AGC = 2e5, max IT = 50 ms). The isolation window for precursor selection was set to 1.6 Da, and the HCD collision energy was set to 28. Former target ion exclusion was set for 35 s (Wu et al., 2010).
2.4.3 Proteomics data analysis
The MS raw data underwent analysis using MaxQuant (V1.6.6) with the Andromeda database search algorithm (Qing et al., 2023). The spectra files were searched against the UniProt proteome database, with the following parameters: LFQ mode for quantification, variable modifications such as oxidation (M), acetyl (Protein N-term) & deamidation (NQ), fixed modification of carbamidomethyl (C), and digestion using Trypsin/P. The MS1 match tolerance was set to 20 ppm for the first search and 4.5 ppm for the main search, while the MS2 tolerance was set at 20 ppm. Identification was performed using Match between runs. Search results were filtered using a 1% false discovery rate (FDR) at both protein and peptide levels, and decoy hits, contaminants, and proteins only identified by sites were removed. The remaining identifications were used for further quantification analysis (Supplementary Files 1, 2, 3, and 4).
2.5 Identification of correlated protein networks through weighted protein coexpression network analysis
Weighted protein coexpression network analysis (WPCNA) was performed using default parameters in R (Gibbs et al., 2013; Langfelder & Horvath, 2008; Zhang & Horvath, 2005). First, we normalized expression values and constructed an adjacency matrix. Next, the adjacency matrix was transformed into a topological overlap matrix (TOM). Proteins with similar expression patterns were grouped into modules. Finally, we exported the proteins from each module using the default parameters for the Cytoscape export (Shannon et al., 2003).
2.6 RT-qPCR for expression dynamics and validations
The FastPure Plant Total RNA Isolation Kit (RC401, Vazyme) was used to extract RNA, followed by cDNA synthesis using the HiScript III 1st Strand cDNA Synthesis Kit (R312 Vazyme), with 1 μg of RNA. For qRT-PCR, the ChamQ Universal SYBR qRT-PCR Master Mix (Q711, Vazyme) was used in an ABI 7500 Fast Real-time PCR System (Applied Biosystems). Gene-specific primers were designed using primer-blast in NCBI, with melting temperatures of 55–60°C, product lengths of 101–221 bp, and primer length of 18–25 bp (Table S1). The reaction mixture included 10 μL 2x ChamQ Universal SYBR qPCR Master Mix, 0.4 μL of each primer, 3 μL template, and ddH2O to make up the total 20 μL volume. The reaction was carried out with one cycle of 95°C for 30 s, followed by 40 cycles of 95°C for 10 s and 60°C for 30 s. We repeated each experiment three times, and two sets of data were used for drawing. The expression of all genes was calculated using the 2−ΔΔCT method (Schmittgen & Livak, 2008). The cotton GhUBQ7 (DQ116441.1) gene was used as an internal reference gene (Xiong et al., 2021).
2.7 Transient expression of GthGAPC2 in Nicotiana benthamiana
The p2300-eGFP-Flag vector was attached to the cloned GthGAPC2, and the resulting plasmid constructs were inserted into Agrobacterium tumefaciens LBA4404. To induce cell death in A. tumefaciens, cells carrying both BAX and GthGAPC2 were resuspended in infiltration buffer to a final OD600 of 0.2 and 1.0, respectively. The mixtures of GthGAPC2 and BAX were infiltrated into N. benthamiana leaves. As a negative control, A. tumefaciens cells carrying eGFP were also infiltrated. The cell death phenotypes were examined 4 days after transient expression by clearing the leaves in boiling ethanol until the chlorophyll was completely removed. Each assay was repeated at least three times for biological replicates (Yu et al., 2022).
2.8 Subcellular localization of GthGAPC2
The GthGAPC2 gene was amplified via PCR using gene-specific primers (Table S2) and the resulting PCR products lacked a stop codon. The p2300-eGFP-Flag vector was used to create a fusion construct with GthGAPC2, which was subsequently transferred into LBA4404. The resulting p2300-eGFP-Flag-GthGAPC2 fusion vector was then transformed to tobacco leaves. The transformed tobacco plants were kept in the dark for two days to allow the expression of the fusion construct, and the subcellular localization of GthGAPC2 was examined using a laser confocal microscope (Leica TCS SP8 DTED) (Han et al., 2023).
2.9 Exploring disease resistance in cotton plants: utilizing cotton VIGS and quantitative analysis
2.10 Evaluating the functionality of oxidative and antioxidant enzymes: An enzymatic activity measurement study and quantification of reactive oxygen species (ROS) assay
Fresh roots were harvested from G. raimondii and G. thurberi at three different time points (0 h, 24 h, and 48 h) post-inoculation. The fresh roots, weighing 0.5 g, were ground and homogenized using a mortar containing 1.5 mL of 50 mM sodium phosphate buffer (pH 7.8) supplemented with a mixture of 2 mM ethylenediaminetetraacetic acid (EDTA), 5 mM β-mercaptoethanol, and 4% (w/v) polyvinylpyrrolidone-40. The homogenate was then centrifuged at 16,000 g for 20 min at 4°C, and the resulting supernatant was stored at −80°C for further analysis of oxidant and antioxidant enzyme assays. The superoxide dismutase activity was measured at a wavelength of 560 nm using the SOD assay kit/YX-C-A500, while peroxidase activity was measured at a wavelength of 570 nm using the POD assay kit/YX-C-A502. Malondialdehyde content was measured at two different wavelengths (532 nm and 600 nm) using the MDA assay kit/YX-C-A400. All assays were performed according to the manufacturer's instructions (Sino Best Biological Technology co, Ltd,) as described by Mehari et al. (2021). The catalase assay was performed at a wavelength of 240 nm using the CAT assay kit/BC0200 as previously described by Kaseb et al. (2020). Additionally, the methods described by Lu et al. (2018) were used to evaluate the levels of hydrogen peroxide (H2O2) (Lu et al., 2018). Carotenoids, protease, PPO, chlorophyll a, b, a + b, and proline were quantified as described earlier by Batool et al. (2022). The data obtained from the evaluation of oxidant and antioxidant enzymes were analysed in MS Excel.
To conduct the reactive oxygen species (ROS) production assay, leaf discs with a diameter of 4 mm were collected from at least five plants, 14 days after V. dahliae inoculation. The leaf discs were then kept in 20 mL of sterile water in a 9-cm Petri dish and incubated overnight in the dark. The next day, the leaf discs were transferred to 1.5-ml tubes containing 100 μL of Bio-Rad Immun-Star horseradish peroxidase substrate (luminol), 1 μL of horseradish peroxidase (HRP), and 1 μL of 1 mM flg22. The Glomax20/20 luminometer (Promega) was used to collect signals every minute for 20 minutes. Each sample was assayed in a triplicate (Yu et al., 2022).
2.11 Histochemical staining of cotton stem lignin and DAB staining
To analyse the lignin histochemical staining of cotton stems, the Wiesner method (Speer, 1987) was employed. Stem cross-sections of collected samples from wildtype, TRV2:00 and TRV2: GthGAPC2 were prepared. The stem cross-sections were dipped in Wiesner reagent, which consists of 3% (w/v) phloroglucinol in dd solution solubilized with absolute ethanol, for 5 minutes. They were then washed twice with distilled water, acidified with 6% hydrochloric acid solution for 5 minutes, and rinsed to remove any residual acid. Finally, the cross-sections were placed onto a glass slide, where they were observed and photographed under a stereo microscope.
The DAB staining method described by X. Gao et al. (2013) was used to estimate the production and accumulation of hydrogen peroxide in leaves. After 72 hours of inoculation with V. dahliae, cotton and arabidopsis leaves were collected, washed with distilled water, and dried with filter paper. The leaves were then placed in a 2-mL centrifuge tube and stained with an appropriate amount of DAB staining solution. The tube was kept in the dark at room temperature for 8 hours. After removing the staining solution, 95% ethanol was added to remove chlorophyll, and the ethanol was changed every 2–3 days. The leaves were washed with sterilized water before taking pictures.
2.12 Over-expression of GthGAPC2 in Arabidopsis thaliana
The GthGAPC2 gene was linked with ‘BamHI’ and ‘SacI’ restriction sites using the homologous recombination method; the resulting expression vector PBI121-35S::GthGAPC2 was used to transform Agrobacterium tumefaciens GV3101 and then Arabidopsis thaliana by the flower-soaking method (Clough & Bent, 1998). The transgenic lines (T0, T1, and T2) were screened on half-strength Murashige and Skoog medium with kanamycin added. The T3 transgenic lines were evaluated, and the expression was checked by qRT-PCR and then used in subsequent experiments. The 20-day-old Arabidopsis plants were inoculated with V. dahliae. Twenty days after inoculation (20 Dpi), the symptoms were scored. According to the degree of leaf yellowing, the degree of resistance to VW is graded from 0 to 4. The calculation method of the disease index was kept the same as above.
3 RESULTS
3.1 Oxidants and antioxidant enzymes activities: An enzymatic activity measurement in Gossypium thurberi and Gossypium raimondii in response to V. dahliae attack
We evaluated the performance of oxidants and antioxidant enzymes, alongside several biochemical parameters such as carotenoids, protease activity, polyphenol oxidase (PPO), proline levels, chlorophyll a (Chla), chlorophyll b (Chlb), and total chlorophyll (Chla+b) at distinct time points (0 hours, 24 hours, and 48 hours) (Figure 1a-i).
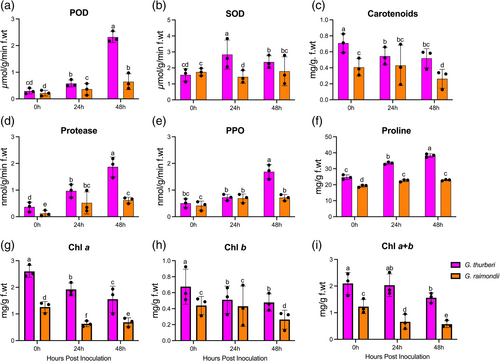
Our research findings indicate notable differences in the response of G. thurberi and G. raimondii to V. dahliae infection. At 48 hours post-infection, G. thurberi demonstrated significantly elevated levels of superoxide dismutase (SOD) and peroxidase (POD) compared to other time points. Carotenoid levels gradually decreased over time, with G. thurberi exhibiting relatively higher levels. Protease content was found to be higher at 48 hours post-infection, with G. thurberi displaying higher protease levels compared to G. raimondii. Additionally, G. thurberi consistently exhibited higher levels of polyphenol oxidase (PPO) and proline content compared to G. raimondii across all time points. The levels of chlorophyll a, chlorophyll b, and total chlorophyll showed a continuous decline, with G. thurberi maintaining higher levels than G. raimondii. In summary, our results highlight distinct variations in the defense mechanisms employed by G. thurberi and G. raimondii against V. dahliae. G. thurberi exhibits higher levels of SOD, POD, carotenoids, protease, PPO, proline, and chlorophyll compared to G. raimondii. These findings provide valuable insights into the differential responses of these cotton species to V. dahliae infection.
3.2 Label-free proteomics in the roots of Gossypium raimondii and Gossypium thurberi
Thirty-five days after germination, cotton plants were inoculated with V. dahliae. Root samples were collected at 0-, 24- and 48-hours post-infection for label-free proteomics analysis.
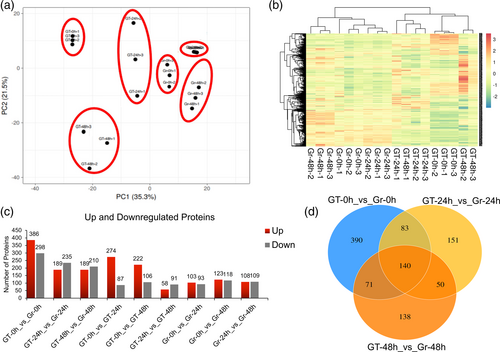
In this study, we employed the robust LFQ-based quantitative proteomics technology to establish the proteomic changes in response to V. dahliae attack. Proteins identified in the three biological replicates, at a 1% FDR, were used for further analysis. The mass spectrum interpretation allowed us to identify 5456 proteins and quantify 4480 proteins from 26,762 peptide spectral matches (Supplementary File 1). Principal component analysis (Figure 2a) and global hierarchical clustering (Figure 2b) were performed based on the protein expression values for all the identified proteins. The results revealed that samples could be generally assigned into three main groups corresponding to stages based on protein expression patterns. The principal component analysis revealed the variations between the different samples. Clustering of samples close to each other indicates similarity in data and clustering of each group away from each other indicates variability of data and differences between each group. Current results showed that downregulated proteins were more abundant compared to upregulated proteins in all the comparison groups (Figure 2c). Venn diagram corresponds to the differentially expressed proteins among different comparison groups (Figure 2d). Overall, the results suggest that proteins were abundant in G. thurberi. GO analysis suggests that the highest number of proteins were found to be enriched in integral components of membrane, ATP binding, cytoplasm, nucleus, and oxidoreductase activity (Figure S1a). KEGG classification suggests that the highest number of proteins were enriched in the metabolic pathways, phenylpropanoid biosynthesis, and plant-pathogen interaction (Figure S1b).
3.3 Identification of differentially abundant proteins in the roots
A total of 2999 proteins were differentially abundant (DAPs) based on pairwise comparison of all the quantified proteins in G. raimondii and G. thurberi. DAPs greater than 2.0-fold and 0.50-fold (P-value ≤0.05) were grouped as significantly upregulated and downregulated, respectively, in each comparison. Furthermore, 196 DAPs were identified in Gr-0 h_vs_Gr-24 h comparison, including 93 upregulated, and 103 downregulated DAPs. Further, upregulated and downregulated proteins in all the comparisons are given in Table 1.
| Comparison Groups | Downregulated | Upregulated | All |
|---|---|---|---|
| Gr-0 h_Vs_Gr-24 h | 103 | 93 | 196 |
| Gr-0 h_Vs_Gr-48 h | 123 | 118 | 241 |
| Gr-24 h_Vs_Gr-48 h | 108 | 109 | 217 |
| Gt-0 h_Vs_Gr-0 h | 386 | 298 | 684 |
| Gt-0 h_Vs_Gr-24 h | 274 | 87 | 361 |
| Gt-0 h_Vs_Gt-48 h | 222 | 106 | 328 |
| Gt-24 h_Vs_Gr-24 h | 189 | 235 | 424 |
| Gt-24 h_Vs_Gt-48 h | 58 | 91 | 149 |
| Gt-48 h_Vs_Gr-48 h | 189 | 210 | 399 |
| Total | 1652 | 1347 | 2999 |
3.4 Weighted protein coexpression network analysis
3.4.1 Identification of coexpressed protein networks and key Candidates
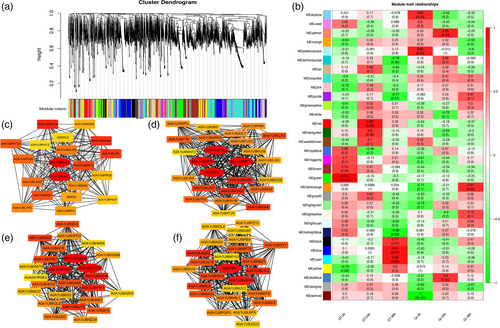
Herein, 7 distinct protein modules were identified via weighted protein coexpression network analysis based on the coexpression patterns of individual proteins (blue, cyan, darkorange, green, red, salmon, skyblue). These protein modules are labelled in distinct colours and presented as a clustergram and network heatmap (Figure 3a-b). Of the 7 coexpressed gene networks, 4 (red, green, blue, cyan) showed significant correlations with G. thurberi, which is considered the resistant variety. The red module contained 235 proteins and showed a significant association with a correlation coefficient (r2) of 0.89. The green module with 61 proteins had a significant association with r2 = 0.99. The blue module consisting of 63 proteins showed significantly high correlations with r2 = 0.91, whereas the cyan module with 107 proteins has r2 = 0.89. A detailed description of the protein module and correlations is presented in Figure 3b. The proteins from each of these 4 modules were selected, and their edges and nodes were calculated with the WPCNA R package for protein-network visualizations. To further search for candidate proteins with major contributions within the protein networks, annotation information of all these proteins was extracted from the cotton reference genome annotation database. This integrative approach of combining intramodular hub proteins consistent with DAPs and comparisons with annotation information was followed by expression analysis for precise identification of key candidates (Figure 3c-f). Details of 11 hub proteins are given in Table 2.
| Hub Protein ID | IDs in G. thurberi | Description |
|---|---|---|
| A0A1U8NBG8 | Gothu.00017336 | Transketolase |
| Q39785 | Gothu.00023628 | Predicted chitinase |
| A0A1U8PG51 | Gothu.00030712 | Glycosyltransferase |
| A0A1U8NGW0 | Gothu.00034390 | Glutathione peroxidase |
| A0A1U8P7R5 | Gothu.00040158 | ABC transporters |
| A0A1U8IUV0 | Gothu.00011285 | Pectin acetyl esterase |
| A0A1U8MFT2 | Gothu.00014858 | Malate dehydrogenase |
| D2D332 | Gothu.00045348 | Glyceraldehyde 3-phosphate dehydrogenase |
| A0A1U8PHA3 | Gothu.00013169 | 26S proteasome regulatory complex |
| A0A1U8MJA7 | Gothu.00020622 | Methionine synthase II |
| A0A1U8JYC8 | Gothu.00039413 | Alcohol dehydrogenase |
3.5 RT-qPCR-based expression profiling of genes corresponding to identified hub proteins
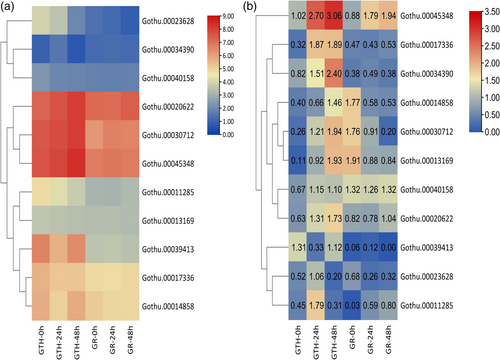
To validate the expression patterns of key candidates RT-qPCR was performed. Expression profiling was performed at similar stages (i.e., 0 h, 24 h, and 48 h post V. dahliae inoculation). The results obtained from the RT-qPCR, and protein expressions were consistent with each other (Figure 4a-b). Finally, Gothu.00045348 (GthGAPC2) was selected for further functional validations. The proteins described as key candidates were selected based on (1) intramodular significance and (2) protein expression profiles.
3.6 Subcellular localization of GthGAPC2
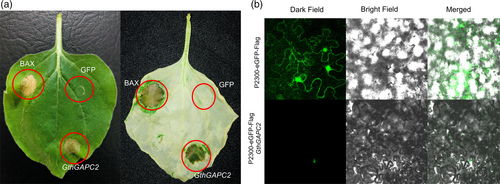
To verify the subcellular location of GthGAPC2 tobacco leaves were overexpressed with GthGAPC2 via pCAMBIA2300-eGFP-Flag. A pCAMBIA2300-eGFP-Flag- GthGAPC2 fusion vector was constructed and delivered into tobacco mesophyll cells. Current results confirmed that GthGAPC2 is localized in the nucleus (Figure 5a).
3.7 Transient expression of GthGAPC2 in N. benthamiana
To determine the role of GthGAPC2 in cell death, we transiently overexpressed it in N. benthamiana. We employed BAX as the positive control, which is able to trigger strong cell death when expressed in tobacco (Lacomme & Santa Cruz, 1999). Four days after infiltration with Agrobacterium cells carrying GthGAPC2, a strong cell death phenotype was observed in N. benthamiana leaves (Figure 5b). These results revealed that GthGAPC2 may act as a positive regulator of plant cell death.
3.8 Silencing of the GthGAPC2 gene decreases the resistance against Verticillium dahliae in cotton
To verify the role of GthGAPC2 in cotton defense against Verticillium dahliae attack, virus-induced gene silencing was used (Figure 6a). About 13 days after VIGS, the cotton leaves were injected with TRV2:PDS, chlorosis started and an albino phenotype was observed, which proved that the VIGS system was established successfully, and the results were accurate for further experiments. Further, wildtype, TRV2:00 and TRV2:GthGAPC2 were inoculated with V. dahliae, and the phenotype was observed 25 days post inoculation. The qRT-PCR results showed that the expression level of the GthGAPC2 gene was significantly lower in silenced plants than WT and TRV2:00, indicating that the GthGAPC2 gene was accurately silent (Figure 6b).
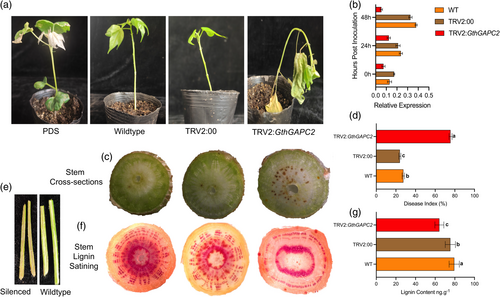
Current results showed that compared with the wildtype and TRV2:00, the leaves of the silent plants turned yellow, wilted, and even fell off, and the disease index of the silent plants was also significantly higher. The degree of infection in silenced plants was more severe. This indicates that silencing GthGAPC2 weakens the cotton's resistance to V. dahliae attack and makes it more vulnerable (Figure 6c). The disease index in the silenced plants was higher than that of non-silenced plants. Longitudinal stem cross-sections also shows that silenced plants were infected more as compared to non-silenced plants (Figure 6d-e). Cotton lignin quantification and dying results showed that silenced plants have lignin inhibition compared to wildtype and TRV2:00 (Figure 6f-g).
3.9 Oxidants and antioxidant enzymes activities: An enzymatic activity measurement study upon silencing of the GthGAPC2 gene
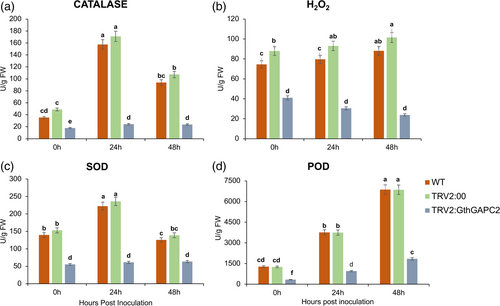
Current results showed that oxidants and antioxidant enzymes were significantly affected by V. dahliae infection (P < 0.05) (Figure 7). The WT and positive control (TRV2:00) plants showed higher concentrations of antioxidant enzymes (CAT, POD, and SOD), and low oxidant (H2O2) enzyme activities as compared to the silenced plants. The increase in oxidants and decrease in antioxidants in the case of silenced plants could be due to the higher oxidative damage.
3.10 Quantification of ROS production assay
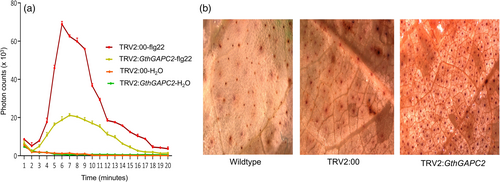
Based on the cell death phenotype that GthGAPC2 could trigger in N. benthamiana leaves and their differential expression following pathogen inoculation, we were interested in the function of GthGAPC2 in cotton immunity. At 14 days after V. dahliae infection, the third leaves of cotton plants were used to explore the ROS burst triggered by flg22. The 4-mm leaf discs were immersed in flg22 solution, and the ROS signals were detected by applying a luminol chemiluminescence assay for 20 min. After the flg22 treatment, a ROS burst peaked at 4 or 6 min. GthGAPC2-silenced plants showed a reduced ROS burst following treatment with flg22 compared to WT and TRV2:00 plants (Figure 8a). These results showed that GthGAPC2 can positively regulates immunity in cotton.
3.11 Assessment of cotton damage through DAB staining following GthGAPC2 silencing
The accumulation of ROS represents the oxidative damage that occurs due to the stress caused by V. dahliae attack. After 72 hours of inoculation, leaves were collected for DAB staining. Wildtype, TRV2:00 and silenced plants started to accumulate ROS, but the leaves of silenced plants were affected more than WT and TRV2:00, indicating that the silencing of GthGAPC2 increased the damage caused by the V. dahliae attack. Due to the damage of V. dahliae, many dead cells were produced in plants. At the same time, the staining area of the silenced plants after inoculation was significantly larger than the wildtype and TRV2:00, which indicated that the extent of damage caused by V. dahliae infection was greatly increased after silencing GthGAPC2 (Figure 8b).
3.12 Enhancing Verticillium dahliae Resistance in Arabidopsis thaliana through overexpression of GthGAPC2
To experimentally validate the contribution of GthGAPC2 in enhancing resistance against V. dahliae, we overexpressed 35S::GthGAPC2. Subsequently, samples from T3 generation plants were collected for a comprehensive analysis of GthGAPC2 expression. Based on findings from RT-qPCR and agarose gel electrophoresis, we focused on the two T3 homozygous lines, namely OE1 and OE9, for further investigations (Figure 9a-c).
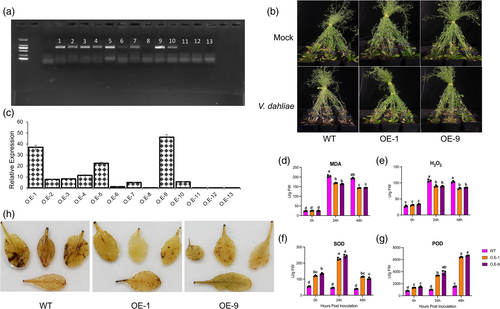
An experimental assessment was conducted to ascertain the influence of incorporating the overexpression vector “PBI121-35S:GthGAPC2” into Arabidopsis thaliana regarding its resistance to V. dahliae. Seeds originating from OE1 and OE9 lines were placed onto an MS medium enriched with a controlled amount of the pathogen. Notably, our results illustrated that the wildtype (WT) exhibited a higher sensitivity phenotype towards V. dahliae than the transgenic lines “OE1 and OE9.” Furthermore, the susceptibility of WT plants to V. dahliae was distinctly inferior to that of the transgenic lines, indicating a reinforced resistance against V. dahliae attack due to the overexpression of the GthGAPC2 gene. Additionally, we investigated alterations in biochemical markers, namely superoxide dismutase (SOD), peroxidase (POD), malondialdehyde (MDA), and hydrogen peroxide (H2O2) levels, within all tested A. thaliana lines when subjected to V. dahliae infection. Our findings indicate that the WT plants exhibit elevated levels of oxidative stress markers, specifically MDA and H2O2, when compared to the overexpressed lines (Figure 9d-g). Conversely, the overexpressed lines demonstrate higher activities of the antioxidant enzymes SOD and POD in comparison to the WT plants. These results imply that the overexpression of GthGAPC2 likely plays a pivotal role in ameliorating the effects of V. dahliae infection by mitigating oxidative damage caused by ROS. This mechanism enhances the plant's resilience to V. dahliae. DAB staining results suggest that WT plants were affected more than the overexpressed plants upon fungal inoculation (Figure 9h).
4 DISCUSSION
Verticillium dahliae, a fungus present in the soil, has the capability to invade cotton roots. The impact of V. dahliae is particularly worrisome due to the pathogen's ability to persist in the soil for extended periods, which presents challenges in managing and controlling the disease. This persistence not only poses a threat to current cotton crops but also carries long-term economic consequences for cotton production (Calvo-Peña et al., 2023; Katan, 2000). The study of disease resistance in cotton against V. dahliae greatly benefits from the application of proteomics techniques (W. Gao et al., 2013; Li et al., 2023). High-throughput multi-omics technologies prove to be efficient approaches for uncovering the response mechanism of cotton to V. dahliae at both the transcriptional and translational levels (F. Wang et al., 2023). Proteomics plays a crucial role in identifying pivotal proteins involved in the plant's defense response, unveiling molecular mechanisms, and identifying potential targets for breeding and genetic improvement (Fang et al., 2012; Jan et al., 2023). Coexpression network analysis holds significant importance in this context, as it helps identify key proteins by revealing groups of genes that exhibit similar expression patterns (Zhang et al., 2021). By integrating diverse data types, including protein–protein interactions and functional annotations, this approach enhances our understanding of protein functions and their regulation within complex systems (Szklarczyk et al., 2023).
During a pathogen attack, plants generate reactive oxygen species (ROS), causing photo-oxidative damage. In response, plants activate defense pathways involving biochemical changes and antioxidant mechanisms (Kaur et al., 2022). The role of oxidants and antioxidant enzyme activities is crucial in determining a plant's resistance or susceptibility to biotic and abiotic stress conditions (Ali et al., 2022; del Río et al., 2018; Kusvuran et al., 2016; Li et al., 2019). Consistent with previous findings by Dong et al. (2019), our results indicate that G. thurberi exhibits higher antioxidant activities (Figure 1) than G. raimondii (Dong et al., 2019). A label-free proteomics analysis was utilized, following the methodology described earlier by Yang et al. (2020). Comparative analysis revealed 2999 differentially abundant proteins (DAPs) between G. raimondii and G. thurberi (Table 1). To gain further insights, we constructed protein coexpression modules based on intramodular hub proteins and differentially abundant proteins (DAPs) as described earlier by Huang et al. (2023). Currently, seven distinct modules possessing candidate proteins linked to V. dahliae resistance have been identified (Figure 3b). Previous studies have also highlighted the significance of coexpression network analysis in identifying hub genes/proteins (Mo et al., 2022; Proost & Mutwil, 2017). RT-qPCR was used to study the expression dynamics of identified candidates as described previously (Ju et al., 2023; Wu et al., 2022; Xiong et al., 2021). Current results confirmed that the expression of GthGAPC2 was higher in G. thurberi than in G. raimondii in response to V. dahliae infection and it might be the candidate gene involved in V. dahliae resistance in cotton (Figure 4a-b). Virus-induced gene silencing (VIGS) was employed (F. Wang et al., 2023) to silence GthGAPC2. Phenotypic observations after fungal inoculations revealed that silenced plants exhibited yellowing, wilting, and leaf drop, indicating increased susceptibility to V. dahliae infection than non-silenced plants (Figure 6a). Current results are in agreement with F. Wang et al. (2023), who reported the same phenotypic symptoms. The disease index was significantly higher in silenced plants compared to non-silenced plants (Figure 6d), indicating a more severe infection as reported earlier by Y. Wang et al. (2023). Additionally, cotton lignin staining demonstrated reduced lignin content in silenced plants compared to non-silenced plants (Figure 6g), in line with previous findings (Zhang et al., 2019).
Biochemical traits are of paramount importance in assessing the impact of biotic stress on cotton in research studies (Y. Wang et al., 2023). Higher concentrations of antioxidant enzymes were observed, accompanied by lower activities of oxidant enzymes in silenced plants than in non-silenced plants (Figure 7a-d), as reported previously (Chen et al., 2023; Zhang et al., 2023). The accumulation of reactive oxygen species (ROS) is considered an indicator of oxidative damage resulting from the stress caused by V. dahliae attack (F. Wang et al., 2023; Y. Wang et al., 2023). Both non-silenced and silenced plants showed ROS accumulation; however, the leaves of silenced plants exhibited more severe effects compared to the non-silenced plants, suggesting that the silencing of GthGAPC2 intensified the damage caused by V. dahliae attack (Figure 10). Previous reports have also highlighted the role of GAPCs in positively regulating ROS accumulation during immune responses triggered by flg22 (Castro et al., 2021). Currently, the overexpression of GthGAPC2 in N. benthamiana leaves induced cell death (Figure 5a). These findings collectively indicate that GthGAPC2 may have a positive regulatory role in PTI (PAMP-triggered immunity). Previous research has also reported that the overexpression of GAPA1 in yeast and Arabidopsis protoplasts inhibited the generation of ROS and programmed cell death induced by the apoptosis regulator BAX (Baek et al., 2008).
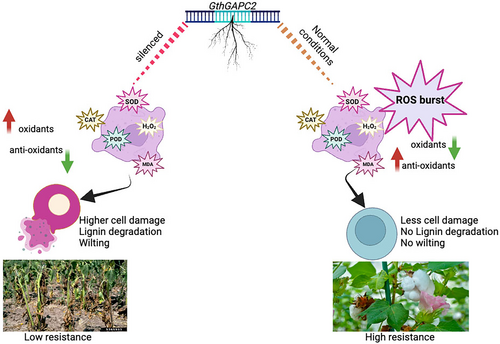
Moreover, the overexpression of GthGAPC2 in Arabidopsis was performed, and the findings indicate a substantial increase in expression within the transgenic lines as compared to wildtype Arabidopsis upon V. dahliae infection (Figure 9). Similar results were observed by Wang et al. (2023) who overexpressed GauERF105 in Arabidopsis. Comparatively, the overexpression lines exhibited lower MDA and H2O2 levels, accompanied by higher SOD and POD activities when compared to wildtype plants (Figure 9d-g). Our findings align with prior research that highlights the critical role of antioxidant defense in governing the interaction between cotton plants and V. dahliae (Dos Santos et al., 2022; Zhang et al., 2022). Additionally, DAB staining results revealed a reduced staining intensity in transgenic Arabidopsis leaves in contrast to the more pronounced staining observed in wildtype plants (Figure 9h). Current investigations on GthGAPC2 have shed light on its multifaceted roles in cotton defense mechanisms. These findings suggest the involvement of GthGAPC2 in regulating PAMP-triggered immunity.
5 CONCLUSIONS
In conclusion, this research provides comprehensive insights into the damage caused by Verticillium dahliae in cotton upon silencing GthGAPC2. The study highlights the significant impact of the pathogen on oxidant and antioxidant enzyme activities, resulting in disrupted redox balance and increased oxidative damage in the silenced plants. The silencing of GthGAPC2 via VIGS in cotton leads to higher oxidants and lower antioxidants accompanied by reduced lignin contents, thus revealing its involvement in V. dahliae resistance. Transient overexpression in N. benthamiana confirmed the role of GthGAPC2 in cell death. Overexpression of GthGAPC2 in Arabidopsis leads to the conclusion that overexpressed plants are more resistant to the pathogen than WT plants. Moreover, DAB staining indicated that the wildtype plants were effected more than the GthGAPC2 overexpressed lines upon fungal inoculation findings emphasize the critical role of GthGAPC2 in cotton's defense against V. dahliae and highlight its potential as a key target for further studies aimed at enhancing disease resistance in cotton breeding programs. Overall, this research contributes to our understanding of the molecular mechanisms underlying cotton's response to V. dahliae and provides valuable insights for developing effective strategies to mitigate the damage caused by this devastating pathogen.
AUTHOR CONTRIBUTIONS
Conceptualization, Fang Liu, and Muhammad Jawad Umer; Data curation, Raufa Batool, Mengying YANG, and Jie ZHENG; Formal analysis, Muhammad Jawad Umer, Mian Faisal Nazir; Investigation, Heng WANG, Xiaoyan CAI, Yuhong WANG, and Yuqing HOU; Methodology, Muhammad Jawad Umer, Kotb A. Attia, and Asmaa M. Abushady; Project administration, Fang LIU; Resources, Ji LIU; Software, Yanchao XU; Supervision, Fang LIU; Validation, Muhammad Jawad Umer.
ACKNOWLEDGMENTS
We are thankful to the Researchers Supporting Project number (RSP-2024R369), King Saud University, Riyadh, Saudi Arabia, and National Key Laboratory of Cotton Bio-breeding and Integrated Utilization/Institute of Cotton Research, Chinese Academy of Agricultural Sciences (ICR, CAAS), Anyang, Henan, 455000, China.
FUNDINGS
This research was funded by the Project of Sanya Yazhou Bay Science and Technology City (SCKJ-JYRC-2023-49, SCKJ-JYRC-2022-88), Nanfan Special Project of National Nanfan Research Institute of Chinese Academy of Agriculture Sciences (YBXM2309, YBXM2324), and Central Public-interest Scientific Institution Basal Research Fund (1610162023030, 1610162023008).
Open Research
DATA AVAILABILITY STATEMENT
In Supplementary Files S1, S2, and S3 are the relevant information such as the number of peptides used for identification, sequence coverage %, peptide sequence, matching score, found modifications, precursor charge, and mass: charge ratio”. In Supplementary File 4 is the summary file containing information for all the raw files processed with a single MaxQuant run.


