Transcriptomics integrated with metabolomics to characterize key pigment compounds and genes related to anthocyanin biosynthesis in Zanthoxylum bungeanum peel
Abstract
Zanthoxylum bungeanum is an important condiment with high economic value and its peel color is one of the main quality indexes. However, the key pigment compounds and related genes are still unclear affecting the quality control of the plants. In this study, the contents of four types of pigments were measured in Z. bungeanum and flavonoids were identified as the most important pigments. Based on the targeted flavonoid metabolomics of Z. bungeanum peels, 14 key pigment compounds were screened out from 152 flavonoids, among which cyanidin-3-O-rutinoside and cyanidin-3-O-glucoside were the most critical compounds for peel color. They were further verified to be present in nine varieties of Z. bungeanum by HPLC fingerprints. The 14 compounds were all associated with flavonoid and anthocyanin biosynthesis pathways and the 39 differentially expressed genes related to these pathways were annotated and screened based on transcriptomics. The genes ZbDFR, ZbANS, and ZbUFGT were identified as three key genes for anthocyanin synthesis in Z. bungeanum peels. Further qRT-PCR results confirmed the reliability of transcriptomics and the accuracy of gene screening. Subsequent protein induced expression demonstrated that ZbANS and ZbUFGT were expressed after 12 h induced by IPTG while ZbDFR was expressed after 15 h. Further transient and stable transformation analysis confirmed that both anthocyanin content and the expression of ZbDFR were significantly increased in overexpression Z. bungeanum leaves and Nicotiana benthamiana. The functional effect of stable transformation of ZbDFR was more significant than that of transient transformation with a 7.67-fold/1.49-fold difference in total anthocyanin content and a 42.37-fold/12.32-fold difference in the expression of ZbDFR. This study provides new insights into the chemical composition and the molecular mechanisms of Z. bungeanum peel color and lays an effective foundation for the color quality control, multi-purpose utilization of Z. bungeanum and the creation of new germplasm.
1 INTRODUCTION
Zanthoxylum bungeanum Maxim, a species of the Rutaceae family, is famous for its economic value as food and medicine in China. Up to now, more than 250 species have been identified around the world (Sun et al., 2020) and at least 50 varieties and cultivars could be found in China (Yu et al., 2020). It has a strong stress resistance and adaptability so that it can be cultivated in many different areas of China (He, 2015; Wang et al., 2012). Its planting area accounts for about 1.67 million hectares in China with an annual output of about 280 kilotons, which makes China the world's largest production country (Dong & Wang, 2019). Z. bungeanum is rich in a variety of active functional ingredients and is widely used in traditional Chinese medicine with properties like dehumidification, insecticidal, analgesic, anti-tumor, antibacterial and other biological activities (Bautista et al., 2008; Lee et al., 2017; Zhang et al., 2016; Zhang et al., 2017). Studies have shown that Z. bungeanum can inhibit lipid oxidation and the formation of carcinogenic heterocyclic amines, thereby reducing the risk of related chronic diseases (Li et al., 2020; Zeng et al., 2018). Thus, the secondary metabolites of Z. bungeanum are considered to have an extensive research value.
In addition to the mentioned physiological activities, color, aroma and taste are also main quality characteristics of Z. bungeanum. It is widely used in food production because of these traits, providing people with a green and healthy flavor experience, becoming a unique part of Chinese traditional food culture (Huang et al., 2006). More than 140 secondary metabolites have been identified from Z. bungeanum peels, among which terpenoids and alkylamide compounds are the main sources of aroma and the spicy taste (Li et al., 2014; Machmudah et al., 2009; Wei et al., 2021; Zhang et al., 2019a, b). The peel is the outermost layer of the fruit and is the most visible trait of the fruit, affecting people's judgment of the fruit quality. The fruit color is a result of the synergistic effect of different types of pigments, such as chlorophyll (Hu et al., 2007; Min et al., 2010; Rodrigo et al., 2012; Takahashi et al., 2013), carotenoids (Llorente et al., 2020; Mendes et al., 2015; Oliveira et al., 2004; Rosassaavedra & Stange, 2016; Seymour et al., 2013; Takashi, 2020) and anthocyanins (Andersen & Markham, 2006; Bueno et al., 2012; Clifford, 2000; Kong et al., 2003; Rein, 2005; Tanya, 2015). It is difficult to accurately describe the fruit color with a single substance. Therefore, for Z. bungeanum peels, it is of great significance to study the key pigment compounds and their related genes.
Recently, advances in high-throughput functional metabolomic and transcriptomic analysis have been applied to research on genes regulating fruit peel coloration. In general, anthocyanins are catalyzed form 4-coumaroyl CoA by a series of structural genes, including early biosynthesis genes like CHS (chalcone synthesis), CHI (chalcone isomerase), F3H (flavanone-3-hydroxylase) and late biosynthesis genes like DFR (dihydroflavonols-4-reductase), ANS (anthocyanidin synthase), UFGT (UDP-flavonoid-3-O-glucosyltransferase; Zhou et al., 2022). The expression levels of these genes lead to differences in anthocyanin accumulation, resulting in different fruit colors. In addition, transcription factors associated with the anthocyanin synthesis pathway could also affect the expression level of these structural genes (Zheng et al., 2020).
Until now, the research on Z. bungeanum peel pigments is quite limited. Only a few articles have reported the extraction method and preliminary identification of its chemical constituents. The functional verification of related genes was also rarely reported. Zhang (2009) identified three pigments in Zanthoxylum schinifolium and confirmed that the color fission of Z. schinifolium might be caused by the degradation of chlorophyll into magnesium-free chlorophyll. Different treatments, such as drying and light treatment, have also been confirmed to affect Z. bungeanum peel pigments (Zhang et al., 2014; Zhang et al., 2019a, b). Chen et al. (2018) optimized the extraction process of Z. bungeanum peel pigments and preliminarily identified the pigment components in the extraction solution, including nine flavonoids and two anthocyanins. Zheng et al. (2020) investigated the pigment composition and metabolic pathways in green peel and red peel of three Z. bungeanum varieties. However, the key pigments of Z. bungeanum peels were not identified and how pigment accumulation during the peel development occurred was not elucidated. The functions of the key genes which were selected from the anthocyanin synthesis pathway were also not verified. Wang et al. (2022a, b) compared the different pigment compounds, intracellular metabolites and gene expression levels during the whole Z. bungeanum development, but they did not identify the key pigment compounds at each stage. This incomplete research restricts the construction of a metabolic network of Z. bungeanum pigment compounds. Therefore, it is of great significance to study Z. bungeanum peel pigment compounds and their related genes.
In this study, four types of pigments (anthocyanins, flavonoids, chlorophylls and carotenoids) at four developmental stages of Z. bungeanum were measured and analyzed. Subsequently, pigment compounds were identified based on targeted metabolomics and the key pigments were screened out by multiple statistical analysis. HPLC fingerprint analysis verified the accuracy of the identification of key pigment compounds. Based on transcriptomics, the key genes that related to the key pigment compounds were screened out. The accuracy of the selection was confirmed by qRT-PCR. Protein induced expression was used to confirm the expressions of key genes under IPTG induction. Based on homologous transient transformation and heterologous stable transformation, the functions of the selected genes were further verified. This research systematically elucidates the color mechanism of Z. bungeanum peels at both metabolomics and transcriptomics levels.
2 MATERIALS AND METHODS
2.1 Peel materials
The fruits of Z. bungeanum were divided into four developmental stages from green to complete red according to the maturity of the fruits. The colors of Z. bungeanum peels at those four stages, including the non-discoloration period, early discoloration period, mid-discoloration period and complete discoloration period, are significantly different. HCWC (Hancheng stingless), a well-known Z. bungeanum variety, has high market acceptance and economic value for its large-grained fruits with thick flesh and bright colors. Based on its high quality and yield, the peels of HCWC at four developmental stages were selected for pigment dynamic analysis. FXDHP (Fengxian Dahongpao), was regarded as the most representative variety in previous studies and most of the existing experimental conclusions about Z. bungeanum were obtained from it. Therefore, the peels at complete discoloration period of HCWC and FXDHP were selected as metabolite detection test samples. All HCWC and FXDHP samples were obtained from the Experimental Demonstration Station of the Northwest A&F University in Yangling (34°56′24″ N, 108°4′28″ E), Shaanxi Province, China.
Nine Z. bungeanum varieties were selected for further peel pigment compounds detection, including DCWC (Dangcun stingless), FG (Fugu), FXDHP, GLWC (Gelao stingless), HCDHP (Hangcheng Dahongpao), HCSZT (Hancheng Shizitou), HCWC, WDDHP (Wudu Dahongpao) and XNWC (Xinong stingless). These widely recognized varieties, included early maturing and late maturing varieties. The samples of the nine Z. bungeanum varieties at the complete discoloration period were all collected form Experimental Demonstration Station in Fengxian (33°59′61″ N, 106°39′28″ E), Shaanxi Province, China. All samples were quickly frozen in liquid nitrogen after collection and stored at −80°C for long-term storage.
2.2 Determination of total flavonoid and phenol contents
The total flavonoid content in Z. bungeanum peels was measured according to the method of Zhang (2014), while the content of total phenol was measured according to the method of He (2015). The Z. bungeanum peels were freeze-dried and ground to a powder. 0.1 g powder was dissolved in 5.0 ml CH3OH and extracted for 24 h under dark conditions at 4°C. The extracted solution was filtered through a 0.22 μm membrane and diluted five times with CH3OH.
2.3 Determination of total anthocyanin, chlorophyll and carotenoid contents
2.4 Qualitative and quantitative analyses of individual metabolites
0.1 g freeze-dried peel powder was dissolved in 1.0 ml 70% CH3OH and extracted for 24 h at 4°C. The extracted solution was centrifuged for 10 min and the supernatant was filtered through a 0.22 μm membrane. It was stored in brown bottles for following HPLC-MS/MS analysis. Each sample was set up with three biological replicates. The metabolic components were detected with a C18 column (2.1 mm × 100 mm, 1.8 μm) with H2O as the mobile phase A and acetonitrile as the mobile phase B. 0.04% CH3COOH was added to both mobile phases A and B to stabilize the metabolites. Gradient elution was carried out at a column temperature of 40°C and the eluent flow rate was 0.8 ml min−1. The elution program was set to the following: at the beginning, mobile phase A is 90% and mobile phases B is 10%; at 0 to 5 min, mobile phase B increased from 10% to 15%; at 5 to 30 min, mobile phase B increased from 15% to 18%; at 30 to 45 min, mobile phase B increased from 18% to 30%; at 45 to 50 min, mobile phase B increased from 30% to 40%, at 50 to 55 min, mobile phase B increased from 40% to 100% and then was maintained for 5 min. The quantitative analysis of each compound was calculated based on the relative peak area. The relative peak areas were obtained by the Analyst 1.6.3 software.
The identification of metabolites was carried out through the support of the MetWare Company. Interference signals such as large molecular debris, ion signals and isotope signals were removed during the analysis. The metabolites were identified by comparing the MS/MS map of each one with the MetWare metabolic database. The results were verified in multiple databases to ensure the accuracy of the identification, including MassBank, KNAPSAcK, HMDB, and METLIN (Zhu et al., 2013). HPLC fingerprints of peels of nine Z. bungeanum varieties were generated by the Chinese Medicine Chromatographic Fingerprint Evaluation System. The characteristic peaks and similarities of fingerprint data were identified based on retention time and peak area.
2.5 RNA-seq analysis and annotation
RNA extraction of Z. bungeanum peels was done by using the Plant Tissue Total RNA extraction kit (TaKaRa). The concentration and purity of the extracted RNA were tested by the spectrophotometer (Thermo Scientific NanoDrop One). The cDNA library was synthesized by using the NEB Next Ultra RNA library preparation kit (NEB). The raw reads were processed to delete the redundant parts and the low-quality parts to obtain clean reads. The Q20, Q30, the content of GC and sequence repetition rate of clean reads were evaluated to ensure high quality. All the clean reads obtained from Z. bungeanum peels were used to combine into a single RNA-seq dataset composed of Unigenes with the help of the Trinity software (Version 2.5.1). The Unigenes were compared to the NR, KOG, COG, eggNOG, KEGG, GO, and Swiss-Prot databases using BLAST with e ≤ 10−5. Meanwhile, the predicted amino acid sequences of the identified Unigenes were compared with the Pfam database using HMMER (Version 3.2.1) with e ≤ 10−10. The expression level of the Unigenes were expressed by FPKM and the p value was controlled by the Benjamini method to reduce the error detection rate. Genes with fold change ≥1.50 and p ≤ 0.05 were identified as differentially expressed and annotated in the KEGG and GO database.
2.6 Real-time fluorescence quantitative PCR analysis
RNA samples from Z. bungeanum peels were extracted with an RNA extraction kit (Takara) and the extraction method aimed at plant tissues with high polyphenol content (Protocol-II) was selected and followed strictly. RNA was reverse-transcribed into cDNA using the UEIris RT kit (US EVERBRIGHT). QRT-PCR was performed with the CW0957M kit on the STEP ONEPLUS PCR instrument. The primers were designed by the Oligo software (Version 6.44; Table S1). The reaction mixture in a total volume of 50 μl consisted of 25 μl of 2 × UltraSYBR Mixture, 1 μl of each specific primer, 2 μl of cDNA and 21 μl of ddH2O. The relative gene expressions were calculated by the 2−ΔΔCt method. The reference gene was the housekeeping gene UBQ (Fei et al., 2018). The reaction procedure was 95°C for 10 min, followed by 40 cycles at 95°C for 15 s and 56°C for 60 s. All samples were repeated with three technical replicates.
2.7 Protein induced expression analysis
The CDS sequences of the key genes ZbDFR, ZbANS, and ZbUFGT were obtained by transcriptional sequencing analysis and the complete amino acid coding regions were selected as the target gene sequence by the ORF Finder program. DNAMAN (Version 7.0.) was used to analyze the restriction sites and design the primers (Table S2). KpnI and BamHI were selected as the restriction enzyme sites. The amplified products were recovered by the Biospin Gel Extraction Kit (BioFlux). The fusion vectors pET-30a(+)-ZbDFR, pET-30a(+)-ZbANS, and pET-30a(+)-ZbUFGT were cloned with the NovoRec Plus STEP PCR cloning kit. The fusion vectors were transfected into E. coli DH5α competent cells for amplification and the screened plasmids were then transfected into E. coli BL21 competent cells for recombinant protein expression. The bacterial solution was induced with 0.8 mmol l−1 IPTG and was cultured at 20°C. The bacterial solution was cultured at 100 g to maintain suspension. The bacterial solution was collected after culturing at 0, 3, 6, 9, 12, 15, and 18 h for gel electrophoresis detection. The solution was resuspended with PBS buffer to maintain cell stability. SDS-PAGE was used to detect protein expressions after different induction times. After staining with Coomassie brilliant blue, the highly expressed proteins showed more prominent bands.
2.8 Transient gene overexpression assay in Z. bungeanum leaves
To overexpress ZbDFR, the ORF of ZbDFR was cloned into the pCAMBIA2300 vector to obtain 35S-pCAMBIA2300-ZbDFR. The 35S-pCAMBIA2300-ZbDFR vectors were transfected into Agrobacterium tumefaciens GV3101 for plant infection. The transgenic bacterial solution was transferred to LB liquid medium (containing kanamycin and rifampicin) and incubated until OD600 = 1.2. The transgenic bacterial solution was centrifuged at 6000 g at 18°C for 10 min and the collected cells were resuspended in resuspension solution (each 1 l LB liquid medium contained 40 ml 250 mM MES, 100 μl 10 mM MgCl2, and 3 ml 50 mM AS) until OD600 = 0.6 (Zhai et al., 2019). After injection of the bacterial solution containing the 35S-pCAMBIA2300-ZbDFR into the leaves, the Z. bungeanum leaves were placed in a light incubator for 24 h at 10°C in darkness, followed by UV-B light induction for 18 h at 24°C to promote ZbDFR expression (Zhou et al., 2022). The infected leaves were used to detect ZbDFR expression and total anthocyanin content.
2.9 Stable overexpression assay in N. benthamiana plants
The preparation of the 35S-pCAMBIA2300-ZbDFR bacterial solution was the same as that for the transient transformation. The resuspension solution was changed to MS liquid medium (each 1 l contained 50 mM AS). N. benthamiana leaves growing vigorously in aseptic bottles were selected as infection objects. After the injection of the bacterial solution containing 35S-pCAMBIA2300-ZbDFR into the leaves, the leaves were placed on solid MS medium containing 6-BA and NAA for 3 days at 24°C in darkness. After dark treatment, the leaves were washed twice by ddH2O containing cephalosporin and carbenicillin and twice with ddH2O to remove excess bacterial solution. After cleaning, the leaves were placed on solid MS medium containing 6-BA, carbenicillin and hygromycin and the medium was changed every 7 days until adventitious buds appeared. The adventitious buds were transferred to 1/2 MS solid medium containing IBA, carbenicillin and kanamycin for root growing. NbUBQ was selected as the reference gene (Table S3).
2.10 Statistical analysis
HCA and PCA were performed using the software R. OPLS-DA was performed by SIMCA (Version 14.1) and significance analysis was performed by SPSS (Version 25). Bar graphs were plotted in OriginPro 2022.
3 RESULTS
3.1 Contents of four types of pigments in HCWC peels at four developmental stages
The peel of the HCWC variety was selected as research object and the development process of its transformation from green to complete red was divided into four stages according to its color (Figure 1A). In the non-discoloration period, the peel was completely green. In the early discoloration period, the peel began to reveal its red color and the fruit size increased compared to the previous stage. In the mid-discoloration period, the main part of peel appeared red with a bit of green and the fruit size remained unchanged. In the complete discoloration period, the peel showed a brilliant red color and indicated the most desirable target for harvesting.
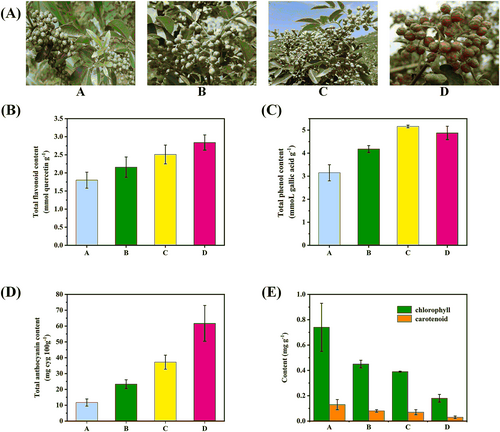
It could be found that during the process, the content of total flavonoids increased gradually, ending up with 2.84 mmol g−1, almost twice than that in the non-discoloration period (Figure 1B). While the content of total phenols showed a slight decrease in the last period from 5.26 mg g−1 to 4.88 mmol g−1 (Figure 1C). The content of total anthocyanins showed the largest increase from 11.71 to 61.72 mg g−1 (Figure 1D), almost 6-fold. Meanwhile chlorophylls and carotenoids decreased significantly with finally both fewer than 0.2 mg g−1 (Figure 1E). The content changes of the four pigment types were consistent with the visual evaluation. The results showed that flavonoids play a key role during the coloring process of Z. bungeanum peels.
3.2 Targeted flavonoids metabolomic analysis
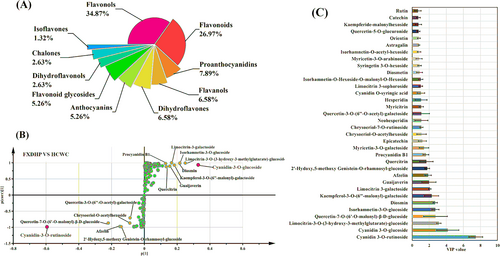
Based on the results that flavonoids dominated the coloring process of Z. bungeanum peels, the targeted metabolomics analysis of Z. bungeanum peel pigment compounds were focused on flavonoids. Mature peels of FXDHP and HCWC were selected as research objects. A total of 152 compounds were identified by targeted metabolomic detection, which mainly existed in the form of glycosides, including 53 flavonols, 41 flavonoids, 12 proanthocyanidins, 10 flavanols, 10 dihydroflavones, eight anthocyanins, eight flavonoid glycosides, four dihydroflavonols, four chalones, and two isoflavones (Table S4, Figure 2A). The content of each compound was measured by HPLC-MS/MS peak area.
The content of total anthocyanins was the highest among all the identified substances. A total of eight anthocyanins were identified, including cyanidin-3-O-glucoside, cyanidin-3-O-rutinoside, pelargonidin-3,5-O-diglucoside, cyanidin-O-syringic acid, peonidin-3-O-glucoside, delphinidin-acetyl glucose, pelargonidin-O-rutinoside and cyanidin-3,5-O-diglucoside. In HCWC peels, the content of cyanidin-3-O-glucoside was the highest among the eight anthocyanins, accounting for 58.48% of the total. It was obvious that the contents of cyanidin-3-O-glucoside and cyanidin-3-O-rutinoside were significantly higher than that of other substances and the same conclusion could be found in FXDHP peels (Table S4). The contents of some flavonols, such as quercitrin, hyperoside, and isoquercitrin, also showed a higher level, but much lower than the two main anthocyanins. It was preliminarily determined that the key red pigment compounds in Z. bungeanum peel were cyanidin-3-O-glucoside and cyanidin-3-O-rutinoside.
3.3 Characteristics of key pigment compounds
3.3.1 OPLS-DA model
The differential metabolites of the two varieties FXDHP and HCWC were obtained by variable importance value (VIP) based on a least partial square discriminant analysis (OPLS-DA) model. The S-plot curve showed that cyanidin-3-O-rutinoside and cyanidin-3-O-glucoside were considered to be the key compounds (Figure 2B). Based on OPLS-DA, a total of 34 compounds were selected with VIP values larger than 0.65 (Figure 2C). Cyanidin-3-O-rutinoside with VIP = 7.46 and cyanidin-3-O-glucoside with VIP = 4.17 were the compounds that contributed the most to the color difference, indicating that they were the key compounds that caused the difference of peel color between the two varieties. In addition, the study showed that the main flavonoid compounds in Z. bungeanum peels, such as hyperoside, quercitrin, catechin, epicatechin, afzelin, rutin, hesperidin, diosmin, trifolin, quercetin, isoquercitrin, and myricitrin, also had high relative contents and VIP values in the results of metabolite analysis and could be regarded as primary identification compounds. However, their influence on Z. bungeanum peel color was far less than cyanidin-3-O-glucoside and cyanidin-3-O-rutinoside.
3.4 KEGG annotation
KEGG annotation was performed on the compounds detected in the metabolomic analysis and a total of 33 compounds were annotated into three key synthetic pathways: the flavonoid biosynthesis pathway, the flavanone and flavonol biosynthesis pathway and the anthocyanin biosynthesis pathway. Due to the limitations of the metabolic networks in the KEGG database, a small percentage of metabolites were not annotated to any metabolic pathway. The detected flavonoids and anthocyanins were all related to the annotated metabolic pathways. It was confirmed that these three pathways were key metabolic pathways in the intracellular synthesis of flavonoids and anthocyanins in Z. bungeanum peels.
Comprehensive analysis showed that the key pigment compounds of FXDHP and HCWC peels were cyanidin-3-O-rutinoside and cyanidin-3-O-glucoside, meanwhile 12 main flavonoids also influenced the peel color to some extent.
3.5 Verification of key pigment compounds in nine Z. Bungeanum varieties
3.5.1 Contents of key pigment compounds
Focusing on cyanidin-3-O-rutinoside and cyanidin-3-O-glucoside, and the other 12 main flavonoids, HPLC was used to analyze the peel pigment compounds of nine Z. bungeanum varieties (Table 1). In all samples, the content of cyanidin-3-O-rutinoside (2.11 ± 0.43 mg g−1 to 14.18 ± 1.18 mg g−1) and the content of cyanidin-3-O-glucoside (0.89 ± 0.02 mg g−1 to 1.38 ± 0.05 mg g−1) were the highest and there were significant differences among the varieties. The highest content of cyanidin-3-O-rutinoside could be found in FXDHP while that of cyanidin-3-O-glucoside was in HCWC. The lowest contents of both anthocyanins could be found in FG which showed a lighter red compared to the other varieties. Therefore, cyanidin-3-O-rutinoside and cyanidin-3-O-glucoside had been proven to be the key pigment compounds for the red color of Z. bungeanum peels in several varieties, making the screening of key pigment compounds more universal and persuasive.
| Compound | Content in variety (mg g−1) | ||||||||
|---|---|---|---|---|---|---|---|---|---|
| HCSZT | FG | XNWC | GLWC | DCWC | FXDHP | WDDHP | HCDHP | HCWC | |
| Cyr | 7.97 ± 0.01e | 2.11 ± 0.43g | 8.8 ± 0.13e | 11.92 ± 0.15b | 9.20 ± 0.25de | 14.18 ± 1.18a | 10.22 ± 0.41cd | 5.74 ± 0.3f | 11.49 ± 1.04bc |
| Cyg | 1.16 ± 0.06ac | 0.89 ± 0.02c | 1.15 ± 0.06ac | 1.38 ± 0.05a | 1.19 ± 0.15ab | 1.19 ± 0.19ab | 1.00 ± 0.03cb | 1.28 ± 0.05ab | 1.31 ± 0.35a |
| Catechin | 1.42 ± 0.88cd | 0.58 ± 0.02d | 3.17 ± 0.00b | 5.99 ± 3.28ac | 4.98 ± 3.49bd | 3.69 ± 0.31bd | 2.19 ± 0.74cd | 10.88 ± 2.66a | 3.18 ± 0.74b |
| Epicatechin | 8.06 ± 1.19ce | 12.69 ± 0.35b | 9.96 ± 0.36cd | 9.72 ± 0.24cd | 8.96 ± 1.7cd | 7.38 ± 1.39ce | 6.27 ± 0.38e | 17.58 ± 0.82a | 10.86 ± 2.84bc |
| Rutin | 4.51 ± 0.90bc | 0.02 ± 0.00e | 4.61 ± 0.23bc | 10.85 ± 0.97a | 9.4 ± 1.41a | 1.74 ± 0.71de | 3.12 ± 0.10cd | 5.30 ± 0.11b | 6.07 ± 2.26b |
| Myricitrin | 1.62 ± 0.07de | 1.16 ± 0.04f | 1.70 ± 0.02de | 2.32 ± 0.1b | 2.23 ± 0.14bc | 2.82 ± 0.57a | 1.92 ± 0.17bd | 1.83 ± 0.02c | 1.32 ± 0.21ef |
| Hyperoside | 7.51 ± 1.18ab | 2.52 ± 0.17d | 3.67 ± 0.08cd | 5.95 ± 0.34bc | 10.28 ± 3.17a | 8.05 ± 2.47ab | 3.67 ± 0.63cd | 4.62 ± 0.19cd | 7.85 ± 1.35ab |
| Isoquercitrin | 0.65 ± 0.17bc | 0.48 ± 0.01c | 0.57 ± 0.03bc | 1.04 ± 0.09b | 1.05 ± 0.22b | 1.63 ± 0.55a | 0.63 ± 0.02bc | 0.87 ± 0.03bc | 1.03 ± 0.46b |
| Trifolin | 2.13 ± 0.28ab | 1.70 ± 0.18bc | 1.66 ± 0.11bd | 2.36 ± 0.15ab | 3.30 ± 0.46a | 0.43 ± 0.31cd | 0.44 ± 0.21cd | 0.18 ± 0.18d | 2.94 ± 2.12ab |
| Quercitrin | 1.20 ± 0.04cd | ND | 1.14 ± 0.01ce | 1.03 ± 0.02de | 1.22 ± 0.08c | 1.46 ± 0.17b | 0.98 ± 0.12e | 2.47 ± 0.11a | 1.22 ± 0.06c |
| Diosmin | 1.93 ± 0.25ab | 1.85 ± 0.09ab | 1.58 ± 0.09b | 2.44 ± 0.22a | 2.58 ± 0.56a | 0.45 ± 0.22c | 0.34 ± 0.07c | 0.37 ± 0.08c | 2.32 ± 0.91ab |
| Hesperidin | 0.98 ± 0.10bd | 0.13 ± 0.01d | 1.07 ± 0.04ad | 0.92 ± 0.26bd | 1.66 ± 1.26ab | 1.06 ± 0.27ad | 0.17 ± 0.01cd | 2.04 ± 0.07a | 1.70 ± 0.30a |
| Afzelin | 1.05 ± 0.10bd | 0.54 ± 0.02d | 1.15 ± 0.17ac | 1.70 ± 0.13a | 1.39 ± 0.07ab | 1.51 ± 0.33ab | 0.83 ± 0.12cd | 1.02 ± 0.08bd | 1.30 ± 0.70ac |
| Quercetin | ND | 0.16 ± 0.01d | 0.58 ± 0.13b | 1.16 ± 0.11a | 0.23 ± 0.01c | 0.31 ± 0.01c | ND | ND | 0.60 ± 0.20b |
- Note: Compound content is represented with the average value and standard deviation. Multiple comparisons were used to analyze the significance of the content index of the same compound. p < 0.05 was considered as a significant difference. Significance of difference was indicated by superscript letters and the same letters indicate insignificant differences.
- Abbreviations: Cyg, cyanidin-3-O-glucoside, Cyr, cyanidin-3-O-rutinoside; ND, not detected.
Among the 12 main flavonoids, epicatechin (6.27 ± 0.38 mg g−1 to 17.58 ± 0.82 mg g−1) and hyperoside (2.52 ± 0.17 mg g−1 to 10.28 ± 3.17 mg g−1) had the highest contents while quercetin had the lowest which was not even detected in three varieties (HCSZT, WDDHP, HCDHP). The content of diosmin in Dahongpao varieties (FXDHP, WDDHP, HCDHP) was much lower than that in other varieties. Within the same variety, there were also significant differences between the content of different compounds. For example, in DCWC, hyperoside with the highest content was as much as 40 times than that of quercetin with the lowest. The color of Z. bungeanum peels was determined by the ratio of the main flavonoids.
3.6 HPLC fingerprints
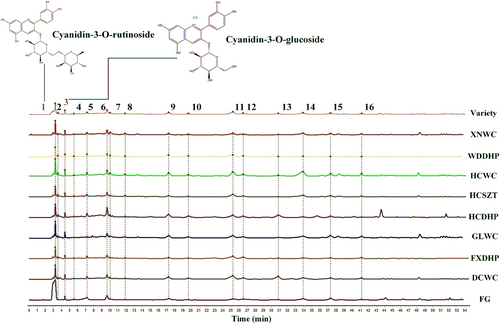
The fingerprints of nine varieties were constructed according to the HPLC results and 16 common peaks were identified (Figure 3). Among them, peak 1 was cyanidin-3-O-rutinoside and peak 3 was cyanidin-3-O-glucoside. Peak 6, 9, 10, 11, 12, 14, 15, and 16 were epicatechin, rutin, myricitrin, hyperoside, isoquercitrin, quercitrin, diosmin, and trifolin, respectively. The identified common peaks all belong to key pigment compounds that affected the color of Z. bungeanum peels, which further demonstrated the accuracy of the key compounds screening. Fingerprint similarity analysis showed that the similarity of all varieties ranged from 0.607 to 0.966 (Table 2). FG and HCDHP showed the lowest correlation values with other varieties and their peels differed conspicuously from other varieties in color which might be closely related to their low contents of anthocyanins.
| FG | DCWC | FXDHP | GLWC | HCDHP | HCSZT | HCWC | WDDHP | XNWC | |
|---|---|---|---|---|---|---|---|---|---|
| FG | 1 | ||||||||
| DCWC | 0.693 | 1 | |||||||
| FXDHP | 0.674 | 0.809 | 1 | ||||||
| GLWC | 0.695 | 0.773 | 0.812 | 1 | |||||
| HCDHP | 0.607 | 0.687 | 0.673 | 0.747 | 1 | ||||
| HCSZT | 0.652 | 0.765 | 0.831 | 0.933 | 0.712 | 1 | |||
| HCWC | 0.671 | 0.728 | 0.766 | 0.957 | 0.74 | 0.961 | 1 | ||
| WDDHP | 0.669 | 0.835 | 0.913 | 0.812 | 0.715 | 0.778 | 0.737 | 1 | |
| XNWC | 0.693 | 0.716 | 0.777 | 0.966 | 0.737 | 0.924 | 0.955 | 0.761 | 1 |
3.7 Chemometrics analysis of HPLC fingerprints
The results of HCA analyses showed that nine varieties could be grouped into three categories when the mapping distance was adjusted to 20 (Figure 4A). Seven varieties belonged to group I (HCSZT, XNWC, WDDHP, FXDHP, GLWC, DCWC, and HCWC), while HCDHP and FG belonged to group II and III, respectively. Chemometrics analysis showed the same classification conclusion with fingerprint similarity analysis. The composition and content of pigments in three groups were significantly different and these differences further led to the difference in the color appearance of Z. bungeanum peels. In group I, all samples showed a prominent red with small differences. In group II, HCDHP showed a much lighter red than the varieties in group I. In group III, FG showed the lightest red among all the three groups.
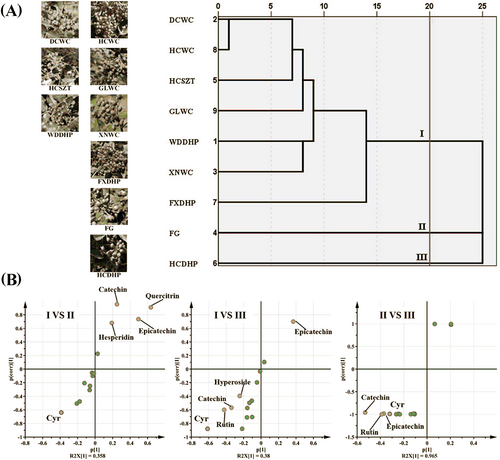
In order to further determine the contribution of pigment compounds, OPLS-DA of HPLC results was performed according to the three groups (Figure 4B). Between group I and II, cyanidin-3-O-rutinoside, quercitrin, epicatechin, catechin and hesperidin were the compounds with the significant difference in content and their VIP values were larger than 1. Between group II and III, the differential compounds were cyanidin-3-O-rutinoside, rutin, hyperoside, catechin, and epicatechin. Between group I and III, the differential compounds were cyanidin-3-O-rutinoside, rutin, catechin, and epicatechin. Therefore, mainly anthocyanin and flavonoid jointly determine the color of Z. bungeanum peels, among which cyanidin-3-O-rutinoside showed the greatest influence. The other six flavonoids (quercitrin, hyperoside, hesperidin, catechin, rutin, and epicatechin) also made important contributions.
3.8 Transcriptomic analysis of differentially expressed genes related to key pigment compounds
To further explore the molecular mechanisms of key pigment compounds in Z. bungeanum peels, a total of 90.36 Gb of valid data was obtained by sequencing cDNA libraries of Z. bungeanum peel samples at four developmental stages. The Q30 value of each sample was higher than 92.88% and the GC content of each sample was between 44.80% and 47.55%. A total of 51,027 annotated Unigenes were searched in databases like COG (13 204), GO (31 595), KEGG (17 555), KOG (25 059), Pfam (26,975), Swiss-Prot (28 565), eggNOG (44186), and NR (49 548; Table S5), accounting for 46.11% of all assembled genes. These results indicated that the assembly integrity was high and the sequencing quality met the requirements for further analysis.
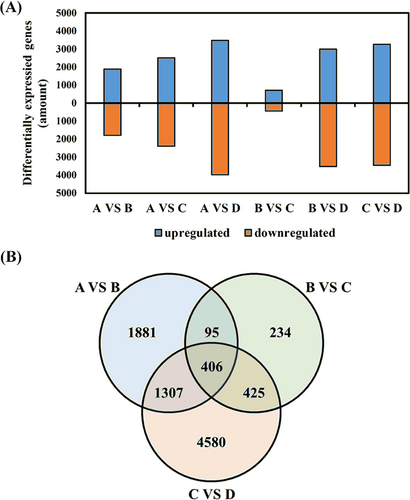
According to FPKM values, the differentially expressed genes of Z. bungeanum peels at four developmental stages were analyzed and a total of 12,424 genes were selected. The four developmental stages were compared in pairs (A vs. B, A vs. C, A vs. D, B vs. C, B vs. D, and C vs. D) and the six comparisons had 3218, 4129, 6606, 902, 5926, and 5926 differentially expressed genes, respectively: 1889, 2506, 3487, 718, 3007, and 3271 upregulated and 1800, 2394, 3985, 442, 3520, and 3447 downregulated (Figure 5A). Venn diagram analysis showed there were 406 common differentially expressed genes among the four developmental stages (Figure 5B). The differential genes obtained from group comparisons were annotated into eight databases, which was helpful to explore the function of each gene (Table 3).
| Group | Gene number | COG | GO | KEGG | KOG | Pfam | SwissProt | eggNOG | NR |
|---|---|---|---|---|---|---|---|---|---|
| A vs. B | 3218 | 1215 | 2082 | 1182 | 1627 | 2532 | 2514 | 3064 | 3211 |
| A vs. C | 4129 | 1562 | 2661 | 1591 | 2174 | 3224 | 3185 | 3909 | 4115 |
| A vs. D | 6606 | 2405 | 4261 | 2596 | 3463 | 4996 | 5118 | 6290 | 6574 |
| B vs. C | 902 | 361 | 584 | 356 | 468 | 684 | 693 | 843 | 898 |
| B vs. D | 5926 | 2255 | 3862 | 2314 | 3047 | 4470 | 4627 | 5596 | 5899 |
| C vs. D | 5926 | 2235 | 3796 | 2270 | 3091 | 4505 | 4593 | 5600 | 5899 |
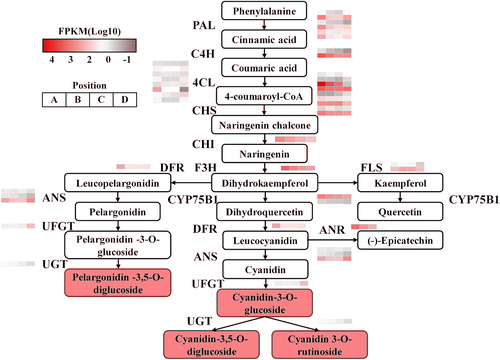
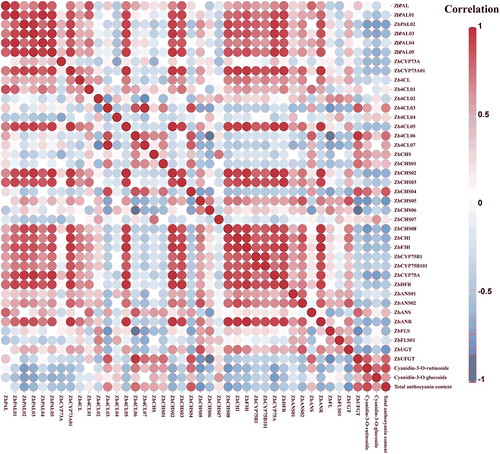
Based on the KEGG database, 39 of all differentially expressed genes in six groups were annotated to the anthocyanin biosynthesis pathway. According to the clustering heat map, the gene expression levels of the 39 differentially genes showed the greatest difference between the non-discoloration period and the complete discoloration period, which proved that the change of gene expression levels affected the Z. bungeanum peels color (Figure 6). The expression levels of the genes ZbANS and ZbUFGT in the anthocyanin biosynthesis pathway kept an upward trend and reached the maximum expression at the final complete discoloration period. Further compound correlation analysis showed that the expression levels of ZbANS and ZbUFGT were significantly positively correlated with the contents of cyanidin-3-O-rutinoside and cyanidin-3-O-glucoside, indicating that both of them were key structural genes in the process of anthocyanin biosynthesis (Figure 7). In addition, DFR, which catalyzes the production of colorless anthocyanin, played an important role in anthocyanin synthesis. ZbDFR maintained a high expression level at all four stages and was strongly correlated with the remaining differentially expressed genes in the anthocyanin pathway. Therefore, ZbDFR, ZbANS and ZbUFGT were identified as the key genes for anthocyanin synthesis in Z. bungeanum peels.
3.9 QRT-PCR validation of the transcriptomic data
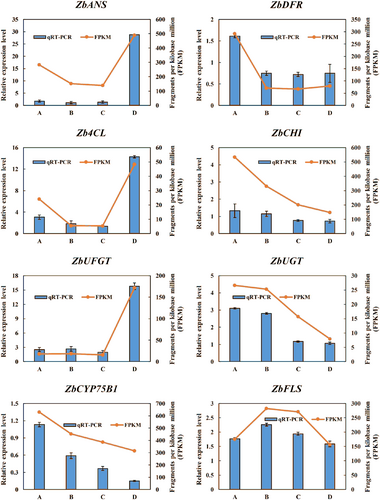
To verify the credibility of the transcriptomic data, the key genes ZbDFR, ZbANS, ZbUFGT and five genes related to anthocyanin synthesis (Zb4CL, ZbCHI, ZbUGT, ZbCYP75B1, ZbFLS) were selected for validation by qRT-PCR. The trends of expression levels of the eight genes were consistent with the transcriptomic analysis results, which proved the accuracy and reliability of the transcriptomic analysis (Figure 8).
3.10 Protein induced expression of ZbDFR, ZbANS, and ZbUFGT
Using the kit method to extract RNA form Z. bungeanum peels, the concentration of RNA was 557.5 ng μl−1, OD260/280 = 2.17 and OD260/230 = 2.17, indicating that the impurity in RNA was less and met the requirements of subsequent tests. Three genes, ZbDFR, ZbANS, and ZbUFGT were amplified by high fidelity enzyme. The ORF (open reading frame) of ZbDFR was 1017 bp, ZbANS was 1074 bp and ZbUFGT was 1404 bp. There were only distinct bands between 1000 and 2000 bp, indicating the specificity of the amplification (Figure 9A).

The protein induced expression of ZbDFR, ZbANS, and ZbUFGT were verified by SDS-PAGE detection. The proteins of ZbDFR, ZbANS, and ZbUFGT were all induced by IPTG. The protein bands of ZbDFR and ZbANS were in the range of 40–50 kDa and the protein band of ZbUFGT was in the range of 50–70 kDa, which were all similar to the theoretical values predicted based on the online software ProtParam. The accuracy of the cloned gene sequences was confirmed from the perspective of protein band sizes. The accuracy of the selection of the ORF regions was also proven. The protein bands of ZbANS and ZbUFGT were most pronounced at 12 h after induction, while ZbDFR was highest expressed at 15 h (Figure 9B). These results demonstrated that ZbDFR, ZbANS and ZbUFGT were all expressed as fusion proteins.
3.11 Transient overexpression analysis of ZbDFR in Z. bungeanum leaves
In the anthocyanin synthesis pathway, the upstream key gene, DFR, could catalyze the conversion of dihydrokaempferol to unmodified leucocyanidin, which was the key precursor for subsequent anthocyanin synthesis. Zhao et al. (2022) confirmed that ZbDFR was a node at which flavonoids regulated the synthesis of anthocyanins and proanthocyanins. The expression level of DFR also affected the expression of subsequent key genes like ANS and UFGT. Therefore, the verification of ZbDFR in in the color transformation of Z. bungeanum peels was particularly important.
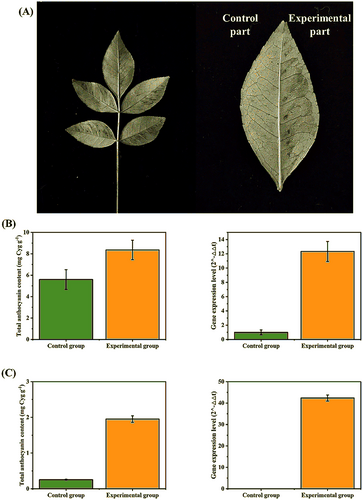
Transient ZbDFR overexpression was performed through infecting Z. bungeanum leaves with Agrobacterium tumefaciens containing 35S-pCAMBIA2300-ZbDFR as the experimental group. The untreated leaves were regarded as the control group. After infection, all leaves were cultured in dark for 24 h followed by UV-B irradiation for 18 h. Wet gauze was used to keep the leaves from wilting. The leaves overexpressing ZbDFR turned into a reddish-brown color, while the control group showed almost no change (Figure 10A). In addition to appearance differences, quantitative analysis showed that the total anthocyanin content in the overexpression leaves was significantly higher than that in the control leaves with a 1.49-fold difference (Figure 10B). At the molecular level, PCR verified the presence of the target gene ZbDFR, in the RNA extracted from infected leaves. Further qRT-PCR validation indicated that the expression level of ZbDFR was also significantly increased compared to the control group with a 12.32-fold difference (Figure 10B). ZbUBQ was selected as the reference gene. These results suggested that the overexpression of ZbDFR could promote anthocyanin synthesis and accumulation, leading to the difference of Z. bungeanum peel color.
3.12 Stable overexpression analysis of ZbDFR in N. benthamiana
Stable ZbDFR overexpression was performed through infecting N. benthamiana with Agrobacterium tumefaciens containing 35S-pCAMBIA2300-ZbDFR as the experimental group. The redifferentiation tissue-culture seedlings of untreated N. benthamiana were treated as the control group and their leaves were almost identical in appearance to those grown from seeds. All tissue-culture seedlings showed a healthy green. When the adventitious buds of infected leaves differentiated into roots and leaves on 1/2 MS solid medium, total anthocyanin contents and expression levels of ZbDFR were measured. The redifferentiation tissue-culture seedlings of infected leaves were a lighter shade of green than those of untreated leaves. It may be due to the interaction between the accumulation of different pigment compounds like chlorophylls and carotenoids. The initial total anthocyanin content in untreated N. benthamiana leaves (0.25 mg g−1) was much lower than that in untreated Z. bungeanum leaves (5.60 mg g−1), but the increment in N. benthamiana leaves was more obvious due to stable ZbDFR overexpression with a 7.67-fold difference compared to the normal N. benthamiana leaves (Figure 10C). Meanwhile, the expression level of ZbDFR showed the same increase as total anthocyanin content in both Z. bungeanum and N. benthamiana leaves. In infected N. benthamiana leaves, there was a 42.37-fold difference in the expression level of ZbDFR compared with control group (Figure 10C). These more stable and significant results further verified that the overexpression of ZbDFR could promote anthocyanin synthesis and accumulation.
4 DISCUSSION
4.1 Key pigment compounds in Z. bungeanum peel
Peel color is one of the main indexes affecting the judgment of fruit quality. Similar to many other fruits, the color of Z. bungeanum peels was significantly affected by anthocyanin biosynthesis. Up to now, over 700 anthocyanins have been discovered (Bueno et al., 2012), among which pelargonidin, cyanidin and delphinidin are the most common pigments in vascular plants and anthocyanin accumulations significantly affect fruit color, exhibiting a range of intermediate colors during development progress (Clifford, 2000). In most fruits the content of cyanidin is the highest, reaching over 50% in some species, while the lowest is malvidin, which accounts for about 7% (Kong et al., 2003). Under natural conditions, anthocyanins are rare in their free state and usually bind to glucose and galactose through glycosidic bonds (Cai et al., 2022).
In this study, two anthocyanins, cyanidin-3-O-rutinoside and cyanidin-3-O-glucoside, and 12 flavonoids were identified as the most critical compounds in Z. bungeanum peels. The different composition ratios of key pigment compounds determined the color of Z. bungeanum peels. During the four developmental stages, the accumulation of total anthocyanins in Z. bungeanum peels has been increasing with fruit ripening. The same conclusion had been confirmed in several other species. In most fruits, such as Vaccinium spp. (Alejandro et al., 2008), Fragaria ananassa (Pombo et al., 2011), and Malus pumila (Dar et al., 2019), anthocyanins have their maximum and darkest color at full maturity. The 14 pigment compounds which were identified here were also verified in nine varieties. The clustering results of the nine Z. bungeanum varieties verified by HPLC fingerprints in this study were consistent with the contents of the key pigment compounds. The absence of quercitrin occurred only in FG (group III), while the absence of quercetin occurred in four varieties (HCSZT, FXDHP, WDDHP, and HCDHP). The varieties in group I, such as FXDHP, HCWC, and GLWC, showed a much brighter red color with higher levels of cyanidin-3-O-rutinoside and cyanidin-3-O-glucoside. Varieties in group II and III, such as FG and HCDHP, remained a hint of pale green with higher levels of epicatechin and lower levels of cyanidin-3-O-rutinoside. The fingerprint similarity analysis was consistent with the content differences of pigment compounds. The lowest similarity values all occurred between FG (group III) and other varieties (group I and II). The OPLS-DA results of different groups were similar to those of HCWC and FXDHP. Cyanidin-3-O-rutinoside, which kept a high VIP value, contributed significantly to the difference between all three groups. In addition, catechin and epicatechin also showed high VIP values between all three groups. All results fully proved the accuracy of the screening of key pigment compounds in Z. bungeanum peels.
Cyanidin-3-O-rutinoside and cyanidin-3-O-glucoside are also widely recognized as key pigment compounds in many other red fruits. In mulberry, cyanidin-3-O-rutinoside and cyanidin-3-O-glucoside were regarded as the indicative compounds for fruit ripening and inhibiting their degradation could preserve the fruit color (Liang et al., 2022a, b). A study of Rubus occidentalis also proved that cyanidin-3-O-rutinoside and cyanidin-3-O-glucoside were important to fruit color (Dayeon & Eunmi, 2018). In Triticum aestivum, the accumulation of cyanidin-3-O-rutinoside, cyanidin-3-O-glucoside and other anthocyanins gave the seeds a deeper purplish red color and a higher nutritional value (Wang et al., 2022a, b). All these results made the conclusion that cyanidin-3-O-rutinoside and cyanidin-3-O-glucoside were the key pigment compound for Z. bungeanum peels more convincing. Moreover, fruits rich in cyanidin-3-O-rutinoside and cyanidin-3-O-glucoside were mostly purplish red, while Z. bungeanum peels showed a bright red. This might be due to the influence of the other 12 key flavonoids, such as epicatechin.
4.2 Key genes related to anthocyanin biosynthesis in Z. bungeanum peels
Anthocyanin biosynthesis is a branch of the flavonoid metabolic pathway with the early structural genes CHS, CHI, F3H, late anthocyanin biosynthesis genes F3′H, F3′5′H, DFR, ANS, UFGT and a series of transcription factors. Among them, DFR and ANS have been clearly elucidated as key genes in most plants. In many plants that have been studied and reported, DFR and ANS often show higher expressions than other structural genes (Jin et al., 2017; Jochen et al., 2006). Anthocyanin biosynthesis is regulated by numerous environmental and genetic factors and could be significantly promoted by regulating the expression of key genes (Xie et al., 2006).
In this study, ZbDFR, ZbANS, and ZbUFGT were screened out from 39 differentially expressed genes and identified as key genes. The three genes showed high expressions and strong correlations with cyanidin-3-O-rutinoside and cyanidin-3-O-glucoside. Previous studies of other plants have also reached the same conclusion, such as Litchi chinensis (Wei et al., 2011), Malus pumila (Li et al., 2019), Vitis vinifera (Yang et al., 2020), and other species. All three genes were significantly positively correlated with the contents of cyanidin-3-O-rutinoside, cyanidin-3-O-glucoside and total anthocyanins. QRT-PCR results showed that the variation trend of expression levels of eight related genes during the four developmental stages were consistent with the transcriptomic results. QRT-PCR results confirmed the reliability of the transcriptomic data. As the gene involved in the synthesis of anthocyanin precursors, ZbDFR showed high expression in the non-discoloration period. ZbUFGT, the downstream glycosyltransferase gene, showed high expression in the complete discoloration period. ZbANS, another key downstream gene of anthocyanin biosynthesis, also reached the peak expression level in the last developmental stage. The trends of gene expression levels were consistent with the metabolite accumulation. Under the same concentration of IPTG, the optimum inducement time of DFR, ANS, and UFGT proteins was different, which might be related to the physical and chemical properties of each protein.
The function of ZbDFR was verified in both Z. bungeanum and N. benthamiana. All Z. bungeanum and N. benthamiana plants maintained normal growth after transgenic treatment. In the transgenic Z. bungeanum and N. benthamiana plants, both anthocyanin contents and ZbDFR expression were significantly increased compared with untreated plants and heterologous stable transformation showed a more significant difference than homologous transient transformation. The results proved that overexpression of ZbDFR could significantly promote the accumulation of anthocyanins. Similar phenotype had been demonstrated in other plants in previous studies, such as Asparagus officinalis (Liang et al., 2022a, b) and Solanum (Wang et al., 2022a, b). After the overexpression of DFR, the calluses of A. officinalis showed a purplish red and the calluses of Solanum showed a deep purple, which were all the manifestation of a large accumulation of anthocyanins. These results all proved that DFR played an important role in promoting anthocyanin synthesis.
Meanwhile, although both ZbDFR expression and anthocyanin contents showed a remarkable increase, the phenotype of transgenic N. benthamiana leaves in this study was far less obvious than that of peels in other experiments. This might because leaves are not the main organ of anthocyanin accumulation in N. benthamiana and the low expression of other genes in synthesis pathway restricts the amount of anthocyanin synthesis. Although the overexpressed N. benthamiana plants were significantly different from the normal ones, the absolute amount of anthocyanin in N. benthamiana was not high.
5 CONCLUSION
In this study, the analysis of four different types of pigments showed that flavonoids were the main pigments in Z. bungeanum peels. A total of 152 flavonoid compounds were identified from Z. bungeanum peels based on the result of targeted metabolomics, among which two anthocyanins, cyanidin-3-O-rutinoside and cyanidin-3-O-glucoside, and 12 flavonoids were identified as the most critical pigment compounds. Based on transcriptomics, the 14 key pigment compounds were all associated with the anthocyanin metabolic pathway and ZbDFR, ZbANS, and ZbUFGT were identified as three key genes in the pathway. Further functional verification showed that the proteins of these three key genes all could be induced by IPTG. Both homologous transient transformation and heterologous stable transformation confirmed that the overexpression of ZbDFR could promote the accumulation of anthocyanins in Z. bungeanum leaves and N. benthamiana. This study identified the key pigment compounds and their composition in Z. bungeanum peels and their metabolic regulation mechanism was also analyzed. Regarding cyanidin-3-O-rutinoside and cyanidin-3-O-glucoside as the key pigment compounds and ZbDFR, ZbANS, and ZbUFGT as the key genes might provide a theoretical basis for further study on Z. bungeanum peel color.
AUTHOR CONTRIBUTIONS
All authors contributed to the study conception and design. The manuscript was written by Nuan Han. The experiments were performed by Nuan Han, Leiwen Sun, Jie Zhang, and Wei Yuan. The writing-reviewing and editing were performed by Nuan Han, Cheng Wang, Aiguo Zhao, and Dongmei Wang. All authors read and approved the final manuscript.
ACKNOWLEDGMENT
This study was supported by the National Key Research and Development Projects of China (2019YFD1000603) and the Shaanxi Province Key Research and Development Projects (2023-YBNY-148).
CONFLICT OF INTEREST STATEMENT
The authors declare that they have no known competing financial interests or personal relationships that could have appeared to influence the work reported in this article.
Open Research
DATA AVAILABILITY STATEMENT
The data that supports the findings of this study are available in the supplementary material of this article.


