Characterization of chromatin accessibility and gene expression reveal the key genes involved in cotton fiber elongation
Abstract
Cotton (Gossypium hirsutum L.) is an important economic crop, and cotton fiber is one of the longest plant cells, which provides an ideal model for the study of cell elongation and secondary cell wall synthesis. Cotton fiber length is regulated by a variety of transcription factors (TF) and their target genes; however, the mechanism of fiber elongation mediated by transcriptional regulatory networks is still unclear to a large extent. Here, we used a comparative assay for transposase-accessible chromatin with high-throughput sequencing (ATAC-seq) assay and RNA-seq analysis to identify fiber elongation transcription factors and genes using the short-fiber mutant ligon linless-2 (Li2) and wild type (WT). A total of 499 differential target genes were identified and GO analysis shows that differential genes are mainly involved in plant secondary wall synthesis and microtubule-binding processes. Analysis of the genomic regions preferentially accessible (Peak) has identified a number of overrepresented TF-binding motifs, highlighting sets of TFs that are important for cotton fiber development. Using ATAC-seq and RNA-seq data, we have constructed a functional regulatory network of each TF regulatory target gene and also the network pattern of TF regulating differential target genes. Further, to obtain the genes related to fiber length, the differential target genes were combined with FLGWAS data to identify the genes highly related to fiber length. Our work provides new insights into cotton fiber elongation.
1 INTRODUCTION
Cotton is the most important fiber crop in the world with significant economic importance in the textile industry. Due to the ever-growing demand of the textile industry for various applications, it is necessary to understand the developmental mechanism of fiber to improve strength, length, and yield using genetic engineering or molecular breeding. Particularly, there is an urgent need to identify transcription factors involved in fiber development, which may be important factors limiting cotton fiber yield and quality improvement.
Cotton fiber cell development can be divided into four stages: initiation, extension, synthesis of secondary wall, and maturation. After initiation, the fibers are extended at a rate of 2 mm/day and can be extended for 15–20 days (Lee et al., 2007). Fiber elongation is a complex process that involves many metabolic and signaling pathways, such as the ones related to hydrogen peroxide (H2O2) and reactive oxygen species, Ca2+, brassinosteroid, ethylene, water transport, cell wall loosening, and pectin biosynthesis (Patel et al., 2020). In addition, cytoskeletal proteins, such as tubulin, play a key role in fiber elongation (Hammond et al., 2008). It has been shown that yeast cells can grow longitudinally when overexpressed with β-TUBULIN-LIKE cDNA (Li et al., 2003). Therefore, TUBULIN changes will affect cell morphology. After elongation, the secondary cell walls is synthesized, using a large amount of cellulose, leading to cell wall thickening (Kim & Triplett, 2001), which is important for fiber quality (Pang et al., 2010). The initiation and development of fibers last for about 2 months after flowering, and the last step in fiber development is fiber maturation. Fiber development involves massive changes in gene expression and is a complex process; hence the study of fiber development is also very important for discovering important genes. Mutants are very important tools to discover gene function and several fiber developmental mutants were identified in cotton. Among them, ligon lintless-1 (Li1) (Bolton et al., 2009) and ligon lintless-2 (Li2) (Kohel et al., 1992) have been reported as monogenic and dominant, and the lint fiber on the mature seed is extremely shortened (Thyssen et al., 2014, 2015). The Li1 phenotype is caused by a mutation in the ACTIN gene and shows abnormal morphology, including twisted leaves and stems, and extreme reduction in lint fiber to 6 mm at maturity (Thyssen et al., 2017). Li2 mutant plants showed normal vegetative growth but the lint fiber of mature seed was extremely shortened, similar to Li1 fiber. The causal mutation of Li2 is not identified; however, Li2 was proved to be associated with chromosome D13 (Naoumkina et al., 2022; Patel et al., 2020). First, the deletion of 221 kb-176 kb at the end of chromosome D13 in the Li2 mutant resulted in the premature expression of GhIRX7 and the low expression of GhEXPA8, GhETO1, GhUGT87A1, and GhUGT87A2 genes (Patel et al., 2020). However, recent studies have shown that large-scale structural rearrangements have been found at the end of D13 chromosome in Li2 mutants. The rearrangement includes 177 kb deletion and 221 kb repetition, and the repetition is positioned as tandem reverse repetition. The gene Gh_D13G2437 is located at the connection of the reverse repeat sequence in the replication area. The gene can produce self-complementary hairpin RNA during transcription and then produce small interfering RNA. This gene encodes RAN-BINDING PROTEIN 1 (RanBP1) and is preferentially expressed during the elongation of cotton fibers; the Li2 mutant's cotton fiber cells cannot elongate when RanBP1s are silenced by siRNA but fiber initiation is unchanged (Naoumkina et al., 2022), indicating that the mutation is causing defect in fiber elongation. Since Li2 mutant has normal plant phenotype but is defective for fiber elongation, we used Li2 mutants in this study to understand fiber development.
Eukaryotic chromatin is composed of DNA and histone nucleosomes (Kornberg & Lorch, 1999) and the position of nucleosome affects the accessibility of transcriptional machinery to cis-regulatory elements. Gene expression is regulated by regulatory elements, such as DNA binding sites or other regulatory motifs, which include promoters, enhancers, and silencers (He et al., 2010). Hence, the local accessibility of chromatin is an important and informative structural feature that is important for gene expression. A new method for detecting open chromatin regions is ATAC-seq (assay for transposase-accessible chromatin with high-throughput sequencing), which is gaining importance for the identification of various transcription factors in the regulation of gene expression as well as studying their role. The technology detects accessible open chromatin using a modified Tn5 transposase preloaded with sequencing adapters (Buenrostro et al., 2015). The cis-regulatory elements in the open chromatin region contain TF binding sites; therefore, it is important to recognize cis-regulatory sequences in vivo to understand how TF expression in Li2 mutant can coordinate the effect of fiber shortening. ATAC-seq technology has been widely used in humans, animals, plants, and fungi (Chereji et al., 2017; Hendrickson et al., 2018). Human hematopoietic cells were analyzed by ATAC-seq and RNA-seq techniques to identify downstream transcription factors (Shannon & Trent, 2021). Some core genes affecting the reproductive changes of orange-spotted grouper were analyzed and identified by ATAC-seq and RNA-seq technology (Wu et al., 2020). The effects of the environmental gene regulatory network in rice were revealed by ATAC technology (Olivia et al., 2016). RNA-seq and ATAC-seq technologies were also used to identify key genes involved in Sparassis latifolia primordia formation(Yang et al., 2019). As reported in many species, the combination of ATAC-seq and RNA-seq technologies has been successfully used to identify chromatin accessibility and downstream gene expression to identify key genes involved in different processes. With ATAC-seq and RNA-seq, potential functional interactions associated with development can be revealed at high resolution (Lowe et al., 2019). The characteristics of the outer integument cells of wild-type and fuzzless/lintless (f) cotton (Gossypium hirsutum) ovules were analyzed using single-cell RNA sequencing (scRNA-seq) and single-cell ATAC sequencing (scATAC-seq), and revealed that GhTCP14 rhythmically controls translation and energy metabolism to promote fiber growth (Wang et al., 2023). There are various transcription factors (TFs) and target genes involved in the regulation of cotton fiber length. However, the mechanism of fiber elongation mediated by transcriptional regulatory networks is still unclear to a large extent.
In this study, we identified 499 differential target genes (DEGs) between wild type (WT) and Li2 8DPA fibers using ATAC-seq and RNA-seq. GO analysis showed that these differential genes mainly affect the secondary wall synthesis, xylan synthesis, glucan aldehyde transferase activity, and microtubule binding. Among the DEGs, the expression of kinesin-like protein genes was significantly downregulated, while lignin synthesis genes were significantly upregulated. Using MEME-ChIP for motif enrichment analysis of peak region, and using this information combined with publicly obtained expression and protein interaction data, the regulatory networks of target genes of Li2 and WT to target genes were constructed, and the downstream target genes of these TF were predicted. To identify genes related to fiber length, we have performed a combined analysis of the ATAC-seq and RNA-seq data with FLGWAS data. The analysis has identified 13 genes, including LRR-RLK, FLA7, BEL1, and F5H, which have been shown to affect fiber development. Further, according to the sequencing data, the deletion interval at the end of chromosome D13 of the Li2 mutant was shorter than previously reported, and there was no deletion of the GhIRX7 gene. In conclusion, the Li2 deletion altered the chromatin accessibility leading to a change in the expression of several transcription factors involved in fiber development, thus negatively affecting fiber elongation in Li2 mutant.
2 MATERIALS AND METHODS
2.1 Plant materials
Gossypium hirsutum L. short fiber mutant Li2 and WT (li2li2) DP5690 (Hinchliffe et al., 2011; Xing et al., 2023) were planted in the field of Zhengzhou scientific research center (institute of Cotton Research, Chinese Academy of Agricultural Sciences) and plants were grown under field conditions. For each genotype, 30 plants were planted, representing three replicates with 10 plants each. Fibers at 8 DPA (8 Day-After-Pollination) were harvested from plants grown under the same conditions and directly frozen in liquid nitrogen. For each WT and Li2 mutant, three biological replicates were used (each replicate includes at least 20 cotton bolls from 10 cotton plants).
2.2 ATAC-seq library preparation
The 8DPA fibers collected from WT and Li2 mutant were ground into a powder using liquid nitrogen before extracting the complete nucleus. The extraction steps are as follows: suspend the ground tissue with pre-cooled PBS, followed by centrifugation at 500g, 4°C for 5–10 min to remove the suspension. Then add 50 μL of pre-cooled PBS, followed by another centrifugation at 500g, 4°C for 5 min to remove the suspension. Cold cracking buffer (50 μL) was added to the pellet, followed by centrifugation at 500g, 4°C for 10 min to remove the supernatant. The extracted nuclei were incubated in TD (2 × reaction buffer), TDE1 (Nextera Tn5 Transposase), nuclease free H2O containing transposase at 37°C for 30 min, then Qiagen MinElute PCR Purification Kit was used for purification and 10 μL Elution Buffer was added to elute DNA. Then PCR amplification was carried out to prepare the library, using Qiagen MinElute PCR Purification Kit to purify the library, and the concentration and quality of the library were detected. The constructed library was sequenced using the Ingenebook Biotechnology Company(Wuhan, China) Illumina HiSeq2000 platform.
2.3 Data processing and quality control
Data was sequenced at high-throughput using Illumina, and quality control was performed using FastQC (version: 0.11.5; de Sena & Smith, 2019). Sequencing error will occur in generating the data due to several factors, such as a sequencer, sequencing reagents, and sample preparation steps and reagents. The software Trimmomatic (version 0.36) was used to filter the data. Hisat2 was used to map quality-filtered reads to the TM-1 genome (Gossypium hirsutum, ZJU; https://cottonfgd.org/about/download.html) and reads with unique mappings were retained. Clean data reads were compared with reference genomes without mitochondria and chloroplast data using hisat2 (version: 2.0.1-beta) software (Daehwan et al., 2015). The entire genome was scanned to preliminarily determine the interval on the genome that reaches a certain depth for establishing basic data models, then combined with the high-quality alignment sequences in these intervals. The Poisson distribution model was used to test and analyze the whole genome, screen for intervals with significant enrichment and p-value meets the requirements, defined as a potential enrichment interval (potential peak).The analytical model based on MACS (version 2.1.0; Zhang et al., 2008) scans the genome-wide peaks (enrichment region) to get the location information of the peak on the genome and the sequence information of the peak region. Benjamin–Hochberg program was used to calculate the q-value from the p-value (Benjamini & Hochberg, 1995). When q-value <0.05, the region is defined as the peak. The peak results are obtained from the MACS analysis software, and the gene corresponding to the transcriptional initiation site closest to the summit position of the peak (if there is no summit position, the midpoint position is taken) is found; that is, the peak is considered to be associated with the gene. In addition, the peak distributions of different genomic regions (such as promoter, exon, intron, and intergenic region) were analyzed.
2.4 RNA-seq and qPCR analysis
Collected fiber samples from WT and Li2 were frozen with liquid nitrogen immediately, and three biological replicates were collected. Following the manufacturer's instructions, Trelifef TM RNAprep Pure Plant Plus Kit (Tsingke) was used to extract RNA from tissue samples and evaluated for RNA quality and concentration. The igenebook Biotechnology Company (Wuhan, China) performed the RNA-seq and bioinformatics analysis. The library was constructed by using the extraction kit and sequenced on Illumina HiSeq2000. The RNA-seq and ATAC-seq data related to this research were deposited at NCBI SRA under the following accession numbers: PRJNA976951. Using the All-in-One First-Strand cDNA Synthesis Super Mix qPCR Kit (One-Step gDNA Removal; TransGen), 1 μg of RNA was used to convert RNA to cDNA. To analyze gene expression, GhUBQ7 (accession no. DQ116441) was used as an internal control. SYBR Green was used to perform RT-qPCR analysis using LightCycler 480 (Roche Diagnostics GmbH). The reaction was performed in a 20 μL reaction system with the following proportions of components: 10 μL of 2× MonAmp™ SYBR® Green qPCR Mix, 0.4 μL of forward primer (10.0 μmol L−1), 0.4 μL of reverse primer (10.0 μmol L−1), 8.2 μL of nuclease-free water and 1 μL (100 ng) of cDNA. We performed the reaction as follows: 95°C for 30 s, followed by 40 cycles of 10 s at 95°C, and 30 s at 60°C.
2.5 DEGs and enrichment analysis
The raw data was filtered and evaluated for quality with cut adapter (version 1.11) software, and then fastqc (version: 0.11.5) to process the filtered data. To compare the gene expression differences among different samples, we analyzed the differential gene expression by R packet edgeR (Robinson et al., 2010). The genes whose Fold Change value is <0.05 and the FDR absolute value is >2 were considered as significantly differently expressed. The differential peak was identified according to the relationship between presence and absence. In short, we identified it as a differential peak when it existed in Li2 mutant but not in WT or vice versa. Genes associated with differential peaks are called differential genes. The differentially expressed genes in RAN-seq and differential genes in ATAC-seq were identified as the final differential genes (DEGs). Gene Ontology1 (GO; Hu et al., 2015) is the international standard classification system of gene function. Using cluster profile (Guangchuang et al., 2012) for GO enrichment analysis, we chose a q-value <0.05 as the threshold for the significant difference. We have used KEGG (Kyoto Encyclopedia of Genes and Genomes; Minoru et al., 2014) for pathway analysis. After multiple hypothesis tests, q-values are calculated; the closer the q-value is to zero, the greater the significance of the enrichment.
2.6 Transcription factor motif analysis
The ATAC-seq peak that was enriched in WT and Li2 mutant was used for motif analysis. Firstly, the peak sequences of the two materials are extracted, and the repeated sequences are deleted. The extracted sequence was run using default parameters through MEME-ChIP (https://meme-suite.org/meme/tools/meme-chip) to identify overexpressed motifs (Machanick & Bailey, 2011). Overrepresented motifs were identified using DREME, MEME, and CentriMo, and Tomtom matched them to TF-binding motifs previously reported. All motif searches used both Cis-BP and DAP-seq databases, but only significant motifs with E-values >0.05 were considered.
2.7 Construction of protein interaction network and GWAS analyses
Based on publication co-occurrences, co-expression analysis, gene orthology, experimental data (such as yeast-two-hybrid interactions), and co-localization, genes were analyzed to identify TFs with predicted interactions according to the STRING database (https://cn.string-db.org/). Based on their confidence scores, TF network connections between submitted TFs were visualized, where thicker lines indicate stronger interactions. Additionally, the Markov cluster algorithm score of 3.0 was used to divide the network into differentially colored nodes. In this way, genes associated with some evidence of interaction can be detected without having to pass the interaction threshold required for a bona fide connection to be established. A low confidence score can be said as 0.15, a medium confidence score of 0.40, a high confidence score of 0.7, and a high confidence score of 0.9 in STRING. In this study, a minimum interaction threshold of 0.4 was used. Arabidopsis gene IDs were used as inputs to the STRING database. We obtained GWAS data on genes and phenotypes of different cotton varieties from public data (Ma et al., 2018). Tassel 5 and GML models were used to associate genotype data with phenotype data and calculate correlation coefficients. The obtained data were annotated using the cotton genome (Gossypium hirsutum NAU) as a reference to obtain SNP location and mutation information.
3 RESULTS
3.1 Li2 mutant fiber phenotyping
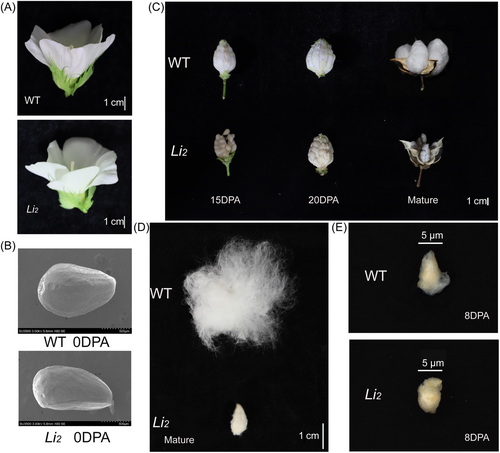
There was no significant visible difference in plant size or flower morphology between field-grown Li2 mutant and WT (Figure 1A). Scanning electron microscope analysis showed that there is no significant difference in phenotypes between Li2 and WT ovules. Further, there is no significant difference in the distribution and density of fiber initials on the ovule surface between Li2 mutant and WT (Figure 1B). Based on the phenotyping, it can be concluded that the Li2 mutant and WT have similar phenotypes and fiber initiation processes. However, the difference in fiber length between Li2 mutant and WT was observed from 8DPA, and the difference in fiber length became larger and larger during the course of the fiber elongation stage (Figure 1C–E). The time point of 8DPA was chosen because there were significant changes in transcription and metabolites between Li2 and WT during this period of fiber development (Naoumkina et al., 2014). It also provides an ideal material to capture differentially expressed genes involved in fiber length.
3.2 Identification and genomic distribution of cotton's accessible chromatin regions
Paired-end sequencing yielded six libraries derived from three biological replicates of Li2 mutant and WT. ATAC-seq reads between three biological replicates were reproducible in most cases (Figure S1C). By aligning reads to the cotton TM-1 genome, over 72% of total reads could be uniquely mapped to the genome. We calculated the nucleosome-free reads (<150 bp) and nucleosome-containing reads (>150 bp) by analyzing the fragment length distribution of each library's reads. According to the results, ATAC-seq library fragment length distribution was primarily about 100 bp or smaller, which indicates that nucleosome-free reading dominated the ATAC-seq library preparation(Figures S1A and S2). Nucleosome-free reads are accessible chromatin regions that TF may bind to, while nucleosome-containing reads are relatively difficult to bind to TF. In short, we were able to identify accessible chromatin regions in Li2 mutants and WT cells using ATAC-seq datasets.
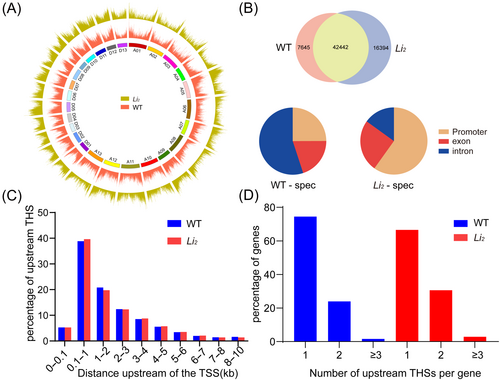
A peak, or THS for short, is an enriched region of accessible chromatin. Most of the peaks in Li2 mutant and WT were located within the promoter region or located in the intergenic regions. A small part of the peaks are located within the introns and exons (Figure S1D). A heatmap and average plot were then used to examine the signal of peaks located within 2 kb of TSS. Results showed that the strongest signal was observed around the TSS center in both Li2 mutants and WT (Figure S1B), indicating that the area near TSS is accessible. The peak results were obtained by MACS software, and we summarized the peaks regions identified in three replicates of the two materials and map the distribution of peaks on the genome (Figure 2A). We found the gene corresponding to the transcription start site closest to the summit position of the peak (if there is no summit position, take the midpoint position), indicating that this peak is related to this gene. Interestingly, the genome-wide peak of Li2 is 21% higher than that of WT. The open region peak located in the intergenic region was removed and we retained 67,167 peaks in Li2 mutant and 54,795 peaks in WT for further analysis. We removed the genes associated with peaks in the intergenic region. We found that most of the genes (42442) are common to both genotypes, while 16,394 and 7645 genes were found in only Li2 mutant or WT (Figure 2B). We call these genes ATAC-seq differential genes. There were differences in the distribution of peaks associated with ATAC-seq differential genes between the two genotypes and most of the peaks in Li2 mutants were distributed in the promoter region, while most of the peaks in WT are mainly distributed in introns (Figure 2B). In each genotype, the distribution of THS is mostly within the upstream 1 kb of TSS (Figure 2C) and most genes contain only one THS (Figure 2D).
3.3 Identification of differential target genes
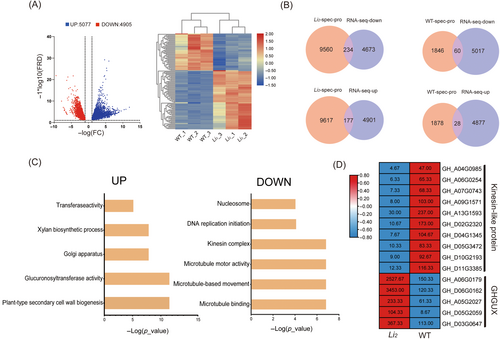
The RNA-seq data of the 8DPA fibers of Li2 mutant and WT were analyzed to determine whether the change in open chromatin regions corresponded to changes in gene expression. Analysis of differentially expressed genes showed upregulation of 5077 and downregulation of 4905 genes in Li2 compared with WT (Figure 3A). We associated the identified ATAC-seq differentially genes with RNA-seq differentially expressed genes. In the Li2 mutant, 9794 genes associated with peaks in the promoter region were combined with genes downregulated (logFC < −2.3, q-value <0.05) by RNA-seq, and we found 234 differential target genes, while 9794 genes associated with peaks in the promoter region were combined with genes upregulated(logFC ≥2.3, q-value <0.05) by RNA-seq, and we found 177 differential target genes. In WT, 1906 genes associated with peaks in the promoter region were combined with genes downregulated and 1906 were combined with genes upregulated (logFC ≤ −2.3, q-value <0.05) by RNA-seq, and 60 and 28 differential target genes were found, respectively. (Figure 3B, Tables S1 and S2). GO analysis for upregulated and downregulated genes showed that the upregulated genes mainly concern plant-type secondary cell wall biogenesis, glucuronosyltransferase activity, Golgi apparatus, xylan biosynthetic process and transferase activity, while the downregulated genes mainly concern microtubule binding, microtubule-based movement, microtubule-based movement, kinesin complex, DNA replication initiation, and nucleosome (Figure 3C). The expression of microtubule-related kinesin-like protein genes (KIF15, KIF11, and CEPNE) were significantly downregulated, which would affect cell development to some extent. The GhGUX genes (GUX2 and GUX3) related to xylan synthesis are significantly upregulated, which will significantly affect the synthesis of plant secondary wall and ultimately affect the development of fiber (Figures 3D and S3A,B). The GUX (glucuronic acid substitution of xylan) family genes can synthesize mature xylan from 1,4-B-d-xylan. This will affect the composition of the cell wall and may affect cell elongation. GUX gene is highly expressed in Li2 mutants, which leads to the development of cotton fiber cells.
3.4 Enriched motif analysis and identification of cotton fiber transcriptional regulatory networks
In peak regions of chromatin, there are likely to be TF-binding sites that recruit TFs to regulate nearby gene expression (Figure 4A). We identified sequence motifs that were overrepresented in two materials peaks to identify transcription factors involved in fiber elongation. To achieve this, repeated-masked sequences within the peak regions were analyzed by MEME-ChIP (Sijacic et al., 2018). The Li2 mutant peak contained 87 overrepresented motifs, while the WT peak contained 39 overrepresented motifs (Tables S3 and S4). We then use the STRING database to build an enriched TF network (Figure S4) using both known protein–protein interactions and functional interactions between genes (e.g., text mining association, co-expression, interactions in orthologs from other species, etc.); this method infers functional connections between sets of input genes. We identified 22 motifs present in both materials peaks, while 62 and 14 motifs were uniquely found within either in Li2 mutants or WT peaks, respectively. Although the identification of common sequence motifs suggests the presence of TFs that may be of biological relevance to the two samples, it is more relevant to ask whether these TFs are preferentially expressed. Therefore, to determine which TF is differentially expressed, we used RNA-seq data to identify six TF differentially expressed either in Li2 or in WT (Figures 4B and S3C).
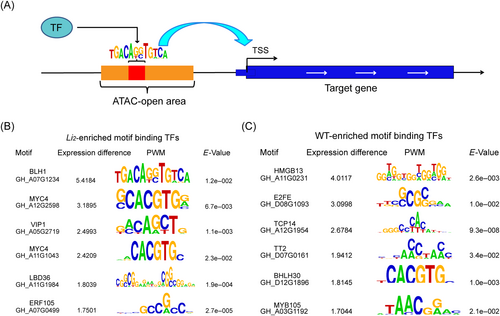
We aim to establish a potential regulatory network for fiber elongation. Six differentially expressed candidates TF (BLH1, MYC4 [GH_A12G2598], VIP1 and MYC4 [GH_A11G1043], LBD36, ERF105) were found in Li2 mutants. BLH1 regulates seed germination and early seedling development (Kim et al., 2013) and MYC4 plays a crucial role in controlling growth and development in Arabidopsis thaliana. There is an important role for LBD transcription factors in plant development (Kim et al., 2016). Six differential TFs (HMGB13, E2FE, TCP14, TT2, BHLH30, MYB105) were found in the comparative expression analysis. An E2FE transcription factor is involved in cell proliferation and development (Sozzani et al., 2010). The TCP transcription factor plays a crucial role in the development of plants. GhTCP14 responds to exogenous auxin, and its expression is mainly in fibroblasts, especially in the initial and elongation stages. GhTCP14 heterologously overexpressed in Arabidopsis enhanced root hair initiation and elongation (Wang et al., 2013). GhTCP14 rhythmically controls translation and energy metabolism to promote fiber growth (Wang et al., 2023).
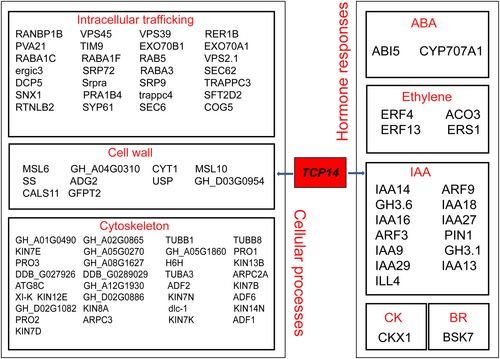
We used the peak sequences of the two materials for FIMO analysis to determine the occurrence of motifs and to predict the binding sites of TF. Using this approach, we discovered in Li2 mutants 15 predicted target genes for BLH1, 1663 predicted target genes for MYC4, 6835 predicted target genes for VIP1, 939 predicted target genes for MYC4, 132 predicted target genes for LBD36, and 4425 predicted target genes for ERF105. In WT, we discovered 243 predicted target genes for HMGB13, 361 predicted target genes for E2FE, 5290 predicted target genes for TCP14, 1127 predicted target genes for TT2, 4363 predicted target genes for BHLH30, and 3400 predicted target genes for MYB105. According to the functional annotations of the predicted target genes, we drew the regulatory network map of differential transcription factors (Figures 5, S5–S7; Table S5). Among them, GhTCP14 has been shown to be heterologously expressed in Arabidopsis and regulated by auxin-mediated cell elongation, and it rhythmically controls translation and energy metabolism to promote fiber growth. TCP14 widely regulates the process of cell development and regulates a large number of cell wall-related target genes, which may affect cell elongation and differentiation. TCP14 also regulates a large number of genes involved in cell transport and cytoskeleton, which also affect cell elongation. TCP14 also regulates many hormone-related genes and may be mediated by a variety of hormones. A network of differential transcription factors was constructed using STRING with the aim of establishing a regulatory relationship involved in fiber elongation (Figure S8). Interestingly, the correlation of differential target genes in Li2 mutants is higher than that in WT. It is suggested that these differential target genes play a common role in regulating fiber elongation (Figure S9).
3.5 Identification of key genes involved in fiber elongation
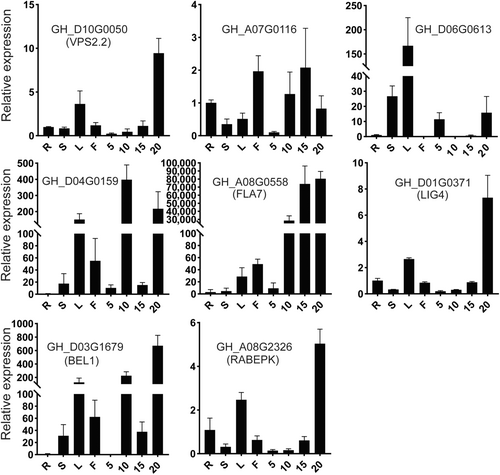
We combined 499 differential target genes with FLGWAS data to identify the genes with high-confidence SNP related to fiber elongation. A total of 13 genes with a high-confidence level of SNP were identified between Li2 mutant and WT (Figure S10A,B and Table S6). For example, F5H and FLA7 have non-synonymous mutations in the CDS region (Figure S10C) and there were significant differences in fiber length between the two haplotypes formed by SNP loci (Figure S10D). FLA7 belongs to fasciclin-like arabinogactan protein; all plant tissues and cells contain arabinogalactan proteins, which are glycoproteins that contain hydroxyproline and are vital for plant growth and development. FLA7 (GH_A05G0558) also showed a very high expression during fiber elongation (Figure 6, Table S7), and FLA7 may play an important role in fiber elongation. F5H (ferulate 5-hydroxylase) affects the synthesis of 5-hydroxy-coniferaldehyde by Feruloyl-CoA. Feruloyl-CoA is the precursor for the synthesis of G-lignin and 5-hydroxy-coniferaldehyde is the precursor for the synthesis of S-lignin. The synthesis of lignin will affect the elongation of fiber cells.
3.6 Analysis of deletion in chromosome D13 in Li2 mutant
According to previous studies, the Li2 mutant was a tandem inverted duplication at the end of chromosome D13. Based on the sequencing results of ATAC-seq, interestingly, we found that there was a sequence peak in the promoter region of GH_D13G2601 (GHIRX7) in the Li2 mutant, and there was also a peak in the promoter region of GH_D13G2603, and GH_D13G2603 was the last gene associated with sequencing. There is a peak in the promoter region of GH_D13G2603 in WT, and the last gene associated with sequencing is GH_D13G2631. GHIRX7 was also amplified in the RNA of the Li2 mutant (Figure S11). Therefore, we believe that GH_D13G2601 and GH_D13G2602 are not deletions. In previous studies, it was reported that the GHIRX7 gene was deleted and responsible for the short-fiber phenotype of Li2. In our study, it was found that GHIRX7 was not deleted, hence the effect of GHIRX7 on the Li2 phenotype needs to be further studied. Recent studies have shown that large-scale structural rearrangements have been found at the end of D13 chromosome in Li2 mutants. Gene Gh_D13G2437(GH_D13G2604) is located at the connection of the reverse repeat sequence in the replication area (Naoumkina et al., 2022). Our results are also consistent with them.
4 DISCUSSION
The development of cotton fiber is a complex process and understanding the role of individual genes in the developmental process is key for the fiber length and quality. Li2 mutant offers an excellent model system as it has normal fiber inhalation but is defective in elongation, causing short fibers. While individual studies were performed on understanding the molecular mechanism, there is no comprehensive/integrative study to reveal the overall impact of various genetic and molecular modifications in Li2 mutant fibers. Here, we use methods involving the combination of ATAC-seq and RNA-seq to identify differential transcription factors and differential target genes to construct a regulatory network involved in fiber elongation. The Li2 mutant has a significantly altered chromatin accessibility of 8DPA fibers; in particular, the genes involved in secondary wall synthesis were upregulated and the expression of the kinesin-like protein was downregulated, which plays an important role in fiber elongation. The differential target genes were combined with FLGWAS data, and the genes related to fiber elongation were identified. Further, the ATAC-seq data helped to re-define the Li2 chromosome D13 deleted region, giving a new perspective on the role of deletion in fiber development.
The ATAC-seq data shows that the peaks are mainly distributed at both ends of chromosomes, which indicates that chromosomes are more active near telomeres in cotton. However, the comparative analysis of the ATAC-seq data of Li2 and WT showed that there were more peaks in the promoter region of the Li2 mutant, which indicated that the Li2 mutant also had a more complex regulatory network, which led to changes in gene expression in Li2 fibers. Identification of the transcription factors and other genes involved in fiber development helps in revealing the mechanisms that affect fiber development in cotton.
Using ATAC-seq and RNA-seq data, we have identified 499 differential target genes. We annotated the differential target genes by GO and the results showed that the upregulated genes mainly affected the synthesis of plant secondary wall, the process of xylan synthesis, and the activity of glucanosyltransferase. And the expression of GHGUX, gene related to xylan synthesis, was significantly upregulated. GUX gene is a glucuronosyltransferase, which adds 4-O-methylglucuronic acid to xylose residues, affecting different domains of xylan and xylan synthesis, which is very important for secondary wall deposition and plant development (Bromley et al., 2013; Chanhui et al., 2012). GUX gene can make 1,4-B-d-xylan, and xylan is one of the main components of plant secondary wall. Our results show that the expression of the GHGUX gene is significantly upregulated, which results in increased xylan synthesis, thus affecting the thickening of the secondary wall and, ultimately, the development of fiber (Oppenheimer et al., 1997). The overall gene expression data indicate that the Li2 fibers are switching to secondary cell wall synthesis before the completion of elongation of the fiber, resulting in shorter fibers. The fiber elongation stage, which lasts about 13–17 days, is critical to achieve the proper length before terminating elongation and switching to secondary cell wall synthesis (Haigler et al., 2012). The normal development of cotton fibers requires the termination of elongation at an appropriate time and the transition to the synthesis of secondary cell walls. Elongation determines the fiber length, whereas secondary cell wall synthesis determines fiber quality (strength, micronaire, etc.). Gene expression and ATAC-seq analysis indicate that the fiber elongation end time of the Li2 mutant may be earlier than that of WT, and the transition into secondary wall synthesis is in advance. Downregulated genes mainly affect microtubule binding, microtubule-based motility, microtubule motility and kinesin complex. The dynamic changes of microtubules are also closely related to the elongation of fibrous cells. For example, the turning time of microtubules will affect the elongation of fibrous cells. Interestingly, we found that many kinesin-like protein genes were downregulated (Figure 4D). This may also have an important effect on the regulation of Li2 fiber development. We believe that the reason for the shortening of Li2 fiber may be that it affects the synthesis of plant secondary wall and microtubule development in addition to pausing the elongation. Alternatively, the secondary cell wall synthesis is initiated before completion of the elongation process. Gene Gh_D13G2437 (GH_D13G2604) is located at the connection of the reverse repeat sequence in the replication area. The gene can produce self-complementary hairpin RNA during transcription and then produce small interfering RNA. the long lint fiber phenotype was recovered by overexpressing Gh_D13G2437 (GH_D13G2604) in the Li2 mutant. The Gh_D13G2437 (GH_D13G2604) gene encodes RAN-BINDING PROTEIN 1 (RanBP1) expressed during the elongation of cotton fibers (Naoumkina et al., 2022) and belonging to the RanGTPase family, which plays a role in cell cycle progression, secondary wall expansion (Li et al., 2016), and microtubule tissue (Ojuka & Goyaram, 2014). Our results showed that the genes involved in the synthesis of the secondary wall were upregulated and the expression of kinesin-like protein was downregulated. The silencing of the RanBP1 family induced by siRNA may lead to the phenotype of Li2 mutant by affecting the expression of these genes.
To find the differential TF of each material, we analyzed the enriched peaks region to determine the specific cis-regulatory motif of each material and the TF that binds them. Our study has identified the TCP14 transcription factor, which has been shown to regulate auxin gene expression positively or negatively. Identification of TCP14 indicated an important role in auxin-mediated cotton fiber cell differentiation and elongation. Analysis of the regulatory network map of TCP14 showed a number of auxin-related genes in the regulatory network map of TCP14. In addition, it also regulates many genes related to the cell wall and cytoskeleton, which is also essential for fiber elongation. Although other transcription factors have not been reported for their roles in fiber development, the analysis of the regulatory network of identified transcription factors showed that they regulate genes related to the cell wall and cytoskeleton, indicating the potential roles of these transcription factors in cotton fiber development. For example, bHLH30 regulates many hormone-related genes, suggesting that it may be involved in multiple hormone-related pathways. It also regulates many genes related to cytoskeleton and cell wall synthesis, indicating potential roles in fiber elongation. In Li2 mutants, we identified six differentially expressed transcription factors, among which LBD36 and MYC4 have been reported to affect the growth and development of Arabidopsis thaliana (Kim et al., 2016; Zhang et al., 2018). We analyzed the regulatory network of MYC4 and found that it regulates a large number of genes related to ABA and IAA, which indicates that it may participate in ABA- and IAA-related hormonal pathways and play an important role in fiber development. At present, VIP1 was not found to play roles in cotton fiber development; however, the analysis of the VIP1 regulatory network found that it regulates a large number of genes related to ABA and IAA, and regulates many genes related to the cell wall and cytoskeleton, which indicates that VIP1 may play an important role in fiber elongation. Our analysis showed the involvement of several transcription factors and these differentially expressed transcription factors form a complex regulatory network to regulate fiber elongation. To understand the relationship between the transcription factors, we have constructed the regulatory relationship between differential transcription factors and differential target genes, which may play an important role in fiber development.
The differentially expressed gene data were integrated with fiber length GWAS data to mine some genes with higher confidence related to fiber length, which resulted in the identification of 13 genes, some of which are related to fiber development (LRR-RLK, FLA7, BEL1, and F5H). Cotton LRR-RLK genes are known to regulate the process of cotton fiber development (Ruibin et al., 2018) and the cotton FLA (FASCICLIN-LIKE ARABINOGALACTAN) gene is highly expressed in fiber tissue, which may play an important role in fiber development as they are related to cell elongation (Huang et al., 2008). Both the BEL1 transcription factor (Ma et al., 2020) and the F5H gene (Gao et al., 2019) are involved in regulating the secondary cell wall (SCW) synthesis, especially lignin biosynthesis, which is important for cotton fiber development and secondary cell wall synthesis (Balasubramanian et al., 2016).
In this study, according to the sequencing results of ATAC-seq and the amplification of GHIRX7 in the RNA of Li2 mutant, we believe that GH_D13G2601 and GH_D13G2602 are not missing. In previous studies, it was reported that the GHIRX7 gene was deleted and led to the short fiber phenotype of Li2. In our study, GHIRX7 was not deleted, so the effect of GHIRX7 on the Li2 phenotype needs further study. Recent studies have shown that large-scale structural rearrangements have been found at the end of the D13 chromosome in Li2 mutants. The rearrangement includes 177 kb deletion and 221 kb repetition, and the repetition is positioned as tandem reverse repetition. The gene Gh_D13G2437 (GH_D13G2604) is located at the connection of the reverse repeat sequence in the replication area.
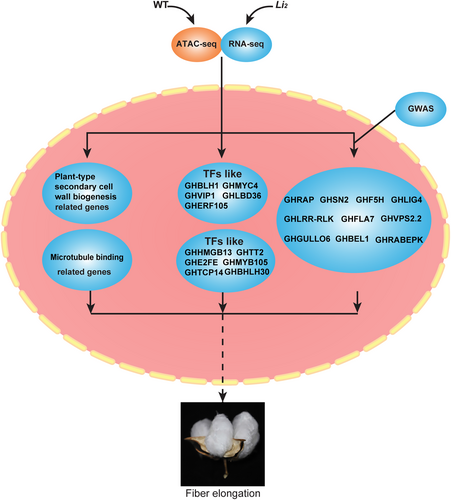
Overall, the present investigation was carried out utilizing the ATAC-seq technique and the data was integrated with the data generated from two other techniques (RNA-seq and FLGWAS) to comprehensively understand the molecular/genetic mechanism involved in fiber development using WT and Li2 mutant. The present comprehensive study has identified key genes related to fiber elongation, which provides a basis for further investigation of the cotton fiber elongation mechanism and characterization of specific genes involved in the development of the Li2 phenotype (Figure 7). Characterization of these key genes is important to precisely understand the molecular/genetic basis for short fiber phenotype in Li2 mutant and design strategies for cotton fiber yield and quality improvement.
AUTHOR CONTRIBUTIONS
Guoquan Chen and Zhao Liu: analyzed the data. Shengdong Li, Le Liu, and Lili Lu: completed the manuscript. Fuguang Li and Zuoren Yang: conceived and designed the experiment. All authors read and edited the article.
ACKNOWLEDGMENTS
This work was supported by Xinjiang Science and Technological Program (the Tian-Shan Talent Program [2022TSYCCX0087], the Key Research and Development Program of Xinjiang [2022B02052] and the Changji Science and Technology project of China [No. 2021Z01]).
CONFLICT OF INTEREST STATEMENT
The authors report no declarations of interest.
Open Research
DATA AVAILABILITY STATEMENT
The data that support the findings of this study are openly available in NCBI SRA at https://www.ncbi.nlm.nih.gov/, reference number PRJNA976951.


