Genome-wide discovery of genetic variations between rice cultivars with contrasting drought stress response and their potential functional relevance
Abstract
Drought stress is a serious threat to rice productivity. Investigating genetic variations between drought-tolerant (DT) and drought-sensitive (DS) rice cultivars may decipher the candidate genes/regulatory regions involved in drought stress tolerance/response. In this study, whole-genome resequencing data of four DS and five DT rice cultivars were analyzed. We identified a total of approximately 4.8 million single nucleotide polymorphisms (SNPs) and 0.54 million insertions/deletions (InDels). The genetic variations (162,638 SNPs and 17,217 InDels) differentiating DS and DT rice cultivars were found to be unevenly distributed throughout the rice genome; however, they were more frequent near the transcription start and stop sites than in the genic regions. The cis-regulatory motifs representing the binding sites of stress-related transcription factors (MYB, HB, bZIP, ERF, ARR, and AREB) harboring the SNPs/InDels in the promoter regions of a few differentially expressed genes (DEGs) were identified. Importantly, many of these DEGs were located within the drought-associated quantitative trait loci. Overall, this study provides a valuable large-scale genotyping resource and facilitates the discovery of candidate genes associated with drought stress tolerance in rice.
1 INTRODUCTION
Drought is one of the major abiotic stress affecting a large area of cultivated land and limiting rice productivity. It adversely affects approximately 23 million hectares of rain-fed land and reduces approximately 40% of annual rice production (Iqbal et al., 2013). Various biological and cellular processes, like plant growth, yield, membrane integrity, pigment content, osmotic adjustments and photosynthetic activity, are affected by drought. The morpho-physiological analysis of several rice cultivars under drought stress has led to the identification of drought-tolerant (DT) and drought-sensitive (DS) cultivars (Adhikari et al., 2019; Degenkolbe et al., 2009; Jaldhani et al., 2021; Lafitte et al., 2007; Yang et al., 2019). However, most of the DT rice cultivars are poor in yield. Therefore, there is a need to identify novel key molecular factors that can be employed to enhance drought tolerance in high-yielding DS rice cultivars.
Single nucleotide polymorphisms (SNPs) and insertions/deletions (InDels) are important genetic variations due to their enrichment throughout the genome, and low-cost and high-throughput genotyping capability. The next-generation sequencing (NGS) methods have revolutionized the genome-wide discovery and analysis of SNPs and InDels (Chai et al., 2018; Jain et al., 2014; Rajkumar et al., 2021, 2022; Subudhi et al., 2020; Tanaka et al., 2020; Vasumathy et al., 2020; Wu et al., 2021; Yadav et al., 2019). DNA polymorphisms present in different genomic regions may result in diverse effects on gene(s) function. The SNPs/InDels present within the coding region can alter the protein structure and/or function, whereas those present in the regulatory regions can affect the gene function by modulating the expression (Chai et al., 2018; Huo et al., 2019; Jain et al., 2014; Robert & Pelletier, 2018; Rojano et al., 2019; Subudhi et al., 2020). The altered gene expression can influence various biological and cellular processes leading to phenotypic variations (Bønnelykke et al., 2015; Robert & Pelletier, 2018; Zeng et al., 2015). Thus, analysis of SNPs/InDels in DT and DS rice cultivars is necessary to investigate the regulatory genes/elements responsible for drought tolerance.
Genome-wide studies on the discovery of DNA polymorphisms among different rice accessions have identified their evolutionary relationship, morpho-physiological behavior and stress responses (Subudhi et al., 2020; Tanaka et al., 2020; Vasumathy et al., 2020; Wu et al., 2021). Further, several drought-related quantitative trait loci (QTLs), including qDTY1.1-1.4, qDTY2.1-2.4, qDTY3.1-3.4, qDTY4.1, qDTY4.3-4.6, qDTY6.1, qDTY6.3, qDTY7.1, qDTY8.1, qDTY9.1, qDTY9.1A, qDTY10.1, qDTY10.2, qDTY11.2, and qDTY12.1 have been identified (Bernier et al., 2007; Bhattarai & Subudhi, 2018; Catolos et al., 2017; Dixit et al., 2012; Dixit, Huang, et al., 2014a; Dixit, Singh, et al., 2014b; Melandri et al., 2020; Palanog et al., 2014; Sandhu et al., 2014, 2018; Shamsudin et al., 2016; Swamy et al., 2013; Venuprasad et al., 2009; Vikram et al., 2011; Yadav et al., 2019). Although several reports on the discovery of DNA polymorphisms in rice are available, many of these relied on low-throughput methods and/or used a limited number of rice cultivars/accessions. A high-quality SNP map and analysis of DNA polymorphisms are required for the comprehensive understanding of the drought stress response of DT and DS rice cultivars. In our previous study, we analyzed DNA polymorphisms between a DS (IR64) and a DT (N22) rice cultivar via high-depth whole-genome resequencing (Jain et al., 2014). However, the analysis of a greater number of cultivars can result in the discovery of high-confidence DNA polymorphisms and candidate genes implicated in drought stress tolerance and provide mechanistic insights underlying drought tolerance.
Therefore, in the current study, we performed a high-depth whole-genome resequencing analysis of four DS (IR64, Pusa Basmati 1, Samba Mahsuri, and Swarna) and five DT (Nagina 22, Dular, Dhagad desi, Sahbhagi Dhan, and Vandana) rice cultivars and identified high-confidence DNA polymorphisms in the rice genome. Further, a set of DNA polymorphisms differentiating DS and DT cultivars were identified. The DNA polymorphisms were annotated based on their genomic location, and their effect on gene structure and/or function was analyzed. The influence of SNPs/InDels on the expression of genes involved in drought stress response was also studied. Further, functional annotation of genes harboring DNA polymorphisms located within drought-related QTLs was performed to investigate their involvement in drought stress response. Overall, this study provides a resource for large-scale genotyping in rice and revealed several SNPs/InDels and candidate genes associated with drought stress response, which might help improve drought tolerance in rice.
2 MATERIALS AND METHODS
2.1 Plant material and sequencing
The genomic DNA from two DS (Samba Mahsuri and Swarna) and three DT (Dhagad desi, Sahbhagi Dhan and Vandana) rice (Oryza sativa) cultivars was isolated from 15-day-old seedlings using Qiagen DNeasy Mini kit. The quality of DNA was analyzed using Bioanalyzer 2100 (Agilent Technologies) and Qubit 2.0 Fluorometer (Invitrogen Life Technologies). The library for each sample was constructed using the manufacturer's protocol (Illumina Technologies). The sequencing of each library was performed using Illumina Hiseq 2000 platform to generate 100-nt long paired-end reads. In addition, genome resequencing data of two each of DS (IR64 and Pusa basmati 1) and DT (Nagina 22 and Dular) rice cultivars were used from the previous studies (Jain et al., 2014; Mehra et al., 2015). The quality control (removal of low-quality reads and reads containing adaptor/primer contamination) of FASTQ files was carried out using NGS QC Toolkit (v2.3; http://www.nipgr.ac.in/ngsqctoolkit.html) (Patel & Jain, 2012).
2.2 Read mapping and identification of SNPs/InDels
The high-quality (HQ) filtered reads of all the nine rice cultivars were mapped on the japonica rice genome (MSUv7, http://rice.plantbiology.msu.edu/) (Kawahara et al., 2013) using BWA (v0.7.12, http://bio-bwa.sourceforge.net/) software with default parameters. SamTools (v1.1, http://samtools.sourceforge.net/) was used to estimate the genome coverage. The BAM alignment file of each rice accession was used to identify the SNPs and InDels using Freebayes (v0.9.21-15-g8a06a0b, https://github.com/ekg/freebayes). The SNPs/InDels were further filtered using the stringent criteria of minimum variant frequency (base consensus ratio) of ≥80%, with the average quality of the SNP base ≥30 and minimum read depth of 10.
2.3 Analysis and annotation of SNPs and InDels
The genomic distribution of SNPs and InDels was analyzed by calculating their frequency in each 100-kb interval on the rice chromosomes and visualized using Circos (v0.69, http://circos.ca/). In addition, MEGA (v7, https://www.megasoftware.net/) was used for the analysis of evolutionary relationships among the rice cultivars based upon the SNPs differentiating DT and DS cultivars using default parameters. Further, the effect of SNPs/InDels (synonymous and nonsynonymous SNPs, and large-effect SNPs and InDels) and their annotation was carried out using snpEff (v4.2, http://snpeff.sourceforge.net/). The 2-kb upstream region of each gene was considered as the putative promoter region for analysis.
2.4 Functional annotation of genes harboring SNPs/InDels
Functional categorization of different sets of genes was carried out using gene ontology (GO) enrichment and eukaryotic orthologous group (KOG) analyses. The genes were classified into different KOG categories by searching gene sequences against the KOGnitor database available at NCBI. GO enrichment analysis was performed using the BiNGO plug-in (v2.44, https://www.psb.ugent.be/cbd/papers/BiNGO/Home.html) available in Cytoscape (v3.2.1, http://www.cytoscape.org/) with P-value cut-off of ≤0.05. The biological process and molecular function GO terms for all the rice genes were used for GO enrichment analysis.
2.5 Validation of SNPs
The validation of SNPs was carried out using the Sequenom MassARRAY iPLEX platform as described earlier (Gabriel et al., 2009; Rajkumar et al., 2018). A total of approximately 2 μg genomic DNA from each cultivar was used for PCR amplifications and detection of SNPs. The flanking sequence for each SNP was amplified using specific primers (amplification primers). Further, an extension primer specific to each SNP (which can bind one base upstream to the polymorphic site) was used to amplify the complementary polymorphic base using ddNTPs. The respective ddNTP was identified using mass spectrophotometry. The primer list used for the validation of SNPs is provided in Table S1.
2.6 Analysis of transcription factor binding motifs
The 2-kb upstream sequences of the set of genes harboring SNPs were scanned for transcription factor binding motifs (TFBMs) using HOMER (Hypergeometric Optimization of Motif EnRichment) (v4.7.2, http://homer.salk.edu/homer/motif/) with default parameters and P-value cut-off of ≤0.01. These motifs were further used in STAMP (http://www.benoslab.pitt.edu/stamp/) to find out their respective TFs against the Plant Athamap database using default parameters. The P-value cut-off of ≤0.01 was used for the assignment of the TF family to their respective binding motifs.
2.7 DNA polymorphisms associated with DEGs and drought-related QTLs
The differential gene expression was investigated using RNA-seq data from IR64 and N22 cultivars under control and desiccation stress conditions as reported previously (Shankar et al., 2016). The genomic location of differentially expressed genes (DEGs) was obtained from the rice annotation gff file for identification of the genes harboring DNA polymorphisms. The known drought-related QTLs in rice were identified from previous studies (Bernier et al., 2007; Bhattarai & Subudhi, 2018; Catolos et al., 2017; Dixit et al., 2012; Dixit, Huang, et al., 2014a; Dixit, Singh, et al., 2014b; Melandri et al., 2020; Palanog et al., 2014; Sandhu et al., 2014, 2018; Shamsudin et al., 2016; Swamy et al., 2013; Venuprasad et al., 2009; Vikram et al., 2011; Yadav et al., 2019), and their coordinates in the rice genome (MSUv7) were retrieved using the available flanking microsatellite markers (Table S4). The locations of DEGs harboring SNPs/InDels within the drought-related QTLs were analyzed based on their genomic coordinates. Mapchart tool was used to visualize the DEGs associated with QTLs on different rice chromosomes.
3 RESULTS
3.1 Genome-wide discovery of SNPs and InDels in rice cultivars
Here, we used nine rice cultivars (IR64, Samba Mahsuri, Swarna, Pusa basmati 1 [PB1], Nagina 22 [N22], Vandana, Sahbhagi Dhan, Dhagad desi, and Dular) for genome-wide discovery of DNA polymorphisms. Among these, IR64, Samba Mahsuri, Swarna, and PB1 have been reported as DS, whereas N22, Vandana, Sahbhagi Dhan, Dhagad desi, and Dular have been identified as DT rice cultivars based on their morpho-physiological characteristics in different studies (Gowda et al., 2012; Henry et al., 2011; Kumari et al., 2009; Lenka et al., 2011). We performed whole-genome resequencing for Samba Mahsuri, Swarna, Dhagad desi, Sahbhagi Dhan and Vandana, whereas the resequencing data for IR64, N22, PB1 and Dular were obtained from previous studies (Jain et al., 2014; Mehra et al., 2015). The quality filtering of raw sequencing data (>115 million raw reads for each sample) resulted in >104 million HQ reads for each rice cultivar (Table 1). These HQ reads were mapped on the rice genome and used for the discovery of SNPs and InDels. We obtained a total of 4,860,542 SNPs and 539,118 InDels using the stringent criteria (variant frequency of ≥80%, the average quality of the SNP base ≥30 and minimum read depth of 10). The distribution analysis on the rice genome revealed the highest number of SNPs/InDels in chromosome 1 and the least number in chromosome 10 (Figure S1A). In addition, the frequency of SNPs/InDels was highest in chromosome 6 (1900 SNPs per 100 kb and 207 InDels per 100 kb), whereas chromosome 10 exhibited the lowest frequency (914 SNPs per 100 kb and 95 InDels per 100 kb). The complete list of SNPs and InDels identified is provided at http://tgsbl.jnu.ac.in/ricesnp/. The distribution analysis showed that SNPs/InDels were mostly enriched at peri-centromeric regions and near the chromosome ends (Figure S1B). The nucleotide substitutions resulted in a greater frequency of transitions as compared to transversions (Ts/Tv = 2.46) (Figure S1C). The length of deletions and insertions ranged from 1 to 34 bp and 1 to 25 bp, respectively (Figure S1D).
| Drought-sensitive (DS) | Drought-tolerant (DT) | ||||||||
|---|---|---|---|---|---|---|---|---|---|
| IR64 | Samba Mahsuri | Swarna | PB1 | N22 | Dhagad desi | Dular | Sahbhagi Dhan | Vandana | |
| Total reads | 121,235,526 | 220,403,162 | 211,299,956 | 173,321,104 | 115,538,936 | 223,699,762 | 224,273,890 | 217,760,444 | 224,485,142 |
| High-quality reads | 113,048,322 | 196,086,628 | 188,077,944 | 142,401,894 | 104,496,716 | 195,057,834 | 188,682,064 | 197,779,536 | 199,967,886 |
| Sequencing depth (fold) | 27.17 | 46.76 | 44.85 | 33.96 | 25.12 | 46.51 | 44.99 | 47.16 | 47.69 |
| Total reads mapped | 109,233,476 | 188,246,871 | 175,914,538 | 142,203,393 | 100,424,956 | 188,015,543 | 188,139,170 | 189,302,450 | 189,696,542 |
| Unique reads mapped | 99,257,906 | 172,657,932 | 163,342,554 | 129,319,934 | 91,528,906 | 172,458,246 | 170,921,486 | 171,779,144 | 173,669,554 |
| Total reads mapped (%) | 96.63 | 96.00 | 93.53 | 99.86 | 96.10 | 96.39 | 99.71 | 95.71 | 94.86 |
| Genome coverage (%) | 86.73 | 93.54 | 93.4 | 94.69 | 85.9 | 93.34 | 94.3 | 93.87 | 93.61 |
3.2 DNA polymorphisms differentiating DS and DT rice cultivars
The genetic variations between DS and DT rice cultivars can reveal the molecular factors responsible for their contrasting drought stress response. Thus, we analyzed SNPs/InDels between different DS and DT rice cultivars. The highest number of SNPs/InDels was detected in Dular and least in Sahbhagi Dhan against all the DS rice cultivars (IR64, Samba Mahsuri, Swarna and PB1) (Figure S2; Tables S2 and S3). However, PB1 exhibited the maximum and IR64 the minimum number of SNPs/InDels against all the DT rice cultivars (Figure S2).
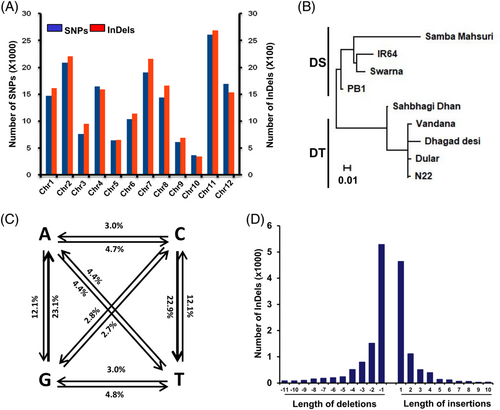
Further, we identified the SNPs/InDels between the sets of DT and DS cultivars having ≥75% same nucleotide base(s) at each site within each set and different consensus base(s) between the two sets. A total of 162,638 SNPs and 17,217 InDels differentiating DS and DT rice cultivars were identified. The chromosomes 2 and 11 harbored the highest number of SNPs/InDels, whereas chromosomes 9 and 10 possessed the least of them (Figure 1A). The SNP-based dendrogram analysis revealed distinct clusters for DS and DT rice cultivars (Figure 1B). The transitions were more than two times greater than transversions (Ts/Tv = 2.35). The frequency of transition from guanine (G) to adenine (A) (23.1%) and cytosine (C) to thymine (T) (22.9%) was found to be the highest (Figure 1C). In addition, single nucleotide deletions and insertions between DS and DT rice cultivars were most frequent (Figure 1D). These sets of SNPs and InDels are available at http://tgsbl.jnu.ac.in/ricesnp.
Next, we selected a total of 51 SNPs differentiating DS and DT cultivars, and validated them in different rice cultivars using the Sequenom MassARRAY iPLEX platform. The analysis revealed concordance of more than 90% of SNPs detected via both methods. This confirms the high-quality DNA polymorphisms obtained in this study.
3.3 Annotation and effect of SNPs/InDels
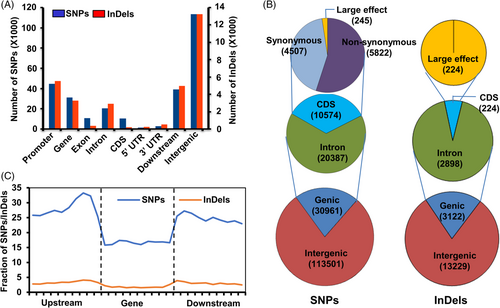
To understand the plausible effects of SNPs/InDels differentiating DS and DT rice cultivars, we analyzed their location in different genomic features. Most (~79%) of the SNPs/InDels were enriched in the intergenic regions and the remaining (~21%) were present in the genic regions (Figure 2A). About 42% of SNPs and 44% of InDels were located in the promoter regions. The distribution of SNPs/InDels within the gene body regions revealed that introns harbor the maximum number of SNPs (65.8%) and InDels (92.8%), whereas only 34.2% SNPs and 7.2% InDels were present within the coding regions (Figure 2B). Moreover, within the coding regions, nonsynonymous (nonsyn) SNPs (5822) were found to be more frequent than synonymous (4507) and large-effect (245) SNPs (Figure 2B). All the InDels present in the coding regions (224) resulted in frameshift mutations (large-effect). The SNPs/InDels distribution throughout the gene body region and their flanking (upstream and downstream) sequences showed higher density near the TSSs (transcription start sites) and TTSs (transcription termination sites) (Figure 2C). However, SNPs/InDels density within the gene body was found to be the lowest.
3.4 Functional annotation of SNPs/InDels
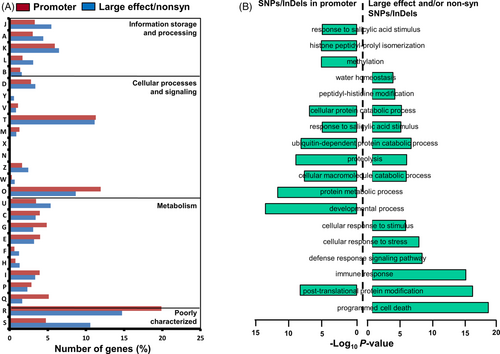
The functional annotation of the genes harboring large-effect SNPs/InDels, nonsyn SNPs and/or SNPs/InDels in their promoter regions was performed via KOG and GO enrichment analyses. The KOG analysis depicted that genes harboring these type(s) of SNPs/InDels were engaged in signal transduction (~11.13% genes with large-effect SNPs/InDels and/or nonsyn SNPs, and 11.29% genes with SNPs/InDels in promoter) and posttranslational modification (8.65% genes with large-effect SNPs/InDels and/or nonsyn SNPs, and 11.93% genes with SNPs/InDels in promoter) processes (Figure 3A). The genes harboring SNPs/InDels in their promoter regions were found to be involved in transport, and carbohydrate and lipid metabolic processes (Figure 3A). However, the genes harboring large-effect SNPs/InDels and nonsyn SNPs mainly contributed to cell-cycle-related processes (cell cycle control and cell division), DNA replication, chromatin structure and dynamics, RNA processing and modifications, translation and intracellular trafficking. Further, GO enrichment analysis deciphered that genes harboring SNPs/InDels in their promoter regions were found to be mainly involved in developmental processes, protein metabolic processes, posttranslational modification, and response to salicylic acid-related processes (Figure 3B). However, genes with large-effect SNPs/InDels and/or nonsyn SNPs were implicated in posttranslational modifications, immune response, response to abiotic stress stimulus and response to water deprivation-related biological processes.
3.5 Differential expression of genes harboring SNPs/InDels
The genes harboring large-effect SNPs/InDels, nonsyn SNPs and/or SNPs/InDels in their promoter regions were analyzed for their differential expression in/between the DS (IR64) and DT (N22) cultivars under control and/or desiccation stress conditions. Several genes harboring SNPs/InDels in their promoter regions displayed downregulation in N22 under control conditions as compared to the DEGs in IR64 and N22 under desiccation (Figure 4A). Likewise, genes with nonsyn SNPs were found downregulated under control and/or desiccation stress in N22 as compared to the IR64. The genes with large-effect SNPs/InDels exhibited lower expression in N22 under desiccation stress.
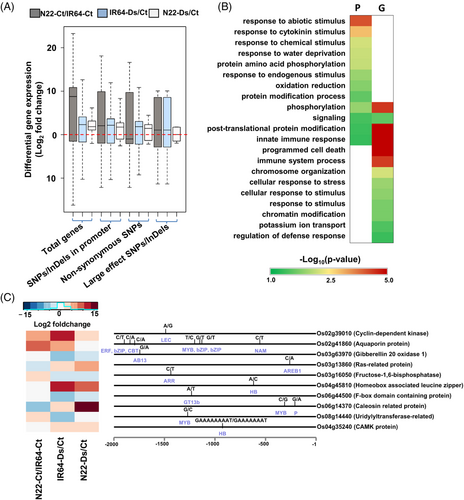
GO enrichment analysis revealed that DEGs having SNPs/InDels in their promoter regions were majorly involved in abiotic stress, water deprivation and oxidation/reduction-related processes (Figure 4B). The DEGs containing large-effect SNPs/InDels and/or nonsyn SNPs were found to be involved in programmed cell death, defense and potassium ion transport related processes (Figure 4B). However, DEGs with SNPs/InDels in their promoter and/or coding (nonsyn SNPs and/or large effect SNPs/InDels) regions were engaged in post-translational modification, innate immunity, and signaling processes. Moreover, the enrichment level of these processes was higher for DEGs that have nonsyn SNPs and/or large-effect SNPs/InDels than those with SNPs/InDels in their promoter regions.
3.6 Influence of SNPs/InDels within the cis-regulatory motifs on differential expression of abiotic stress-related genes
We scanned the promoter sequences of the DEGs with SNPs/InDels and identified 49 significantly enriched (P-value ≤0.01) putative TF-binding motifs. These motifs were analyzed for the presence of SNPs/InDels between IR64 and N22 rice cultivars. A total of 22 SNPs were detected within different cis-regulatory motifs in the promoter regions of 10 DEGs (Figure 4C). These motifs represented the binding sites of 13 different TF families, including ARF, LEC, NAM, HB, bZIP, ARR, AREB, MYB, and ERF (Figure 4C). Further, these genes harboring SNPs/InDels exhibited differential expression in/between IR64 and N22 rice cultivars under control and/or desiccation stress (Figure 4C).
3.7 SNPs/InDels underlying the drought-associated QTLs and their functional relevance
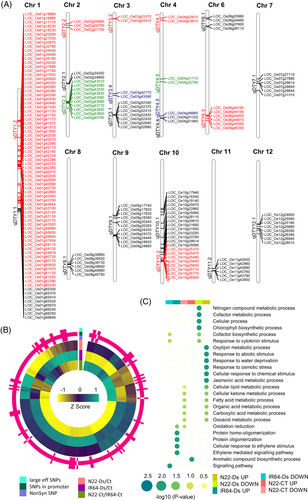
Several drought-related QTLs reported in previous studies were identified for analysis (Table S4). We mapped DEGs (harboring SNPs/InDels in the promoter, large effect SNPs/InDels and/or nonsyn SNPs) on these drought-associated QTLs and identified a total of 178 DEGs in/between IR64 and N22 cultivars under desiccation and/or control conditions. Among these, 137 genes harbor SNPs/InDels exclusively in their promoter regions, four genes harbor large-effect SNPs/InDels or nonsyn SNPs and 37 genes harbor both types (Figure 5B, Table S5). These genes were located within the 21 drought-related QTLs distributed on 11 rice chromosomes (Chr1-4 and Chr6-12), the highest being on qDTY1.2 at chromosome 1 followed by qDTY10.1 at chromosome 10 (Figure 5A). The genes with SNPs/InDels in their promoter regions showed higher expression (Figure 5B). A total of eight genes (LOC_Os01g40260, LOC_Os01g40430, LOC_Os01g65370, LOC_Os02g43330, LOC_Os02g43560, LOC_Os02g43820, LOC_Os04g32790, LOC_Os04g51320) encoding the members of different TF families (WRKY, MYB, HB, AP2-EREBP, Trihelix) were identified. These TFs harboring SNPs/InDels in their promoter regions were upregulated in N22 under desiccation stress (Figure 5A). The GO enrichment analysis of the DEGs revealed their involvement in different biological processes (Figure 5C). The upregulated genes in N22 under desiccation stress were exclusively engaged in oxylipin, jasmonic acid metabolic process, response to abiotic stimulus, water deprivation, osmotic stress, and chemical stimulus processes. However, downregulated genes in N22 under desiccation stress participated in nitrogen metabolism, cofactor metabolic process, cellular processes and chlorophyll biosynthetic processes. Notably, upregulated genes in N22 under control were engaged in cellular lipid, ketone, fatty acid, organic acid, carboxylic acid and oxoacid-related metabolic processes. However, downregulated genes under desiccation stress in IR64 and N22 were involved in cofactor biosynthetic process and response to cytokinin stimulus. The genes upregulated in IR64 under desiccation stress were implicated in protein homo-oligomerization, cellular response to ethylene (ET) stimulus and ET-mediated signaling pathways (Figure 5C).
3.8 SNPs/InDels associated with genes involved in hormone signaling
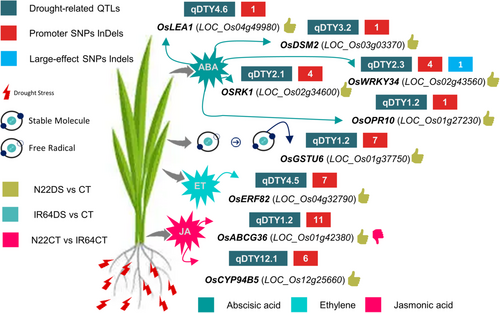
We further investigated the involvement of DEGs (located within drought-associated QTLs) harboring SNPs/InDels and involved in hormone signaling and reactive oxygen species (ROS) scavenging. A total of nine genes upregulated specifically in N22 under desiccation stress were found involved in abscisic acid (ABA), jasmonic acid (JA), ET and ROS scavenging signaling/mechanism (Figure 6). Among these ABA signaling-related genes included, OsLEA1 (LOC_Os04g49980) (qDTY4.6), OsDSM2 (LOC_Os03g03370) (qDTY3.2), OsWRKY34 (LOC_Os02g43560) (qDTY2.3), OSRK1 (LOC_Os02g34600) (qDTY2.1) and OsOPR10 (LOC_Os01g27230) (qDTY1.2). However, OsABCG36 (LOC_Os01g42380) (qDTY1.2) and OsCYP94B5 (LOC_Os12g25660) (qDTY12.1) were associated with JA signaling. The OsERF82 (LOC_Os04g32790) (qDTY4.5) and OsGSTU6 (LOC_Os01g37750) (qDTY1.2) genes were related to ET signaling and ROS scavenging, respectively.
4 DISCUSSION
The genetic constituent contributes to the phenotypic variations in rice cultivars/genotypes. The comparative analysis of rice genotypes with contrasting drought tolerance can provide better insights into drought stress responses/tolerance (Bhattacharjee & Jain, 2013; Bu et al., 2014; Jain et al., 2014; Lenka et al., 2011; Shankar et al., 2016). Moreover, DNA polymorphisms (SNPs/InDels) participate in genetic and phenotypic variability among different rice cultivars (Xu et al., 2011). Here, we investigated the DNA polymorphisms between four DS (IR64, Pusa basmati 1, Samba Mahsuri and Swarna) and five DT (N22, Dular, Dhagad desi, Sahbhagi Dhan, and Vandana) rice cultivars via high-throughput sequencing approach. We observed a higher transition type of nucleotide substitution than transversion type, and higher enrichment of SNPs/InDels in intergenic regions. Previous studies have suggested the importance of SNPs/InDels in various abiotic stress-responsive genes in rice cultivars (Chai et al., 2018; Jain et al., 2014; Mehra et al., 2015; Subudhi et al., 2020). The identification of high-confidence SNPs/InDels can provide important insights into their effect(s) on gene function/regulation. We investigated the involvement of DEGs harboring SNPs/InDels in various abiotic stress related pathways/processes in the DS and DT cultivars.
The cell cycle-related processes, aquaporins, fructose-1,6-bisphosphatase, and F-box domain and kelch-repeat-containing proteins have been reported to contribute to drought stress responses in rice (Bhattacharjee & Jain, 2013; Bu et al., 2014; Chen et al., 2021; Jain et al., 2014; Lian et al., 2006; Lv et al., 2017; Setter & Flannigan, 2001). We observed the involvement of cis-regulatory motifs harboring SNPs/InDels in abiotic stress responses. The cyclin-dependent kinase G-1 (LOC_Os02g39010), gibberellin 20 oxidase 1 (LOC_Os03g63970), aquaporin protein (LOC_Os02g41860), small GTP-binding protein (LOC_Os03g13860), fructose-1,6-bisphosphatase (LOC_Os03g16050), homeobox-associated leucine zipper (LOC_Os04g45810), F-box domain and kelch-repeat containing protein (LOC_Os06g44500) and uridylyltransferase-related proteins (LOC_Os08g14440) genes possessing SNPs/InDels in their TF-binding motifs were differentially expressed in N22 under desiccation stress. These genes represent important candidates contributing to drought tolerance in N22.
QTLs are the large genomic locations governing specific traits, and genes located within the drought-associated QTLs are known to be responsible for regulating drought response in rice (Melandri et al., 2020; Yadav et al., 2019). We investigated the drought-associated QTL-related DEGs harboring DNA polymorphisms between DT and DS cultivars. Various TFs were identified, including WRKY, MYB, HB, AP2-EREBP and Trihelix, and were considered as candidate genes of drought stress responses.
The plant hormones ABA and JA contribute to drought tolerance via the regulation of stomatal movement and maintenance of root hydraulic conductivity (Ding et al., 2016; Du et al., 2013; Xu et al., 2013). Likewise, ET modulates drought tolerance via ROS-mediated stomatal movement (Kazan, 2015). The drought-induced ROS production adversely affects plant growth and development via oxidative damage, lipid peroxidation, and protein and/or membrane disruption or dysfunction (Panda et al., 2021). We identified DNA polymorphisms, including large-effect and/or nonsyn DNA polymorphisms and SNPs/InDels, in the promoter regions of genes located within the drought-associated QTLs and related to ABA, ET, JA signaling, and ROS scavenging mechanism (Du et al., 2010; Jeyasri et al., 2021; Li et al., 2011; Xiao et al., 2007; Xiong et al., 2014); they might be involved in drought tolerance. The ABA signaling-related genes located within drought-associated QTLs and harboring DNA polymorphism, namely OsLEA1 (LOC_Os04g49980), OsDSM2 (LOC_Os03g03370), OsWRKY34 (LOC_Os02g43560), OSRK1 (LOC_Os02g34600) and OsOPR10 (LOC_Os01g27230), might contribute to drought tolerance in N22. Moreover, higher expression of JA signaling-related genes harboring DNA polymorphisms and located within drought-associated QTLs, OsABCG36 (LOC_Os01g42380) and OsCYP94B5 (LOC_Os12g25660) may also be involved in drought tolerance, as suggested earlier (Gupta et al., 2019; Moons, 2003). The ethylene signaling-related gene OsERF82 (LOC_Os04g32790) has been shown to modulate the drought response by controlling ethylene biosynthesis (Wan et al., 2011). The OsGSTU6 (LOC_Os01g37750) is known to reduce oxidative stress via ROS scavenging (Zu et al., 2021). Likewise, the upregulation of drought-associated QTL-related gene OsERF82 (LOC_Os04g32790) and ROS scavenging-related gene OsGSTU6 (LOC_Os01g37750) harboring SNPs/InDels in their promoter region suggest their participation in drought tolerance in N22. These drought-associated QTL-related candidate genes harboring DNA polymorphisms can serve as potential candidates for engineering drought stress tolerance.
5 CONCLUSION
In conclusion, we have identified a large set of high-quality SNPs/InDels that differentiate DS and DT rice cultivars via whole genome resequencing. The analysis of SNPs/InDels present in the regulatory and coding regions provided insights into the genetic differences among DS and DT rice cultivars and their potential functional relevance. Further, the association of SNPs/InDels with the drought-related QTLs and differential gene expression suggested their plausible role in differential drought stress response of the rice cultivars. Moreover, the integrated analysis presented in the study revealed a few putative candidate genes and DNA polymorphisms that may determine drought stress tolerance. Specifically, the genes related to hormone signaling, ROS scavenging mechanism and abiotic stress responses were identified as the potential candidates implicated in drought tolerance in rice. Overall, the set of high-confidence SNPs/InDels reported in our study can be used for various large-scale genotyping applications and the identified novel candidate genes may serve as potential targets for further crop improvement programs via forward or reverse genetics.
AUTHOR CONTRIBUTIONS
Mukesh Jain conceived the overall study and procured funding. Mukesh Jain and Rama Shankar designed the analyses. Rama Shankar and Anuj Kumar Dwivedi performed the analysis. Rama Shankar, Anuj Kumar Dwivedi, Vikram Singh, and Mukesh Jain interpreted the results and wrote the manuscript. All authors have read and approved the final manuscript.
ACKNOWLEDGMENTS
The financial support from the Department of Biotechnology, Government of India under the Bioinformatics Centre and National Network Project schemes, and the Department of Science & Technology, Government of India, under the Fund for Improvement of S&T infrastructure in universities & higher educational institutions (FIST) scheme. Mukesh Jain acknowledges Tata Innovation Fellowship from the Department of Biotechnology, Government of India, New Delhi (BT/HRD/35/01/04/2019). Anuj Kumar Dwivedi acknowledges Indian Council for Medical Research India for fellowship. The authors are thankful to Dr. R. Garg for initial processing of the sequencing data and corrections in the manuscript.
Open Research
DATA AVAILABILITY STATEMENT
All the DNA polymorphisms identified in the study are available at http://tgsbl.jnu.ac.in/ricesnp/.


