Drought tolerance in Brassica napus is accompanied with enhanced antioxidative protection, photosynthetic and hormonal regulation at seedling stage
Edited by M. Ahanger
Abstract
Climate change, food insecurity, water scarcity, and population growth are some of today's world's frightening problems. Drought stress exerts a constant threat to field crops and is often seen as a major constraint on global agricultural productivity; its intensity and frequency are expected to increase in the near future. The present study investigated the effects of drought stress (15% w/v polyethylene glycol PEG-6000) on physiological and biochemical changes in five Brassica napus cultivars (ZD630, ZD622, ZD619, GY605, and ZS11). For drought stress induction, 3-week-old rapeseed oil seedlings were treated with PEG-6000 in full strength Hoagland nutrient solution for 7 days. PEG treatment significantly decreased the plant growth and photosynthetic efficiency, including primary photochemistry (Fv/Fm) of PSII, intercellular CO2, net photosynthesis, chlorophyll contents, and water-use efficiency of all studied B. napus cultivars; however, pronounced growth retardations were observed in cultivar GY605. Drought-stressed B. napus cultivars also experienced a sharp rise in H2O2 generation and malondialdehyde (MDA) content. Additionally, the accumulation of ROS was accompanied by increased activity of enzymatic antioxidants (superoxide dismutase, peroxidase, catalase, ascorbate peroxidase, glutathione reductase, and monodehydroascorbate reductase), although the increase was more obvious in ZD622 and ZS11. Drought stress also caused an increased endogenous hormonal biosynthesis (abscisic acid, jasmonic acid, salicylic acid) and accumulation of total soluble proteins and proline content, but the extent varies in B. napus cultivars. These results suggest that B. napus cultivars have an efficient drought stress tolerance mechanism, as shown by improved antioxidant enzyme activities, photosynthetic and hormonal regulation.
1 INTRODUCTION
Water stress is an increasingly scarce resource that decreases crop production in many parts of the world. Drought stress is one of the most severe abiotic environmental stress factors affecting crop production worldwide (Kour et al., 2020). Rapid anthropogenic climatic changes affect the annual precipitation pattern, leading to severe drought stress in many agricultural areas (Scott et al., 2014). Acquiring drought tolerance in plants probably involves molecular, cellular, physiological, and developmental adjustments enabling plants to adopt an adequate response to maintain optimal growth and development (Bergmann, 2020). In plants, drought stress adaptive strategies have been categorized as (1) drought tolerance via early flowering (Khadka et al., 2020), (2) drought escape via enhanced water uptake and reduced water loss, and (3) drought avoidance via osmatic adjustment, antioxidant defense, and desiccation tolerance (Katuwal et al., 2020).
Several physiological factors are involved in drought stress tolerance, which prevents chlorophyll degradation and protects the photosynthetic apparatus. Drought stress negatively affects plant growth and productivity through reduction in leaf photosynthetic capacity due to the decreased CO2 diffusion and stomatal closure (Oraee & Tehranifar, 2020). Drought stress is often related to the accumulation of reactive oxygen species (ROS) such as H2O2 and MDA. ROS cause severe damage to membrane properties and chlorophyll structure, which affects the normal metabolism of plant cells (Oraee & Tehranifar, 2020). Plants possess an antioxidative defense system eliminating ROS. Some of the major enzymatic ROS scavengers include superoxide dismutase (SOD), peroxidase (POD), ascorbate peroxidase (APX), and catalase (CAT) (Begum et al., 2020).
Stomatal closure is the earliest plant response to water deficit. This rapid reaction is regulated by a complex network of signaling pathways, in which the major and the best-known player, abscisic acid (ABA), acts in concert with jasmonic acid (JA) and salicylic acid (SA). These hormones are considered positive regulators of stomatal closure to reduce water loss via transpiration (Li et al., 2020). This response is mainly associated with decreased stomatal conductance (Gs), more CO2 uptake to maintain the photosynthetic efficiency to sustain plant growth and development. Many predictions about future global environmental changes involve the increase in severity and frequency of drought stress (Wu et al., 2020). Clearly, a robust assessment about the soil water availability and its impact on ecological processes is urgently required, engineering and breeding more efficient and drought stress tolerant crop cultivars are becoming very important (Qamar et al., 2020).
Among oil crops, Brassica napus (rapeseed) ranks second in the world with a total annual worth of USD 41 billion, widely grown in temperate climates both northern and southern hemisphere in various seasons (annuals or biennials). Nowadays, rapeseed is widely used as a major edible oil source and biofuel production. However, rapeseed needs more water for its growth and development than other crops (corn, wheat) (Gao et al., 2019; Mat Aron et al., 2020). If water shortage occurs at the seedling level, it will hinder leaves and roots growth, which ultimately will reduce crop production (Kumar et al., 2020). The main objective of our study was to investigate the (1) drought stress interference in growth of B. napus cultivars, (2) differential antioxidative defense response to oxidative stress, and (3) physiological basis of genotypic variation along with hormonal biosynthesis in drought adaptability to identify physiological characteristics linked to drought tolerance ability.
2 MATERIALS AND METHODS
2.1 Plant materials and treatments
Uniform and good quality seeds of five rapeseed (B. napus) cultivars, that is, ZD630, ZD622, ZD619, GY605, and ZS11, were obtained from the College of Agriculture and Biotechnology, Zhejiang University, China. The rape seeds were sterilized for 20 min in 0.1% NaClO solution, and then washed with distilled water for about 15 min. Initially, seeds were germinated on moist filter paper, kept in the dark for 2 days and placed in a growth chamber with (day/night) temperature of 24/16°C with a 16-h photoperiod, 300 mM m−2 s−1 irradiance, and 60–70% relative humidity. One-week-old seedlings were transferred into 1 L plastic pots with half strength Hoagland nutrient solution for acclimation. Further, Hoagland nutrient solution was renewed with full strength after 2 weeks of culture (seedlings at three-leaf stage). Then 3-week-old plants were subjected to drought stress with 15% PEG-6000 solution (equivalent to −0.3 MPa water potential) for 7 days. Each treatment has four pots (considered as biological replicates) and each pot has five plants. After 1 week of treatment, plant samples were collected, immediately frozen into liquid nitrogen and stored at −80°C for analysis.
2.2 Morphological and chlorophyll fluorescence (Fv/Fm) measurements
After 7 days of drought stress treatment, plants were harvested, separated into roots and shoots, and placed in an oven at 85°C until stable weight was reached (dry weight) (Momoh & Zhou, 2001). For chlorophyll fluorescence analysis, B. napus mature leaves were sampled and kept in the dark for 30 min. The chlorophyll fluorescence yield (Fv/Fm) was determined by using pulse amplitude modulated fluorimeter (IMAG-MAXI; Heinz Walz). Four biological replicates (one replicate = one pot) with three technical replicates (randomly chosen from the plants in the pot) were selected and their means were calculated.
2.3 Leaf relative water content (RWC) analysis

2.4 Leaf gas exchange analysis
The photosynthesis rate, stomatal conductance, and transpiration rate of fully matured leaves were evaluated between 9:00 to 11:00 h using a portable photosynthesis system (LI-COR LI-6400XT). The fully expanded leaves were kept in a chamber at 1000 μmol m−2 s−1 photon flux density with a flow rate at 500 μmol s−1 with leaf temperature 28°C. The ambient CO2 concentration was kept at 380 μmol CO2 mol−1 air by keeping the vapor pressure deficit at 2.0 kPa. After instrument stabilization, at least 10 measurements were taken on three leaves per plant (and four biological replicates per treatment) from each stress treatment.
2.5 Chlorophyll contents and leaf stomata analysis by scanning electron microscopy (SEM)
The chlorophyll pigments were extracted from 0.2 g of frozen mature leaves (pooled from one plant) in 80% acetone at room temperature. The extract was centrifuged at 2800g for 15 min, the supernatant was collected for absorbance measurement at 750, 663, 652, 645, and 470 nm by using a fluorescence spectrophotometer (Hitachi F-4600).
The concentration of each pigment was analyzed by following the method of Arnon (1949). For SEM, leaf samples were fixed with 2.5% glutaraldehyde solution, and then post-fixed with 1% OsO4 in sodium phosphate buffer (pH 6.8). Samples were dehydrated with graded ethanol solution in addition of isoamyl acetate to pure isoamyl acetate solution (1:1 v/v). Then, samples were vacuum-dried by using HCP-2 in the presence of liquid CO2 with gold–palladium by using Hitachi Model E-1010 ion sputter. SEM observations were made by S-4800 microscope (Hitachi Le).
2.6 Proline, hydrogen peroxide (H2O2), malonaldehyde (MDA), and total soluble protein (TSP) analysis
Proline estimation was performed following Bates et al. (1973). The 0.5 g leaf tissue was ground in 3% sulfosalicylic acid (w/v). The homogenate was centrifuged for 25 min at 3000rpm (1008g). The supernatant was mixed with 2 ml of acid ninhydrin and 2 ml of glacial acetic acid and incubated for 1 h at 100°C. The chromophore containing toluene was aspirated from aqueous phase and readings were taken spectrophotometrically at 520 nm. The content of H2O2 was assessed using the methodology of Chen et al. (2010). Leaf tissue (0.5 g) was homogenized with 5 ml 0.1% solution of TCA (w/v) in a mortar and pistil. Samples were centrifuged for 20 min at 12,000 rpm (16,128g); 0.5 ml supernatant was added to 0.5 ml 50 mM PBS (pH 7.0) and 1 ml 1 M potassium iodide (KI) solution in a tube. The absorbance was measured at 390 nm and the H2O2 content was evaluated using a standard curve.
MDA content was analyzed according to Hong et al. (2010). Leaf tissue (0.5 g) was homogenized with 5 ml 0.1% TCA (w/v) solution in a mortar and pistil. Samples were centrifuged by adding 0.5 ml of enzyme extract to 0.5% TBA (w/v) in 20% TCA at 16,100g for 20 min. The mixture solution was incubated at 95°C using a water bath; the reaction was stopped by putting samples in an ice bath. The reaction solution was then centrifuged at 11,200g for 10 min, the supernatant absorbance was observed at 532 and 600 nm. MDA content was calculated by its extinction-coefficient. TSP content was determined according to the method of Bradford (1976) by using bovine serum albumin as a standard.
2.7 Biochemical analysis of enzymatic antioxidants
Leaf tissue (0.5 g) was ground in pre-cooled mortar and pistil in 50 mM PBS (pH 7.8) and centrifuged for 20 min at 16,128g. The supernatant was collected in another tube and used for further study of the enzymes' activity as “enzyme extract.” SOD activity was assessed following Zhang et al. (2008), which is based on the ability of SOD to inhibit NBT photochemical reduction. The reaction mixture consisted of 50 mM PBS (pH 7.8), 2 μM riboflavin, 13 mM methionine, 75 μM NBT, and 0.1 mM EDTA and 100 μl enzyme extract in a total volume of 3 ml. The same unilluminated solution was used as blank. One unit of SOD activity is the amount of enzyme required to cause 50% inhibition of the NBT reduction measured at 560 nm. CAT activity was assessed according to the method of Aebi (1984) and POD activity was assayed according to Chance and Maehly (1955) with some modifications. The reaction mixture contained 50 mM potassium phosphate buffer (pH 7.0), 1% guaiacol, 0.4% H2O2, and 100 μl enzyme extract. The oxidation of guaiacol was measured at 470 nm. APX activity was assessed by the H2O2-dependent oxidation rate of ascorbic acid (AsA) following the method of Farooq, Gill, et al. (2016). Glutathione reductase (GR) activity was assayed according to the method of Farooq, Gill, et al. (2016) with the oxidation of NADPH at 340 nm (extinction coefficient 6.2 mM cm−1) for 1 min. The reaction mixture was comprised of 50 mM potassium phosphate buffer (pH 7.0), 2 mM EDTA-Na2, 0.15 mM NADPH, 0.5 mM GSSG, and 100 μl enzyme extract. Monodehydroascorbate reductase (MDHAR) activity was assayed as described by Farooq, Gill, et al. (2016). The assay mixture for MDHAR reductase comprises 50 mM PBS (pH 7.0), 0.5 mM GSSG, 0.15 mM NADPH, 2 mM EDTA, and 100 μl enzyme extract in a total volume of 1 ml. After the addition of enzyme extract, the reaction rate was calculated by increase in absorbance at 265 nm for 10 to 30 s.
2.8 Endogenous hormones determination
2.8.1 Abscisic acid
Endogenous ABA was measured using the enzyme-linked immunosorbent (ELISA) kit as per manufacture instructions (Catalog # H251-1-2; Nanjing Jiancheng Institute of Biological Engineering Co., Ltd). Standards and samples were added to the appropriate microtiter plate wells with a HRP-conjugated ABA and antibody preparation specific for ABA then incubated at 37°C for 60 min. Then substrate solutions were added to each well. Further the enzyme-substrate reaction was terminated by addition of sulfuric acid solution and the color change was measured spectrophotometrically at a wavelength of 450 nm. The plant ABA content was then calculated by comparing the sample OD with the standard curve.
2.8.2 Jasmonic acid
JA content was observed using the ELISA kit (Catalog # F4976-B; MLBIO Tech.) following manufacturer instructions. Approximately 0.1 g of plant tissue was ground with 1 × saline phosphate buffer (PBS) containing 137 mM L−1 sodium chloride (NaCl), 2.7 mM L−1 potassium chloride (KCl), 8 mM L−1 disodium hydrogen phosphate (Na2HPO4), 1.46 mM L−1 potassium dihydrogen phosphate (KH2PO4), then homogenized in 1 ml of 1 × PBS and stored overnight at −20°C. The homogenate was centrifuged for 5 min at 10,000g at 4°C after repeating the two freeze–thaw cycles and supernatant was extracted. According to the manufacturer instructions, samples and standards were added to the microtiter plate wells with HRP conjugated reagent (horseradish peroxidase), after gently mixing and was incubated for 30 min at 37°C. Inhibition reaction takes place between JA (in standards or samples) and HRP-conjugated JA with the pre-coated antibody of JA.
2.8.3 Salicylic acid
The concentration of endogenous SA was measured using the ELISA kit (Catalog # MM-3372202; Jiangsu Enzyme Industry Co., Ltd) by following manufacturer instructions. Briefly, 0.5 g of frozen sample was ground into a homogenate in 5 ml of phosphate buffer saline (PBS, pH 7.4) and centrifuged at 1000g for 20 min. The 10 μl supernatants were diluted to 50 μl with PBS, then added into a microtiter plate followed by the addition of 100 μl enzyme-labeled reagent, and incubated for 60 min at 37°C. Following incubation, the plate was washed five times with washing solution, then 50 μl chromogenic reagent was added, and incubated for 15 min in the dark at 37°C. The reaction was stopped by adding 50 μl stopping solution. Absorbance was read at 450 nm spectrophotometrically. Quantitative analysis was carried out using a standard curve of SA provided with the kit.
2.9 Statistical analysis
All the data are presented as mean with standard errors. Analysis of variance (anova) was conducted to determine differences between the treatments. The significance of the differences between the rapeseed varieties or between the control and treatments was evaluated using lsd (Least Significant Difference) multiple range tests (P < 0.05) by using COSTAT cohort software (6.4). Principal component analysis (PCA) and hierarchical cluster analysis of all relative physiological parameters were used to evaluate differences in plant physiological responses in the genotypes by using XLSTAT (2016).
3 RESULTS
3.1 Drought stress differentially affected biomass accumulation in B. napus cultivars
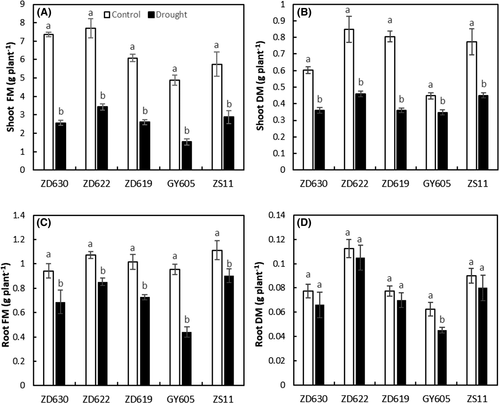
Drought stress significantly (P < 0.001) reduced plant growth characteristics, in terms of fresh and dry biomass of shoot and root, in all B. napus cultivars (Table 1 and Figure 1A-D). As an example, the shoot and root fresh biomass decreased by 68 and 53%, respectively, in GY605, 49 and 18% in ZS11, 65 and 27% in ZD630, 57 and 28% in ZD619, and 55 and 20% in ZD622 drought stressed compared to control (Figure 1A,C). Our results suggest that cultivars ZS11 and ZD622 have the highest dry biomass, ZD619 and ZD630 showed intermediate performance, while GY605 had the lowest dry biomass in all cultivars. Overall, ZS11 and ZD622 were found most tolerant in terms of biomass accumulation under drought stress, while GY605 was found to be the most sensitive cultivar.
| Source of variance | df | Shoot FM | Shoot DM | Root FM | Root DM | GR | MDHAR | SOD | POD | CAT | APX | Chl a | Chl b | Chl a/b | Total Chl | RWC | Fv/Fm | MDA | H2O2 | Pn | Gs | Ci | Tr | TSP | Proline | ABA | JA | SA |
|---|---|---|---|---|---|---|---|---|---|---|---|---|---|---|---|---|---|---|---|---|---|---|---|---|---|---|---|---|
| Cultivars | 4 | 6.17*** | 0.08*** | 0.04 ns | 0.003*** | 205.7*** | 4.11 ns | 114*** | 0.224** | 0.23* | 0.14 ns | 0.10 ns | 0.02** | 0.18* | 0.49** | 571.0 ns | 0.038*** | 114.2 ns | 402.1*** | 74.2*** | 0.08*** | 6700*** | 73.38*** | 6.7* | 22.4 ns | 7.76*** | 0.27 ns | 0.16 ns |
| Drought | 1 | 141*** | 0.89*** | 0.88*** | 0.001 ns | 209.2*** | 2.51 ns | 566*** | 0.44** | 0.12 ns | 0.18 ns | 1.54*** | 0.21*** | 0.12 ns | 3.88*** | 1181*** | 0.04*** | 2086.0*** | 954.9*** | 7191*** | 8.41*** | 3744*** | 1249*** | 0.10 ns | 1581.1** | 5.34* | 4.98*** | 0.58* |
| Cultivars × drought | 4 | 1.19 ns | 0.03 ns | 0.008 ns | 1.16 ns | 7.32 ns | 1.5 ns | 14 ns | 0.12 ns | 0.04 ns | 0.33 ns | 0.04 ns | 0.01* | 0.003 ns | 0.19 ns | 1187* | 0.004 ns | 50.7 ns | 730.2 ns | 144.2*** | 0.09*** | 3021*** | 28.6*** | 6.6* | 43.8 ns | 0.17 ns | 0.25 ns | 0.03 ns |
| Error | 30 | 0.95 | 0.01 | 0.02 | 4.1 | 4.2 | 1.7 | 4 | 0.05 | 0.06 | 0.14 | 0.04 | 0.004 | 0.04 | 0.09 | 426 | 0.003 | 45.1 | 456.4 | 5.97 | 0.01 | 198 | 1 | 1.7 | 168.1 | 1.09 | 0.27 | 0.1 |
- *, **, *** significant at 0.05, 0.01, 0.001 probability levels, respectively.
- ABA, abscisic acid; APX, ascorbate peroxidase; CAT, catalase; Chl a/b, chlorophyll a/b; Ci, CO2 intake; DM, dry biomass; FM, fresh biomass; GR, glutathione reductase; Gs, stomatal conductance; JA, jasmonic acid; MDA, malondialdehyde; MDHAR, monodehydroascorbate reductase; ns, non-significance; Pn, net photosynthesis; POD, peroxidase; RWC, relative water content; SA, salicylic acid; SOD, superoxide dismutase; Tr, transpiration rate; TSP, total soluble protein.
3.2 Tolerant cultivars maintained higher chlorophyll contents and Fv/Fm
Chlorophyll contents significantly (P < 0.001) decreased in all B. napus cultivars under drought stress (Table 1). Plants exposed to drought stress showed considerable inhibition in photosynthetic pigments (chlorophyll a, chlorophyll b, and total chlorophyll). For example, chlorophyll a, chlorophyll b, and total chlorophyll decreased by 60, 58, and 84%, respectively, in cultivar GY605, by 22, 10, and 20% in ZD622, by 28, 25, and 27% in ZS11, by 43, 20, and 42% in ZD619, and by 47%, 34%, and 45% in ZD630 drought stressed compared to control (Figure 2A,B,D). Under drought stress, the maximum chlorophyll contents were found in ZD622, while the minimum was found in GY605.
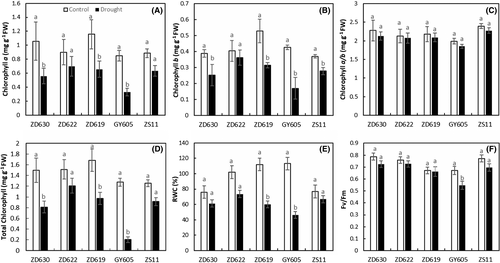
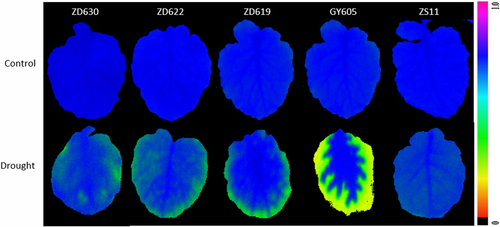
Drought stress also causes reduction in the primary yield of PSII in terms of Fv/Fm ratio (Figure 2F). Pseudo-colored images clearly indicated the drought stress impact on plants with a decline in Fv/Fm values compared to control plants (Figure 3). According to our data (Table 1), drought stress significantly (P < 0.001) decreased Fv/Fm in B. napus cultivars. For example, Fv/Fm decreased by 18% in GY605, 4% in ZD622, 7% in ZD630, 8% in ZD619, and 9% in ZS11 compared to control plants (Table 1). Our results suggest that a higher Fv/Fm value in ZD622 (lowest in GY605) indicates maximum PSII efficiency in terms of primary photochemistry.
3.3 Effect of drought stress on RWC
Drought stress significantly (P < 0.001) decreased the RWC in B. napus cultivars (Table 1). For example, drought stress decreased RWC by 59% in GY605, 12% in ZS11, 19% in ZD622, 27% in ZD630, and 46% in ZD619 compared to control (Figure 2E). Our results suggest that cultivar ZS11 and ZD622 have the maximum RWC, while GY605 had the lowest RWC in all cultivars.
3.4 Gas exchange parameters were significantly affected in GY605 cultivar
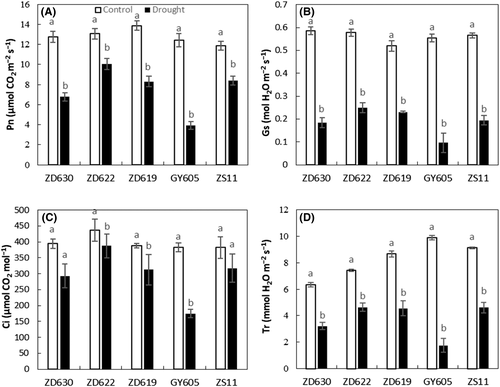
As shown in Table 1, drought stress significantly (P < 0.001) suppressed the gas exchange attributes such as net photosynthesis (Pn), stomatal conductance (Gs), and transpiration rate (Tr) in B. napus cultivars. For example, Pn and Gs under drought stress reduced by 68 and 82%, respectively, in GY605, 23 and 56% in ZD622, 29 and 65% in ZS11, 40 and 55% in ZD619, and 46 and 68% in ZD630 compared to control (Figure 4A,B). Intercellular CO2 (Ci) under drought stress considerably decreased by 65% in GY605, 38% in ZD630, 39% in ZS11, 46% in ZD619, and 58% in ZD622 compared to control (Figure 4C). Likewise, transpiration rate (Tr) significantly decreased under drought stress by 80% in GY605, 37% ZD622, 47% in ZD619, 49% in ZD630, and 50% in ZS11 compared to control (Figure 4D).
3.5 Sensitive cultivar accumulated more MDA, H2O2, and proline
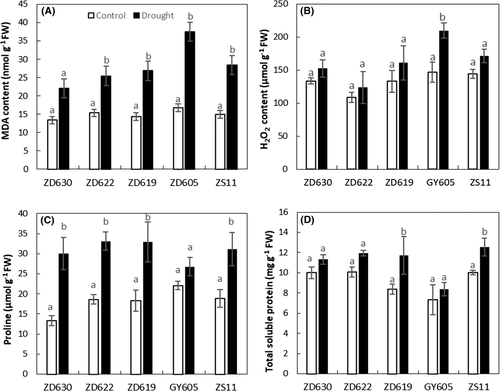
MDA content under drought stress significantly (P < 0.001) enhanced in B. napus cultivars (Figure 5A and Table 1). As an example, MDA content increased up to 57% in GY605, 39% in ZD630, 38% in ZD622, 46% in ZD619, and 47% in ZS11 compared to control plants (Figure 5A). H2O2 content under drought stress significantly (P < 0.01) increased by 30% in GY605, 12% in ZD622, 17% in ZD619, 15% in ZS11, and 13% in ZD630 compared to their respective control plants (Figure 5B). Likewise, proline content under drought stress significantly (P < 0.01) increased by 55% in ZD630, 17% in GY605, 43% in ZD622, 44% in ZD619, and 39% in ZS11 compared to control (Figure 5C). TSP content increased by 28% in ZD619, 3% in GY605, 20% in ZS11, 15% in ZD622, and 11% in ZD630 compared to control plants (Figure 5D).
3.6 Tolerant cultivars showed enhanced activities of antioxidative enzymes
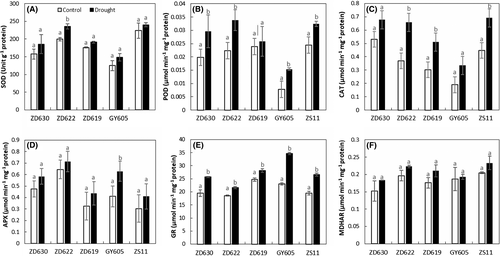
Antioxidant enzymes activities such as SOD, POD, CAT, APX, GR, and MDHAR were analyzed in B. napus cultivars and showed significance difference in their response (Table 1). As an example, the SOD and POD activities under drought stress considerably increased by 15 and 45%, respectively, in ZD622, 3 and 10% in GY605, 7 and 23% in ZS11, 8 and 25% in ZD619, and 15 and 18% in ZD630 (Figure 6A,B). CAT and APX activities under drought stress increased by 62 and 29%, respectively, in ZS11, 4 and 34% in GY605, 11 and 29% in ZD622, 12 and 25% in ZD619, and 22 and 18% in ZD630 compared to control plants (Figure 6C,D). Likewise, drought stress significantly increased the GR and MDHAR activities by 33 and 4%, respectively, in GY605, 12 and 16% in ZD619, 14 and 11% in ZD622, 24 and 12% in ZD630, and 26 and 16% in ZS11 compared to control (Figure 6E,F).
3.7 Cultivar dependent biosynthesis of phytohormones under drought stress
Significant changes (P < 0.001) in leaf endogenous hormone contents such as ABA, JA, and SA were observed in all B. napus cultivars (Table 1). As an example, ABA and JA contents under drought stress considerably increased by 35 and 59%, respectively, in ZD622, 9 and 25% in GY605, 11 and 45% in ZS11, 17 and 32% in ZD630, and 21 and 29% ZD619 compared to control plants (Figure 7A,B). SA content under drought stress significantly increased (P < 0.05) by 27% in GY605, 11% in ZD619, 11% in ZS11, 16% in ZD630, and 17% in ZD622 compared to control (Figure 7C).

3.8 SEM-based stomatal visualization under drought stress
SEM images show that all B. napus cultivars subjected to drought stress have smaller stomatal length and width compared to control (Figures 8A-J). Our results suggest that, under drought stress, stomata of the tolerant cultivars ZD622 and ZS11 were longer, wider and more open to facilitate the stomatal opening by osmotically retaining water in leaves (Figure 8D,J). In contrast, the sensitive cultivar GY605 under drought stress had highly defective guard cells with irregular borders and edges (Figure 8H).

3.9 Principal component analysis
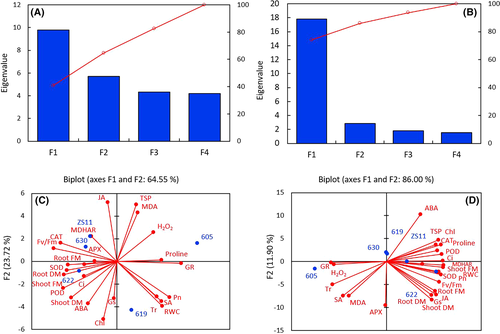
According to the PCA based on Pearson's correlation coefficient in B. napus cultivars ZS11, ZD630, ZD622, and ZD19 under drought stress, plant biomass exhibited positive correlation with TSPs, chlorophyll contents, Fv/Fm, antioxidants enzymes (CAT, POD, SOD, MDHAR), photosynthesis attributes (Pn, Ci, Gs), and RWC. Proline content positively correlated (r2 = 0.47) with antioxidants enzymes (SOD, POD, and CAT), photosynthesis parameters (Pn, Gs, and Ci) and JA, while proline showed negative correlation with ABA, APX, GR, H2O2, MDA, and SA. A positive correlation was observed between TSPs, chlorophyll contents, CAT, proline, POD SOD, Pn, and RWC. In contrast, GY605 (sensitive cultivar) showed positive correlation between GR, APX, H2O2, MDA, SA, and transpiration rate (Tr) (Table S1). However, the MDA content exhibited a strong negative correlation (r2 = 0.79, P < 0.001) with POD, CAT, APX, proline, chlorophyll, RWC, ABA, JA, Pn, Ci, Gs, and Fv/Fm, while it positively correlated with SA. Similarly, H2O2 showed negative correlation (r2 = 0.69, P < 0.01) with proline, chlorophyll, RWC, ABA, JA, Pn, Ci, Gs, and Fv/Fm, while it positively correlated with SA in the sensitive cultivar GY605. This suggests that the sensitive cultivar had a higher accumulation of ROS with reduced photosynthesis and growth promoting hormones than tolerant cultivars (Figure 9D).
3.10 Correlation analysis in B. napus cultivars under drought stress
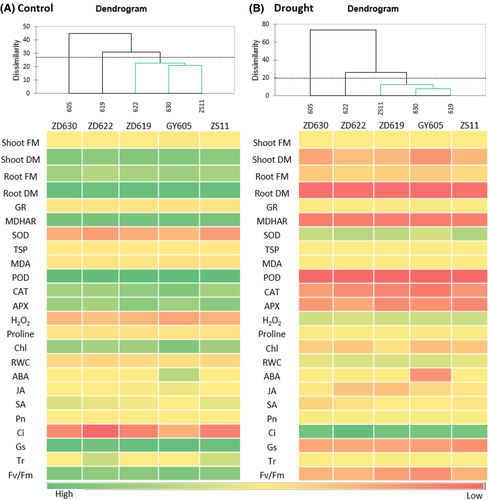
Figure 10 heat map further explains the physiological responses of five B. napus cultivars under control and drought stress condition. According to our data, plant biomass (FM and DM), chlorophyll contents, Fv/Fm, RWC, TSP, and proline content were positively correlated with ABA, JA, and antioxidant enzymes (CAT, POD, APX, and MDHAR) under drought stress. In contrast, photosynthetic parameters (Pn and Ci), SOD, GR, and SA were negatively correlated (P > 0.001) with stress markers like H2O2 in the studied B. napus cultivars. Correlation analysis determines total score of the physiological responses of B. napus cultivars under control and drought conditions (Figure 10).
4 DISCUSSION
4.1 Drought-tolerant cultivars maintained higher biomass and chlorophyll contents in B. napus under drought stress
Water shortage and high temperature work synergistically in field conditions (Chen, Li, et al., 2020). Therefore, the present study was performed in a growth chamber to interpret the adverse effects of drought stress on plant morphological, physiological, biochemical changes and oxidative damages of five B. napus cultivars (ZD630, ZD622, ZD19, GY605, and ZS11). Plant's fresh and dry biomass represent the plant growth condition and can be considered as key performance indicators for drought stress assessment. Our results suggested that drought stress significantly declined plant growth in terms of fresh and dry biomass in all B. napus cultivars. The decrease in plant biomass due to drought stress was higher in the sensitive cultivar (GY605) than in the tolerant cultivars (ZD622, ZS11), which is in line with previous studies on B. napus, B. rapa, B. campestris, and Triticum aestivum (Cha et al., 2020; Grieco et al., 2020; Khanzada et al., 2020; Shawon et al., 2020). Similarly, several previous studies suggested that, under drought stress, the reduction in plant growth attributes is accompanied with a reduction in plants turgor pressure, cell division, cell wall biosynthesis, and cell expansion (B. Li, Feng, et al., 2020; Pakdel et al., 2020; Zaid et al., 2020). A wealth of literature provided ample evidence that drought stress adversely affected plant biomass (shoot and root fresh and dry biomass) in addition to water content in Brassicaceae species (Bhuiyan et al., 2019), B. napus (Dai et al., 2020), B. carinata (Samanta et al., 2020), and B. oleracea (He et al., 2020). The loss of chlorophyll and photosynthesis can also cause a decrease in plant fresh and dry biomass under drought stress. Similarly, in the present study, a significant decline in the synthesis of chlorophyll pigments was observed in all Brassica cultivars (Table 1). This might be due to the increased activity of chlorophyllase enzyme, oxidative-breakdown of pigments, thylakoidal membrane distortion, and nutrients deficiency (Shen et al., 2020). The activity of protochlorophyllid reductase was suppressed and chlorophyll synthesis could be reduced upon drought stress, which was considered as a key reason for the reduction in the studied pigments (Hou, 2020).
4.2 Stomatal limitations caused reduction in photosynthesis, RWC, and Fv/Fm in B. napus under drought stress
In the present study, after 7 days of treatment, leaves of drought-treated plants were wilted and the shoot biomass decreased along with the leaf gas exchange attributes (Pn, Tr, Gs, and Ci) and RWC, suggesting that drought stress causes cell dehydration and plant growth reduction. These findings correspond to previous studies in different crop plants under water stress (Cai et al., 2020; Liang et al., 2020; Terletskaya et al., 2020). Drought stress treatment significantly tempered the leaf gas exchange parameters (Pn, Gs, and Tr), while considerable reductions in Pn and Gs were observed in the sensitive cultivar (GY605) upon drought stress compared to control (Table 1), which correspond to previous studies on drought stress (Demirel et al., 2020). The decrease in gas exchange parameters may be due to the photosynthetic pigment's degradation and distortion of water transport from root to shoot, which further reduced the Gs and Tr, that is accompanied with a reduction of Pn (Zhang et al., 2020). Previous studies have indicated that leaf Tr exhibits a positive relation with drought stress, which may cause stomatal closure to reduce Tr to maintain water balance under drought stress (Li et al., 2017). In contrast, Ci values declined under drought stress in all cultivars. Stomatal closure, one of the first plant responses to drought, is important in determining overall plant survival strategies (Reynolds-Henne et al., 2010). In our study, the decrease in Pn was associated with reductions in Gs, Ci, and Tr under water stress (Figure 4A-D), which suggests that the main strategy of B. napus seedlings to endure drought stress is via strict stomatal control. This is in accordance with previous findings of Taylor et al. (2020) in Brassica crops. Interestingly, despite the tight stomatal regulation in the studied cultivars, the decline in Gs, Tr, and Ci in ZD622 and ZS11 was much lower than GY605 under drought stress (Figure 4A-D), which shows that ZD622 and ZS11 are better adapted to dry conditions. Moreover, net photosynthetic rate can decline due to non-stomatal limitations associated with ROS and MDA accumulation or the inhibition of the Rubisco enzyme under drought. So, the non-stomatal constraint could have a dominant role in restricting the photosynthetic efficiency and limiting the effects of drought stress on the tested B. napus cultivars. Drought stress significantly influenced the plant photosynthetic efficiency and Fv/Fm, which is the primary yield of photochemistry of PSII and considered a potential indicator of photosynthetic capacity. Generally, variations in Fv/Fm are often confirmed by the concentration changes of specific photosynthetic pigments and cell structure modulations that may be influenced by several environmental factors affecting PSII activity such as light, nutrient status, and temperature (Miao et al., 2020). Several studies showed that drought stress may affect the reaction center and obstruct the electron transportation system, which ultimately leads to a reduction in Fv/Fm (Hussain et al., 2020). In addition, our findings also indicate that drought stress has a more severe negative effect on the Fv/Fm of cultivar GY605 than ZD622 and ZS11 (Figure 2F), which suggests that GY605 was more sensitive to drought stress than ZD622 and ZS11.
4.3 The coordinated action of antioxidative enzymes provides oxidative protection to B. napus under drought stress
ROS generation under the influence of environmental stresses, including drought stress, leads to lipid peroxidation, degradation of antioxidants and ultimately initiates changes in gene expression (Choudhury et al., 2013; Zhou & Leul, 1998). The generation of ROS is a common event during all types of abiotic stress regardless of the plant species. An excessive amount of ROS is cytotoxic and can adversely damage the lipids, proteins, DNA, and other entities of plant cells (Biswas et al., 2020). The present study showed an enhanced ROS concentration under drought stress in all B. napus cultivars; yet, the H2O2 content was the most pronounced in GY605, suggesting higher oxidative stress under water deficit conditions. Chowardhara et al. (2020) reported that higher H2O2 concentration in plants can cause severe cellular damages, which may lead to cell death. It has been hypothesized that ROS production can be the primary symptom of phytotoxicity and this mechanism has been widely studies in plants under abiotic stress (Farooq et al., 2013; Ray et al., 2020). However, in stress condition, the balance between the production and elimination of the active oxygen-free radical in cells is not maintained (Farooq, Islam, et al., 2016; Rogers, 2020). MDA is a known product of lipidperoxidation resulting from cell membrane damage. Our results showed that MDA content was substantially higher in GY505 under drought stress. However, ZD622 and ZS11 had a lower MDA content under drought stress. This suggests that cultivars ZD622 and ZS11 have an efficient antioxidant defensive system for ROS elimination. Antioxidant enzymes have critical importance in the scavenging of superoxide ions and resistance to lipidperoxidation. The first enzyme in the antioxidant pathway is SOD, which converts highly reactive OH· radical and superoxide (O.−) to less toxic H2O2, which reduces damage to DNA, protein, and membrane (Goswami et al., 2020). Our result showed that, under drought stress, SOD activity was higher in ZD622 and ZS11 than cultivar GY605. This indicates that ZD622 and ZS11 had better performance in reducing the stress damage caused by superoxide ions, involved in lipid peroxidation and membrane damage. These results are in agreement with other findings which report an increased SOD activity in relation to drought stress in alfalfa (Zhang et al., 2018) and maize (Anjum et al., 2017). POD activity is enhanced under drought stress with the highest activity in ZD622 and ZS11. These results indicate that stress treatment triggered an increase in POD activity of ZD622 and ZS11 allowing the cultivars to better resist drought stress. This is similar to previous findings reporting an increased POD activity in drought stress conditions in Brassica species (Ozkur et al., 2009) and T. aestivum (Kirova et al., 2021). The drought-tolerant cultivars ZD622 and ZS11 contained higher constitutive level of CAT, APX, MDHAR, and GR under drought stress than the drought sensitive cultivar GY605. In B. napus under drought, the increased activities of CAT, APX, MDHAR, and GR suggest the involvement of the Halliwell–Asada pathway, where APX reduces H2O2 to water and MDHAR using ascorbic acid as substrate (Koyro et al., 2012; Laxa et al., 2019). In certain conditions, the scavenging of O2− by SOD and H2O2 decomposition by APX and CAT are predominantly responsible for the maintenance of cellular redox state. Yang et al. (2008) and Badawi et al. (2004) reported that APX activity increased in drought-stressed Picea asperata seedlings and Nicotiana tabacum, respectively. Guerra et al. (2015) observed increased APX activities in B. napus plants showing enhanced tolerance to drought. GR plays a key role in defense system by sustaining the reduced status of glutathione (GSH) (Ahmad et al., 2010; Hasanuzzaman et al., 2019). This might be due to the maintenance of a high ratio of NADP+/NADPH, therefore ensuring availability of NADP+ for accepting electrons from the photosynthetic electron transport chain and facilitating the regeneration of oxidized ascorbate (Khaleghi et al., 2019). The activities of GR under drought stress conditions were enhanced in various plants, for example, Helianthus annuus (Ghobadi et al., 2013), Arabidopsis thaliana (Goodarzian Ghahfarokhi et al., 2015; Koffler et al., 2014). Overall, the observed noticeable increased efficiency of the antioxidant enzyme complex under drought stress might be correlated to tolerance mechanisms based on fine-tuned regulation of its redox status.
4.4 Biosynthesis of phytohormones plays a key role in the adaptation of B. napus cultivars to drought stress
The pattern of hormonal changes (ABA, JA, and SA) in B. napus leaves in response to drought stress and their possible involvement in the physiological responses was addressed. ABA has a key role in the adaptation of plant to drought stress (Chen, Zhao, et al., 2020; S. Li, Li, et al., 2020). In rice plants, ABA has a pivotal role for plant acclimation to drought stress (Basu et al., 2016; Piveta et al., 2021; Saradadevi et al., 2017). In this work, the ABA level increased more in tolerant cultivars ZD622 and ZS11 than sensitive cultivar GY605 in response to drought stress (Figure 7A). Therefore, ABA accumulation seems to be responsible, at least in part, for the observed stomatal closure (Figure 8A-J). JA is a hormone widely related to abiotic stress responses in plants (Wang et al., 2020). In the present work, a higher accumulation of JA was observed in the tolerant cultivars ZD622 and ZS11 than in the sensitive cultivar GY622 (Figure 8B), highlighting the importance of this hormone in plant adaptations to drought stress as previously reported (Anjum et al., 2011; Basu et al., 2016). According to our results, we hypothesized that JA has a specific role to adjust stomatal aperture in B. napus plants under drought stress. In addition, the upregulation of JA content in response to drought stress suggests an additional mechanism to the ABA signaling that further counteracts the drought stress effect by closing stomata and lowering transpiration rate in plant as previously reported by several authors (de Ollas & Dodd, 2016; Yoshida et al., 2020). SA has been previously proposed to protect the plants photosynthetic machinery and membrane integrity in response to environmental stresses including drought stress (Sharma et al., 2017). According to our results, SA production significantly increased in all B. napus cultivars with a higher accumulation in the sensitive cultivar GY605 than the tolerant cultivars (ZD622 and ZS11) under drought stress (Figure 8C). A similar additive response was previously observed in Brassica rapa (Lee et al., 2019), Avena sativa (Sanchez-Martin et al., 2015), and Triticum aestivum (Yadav et al., 2020) under drought stress indicating that SA production parallels the physiological impact of drought stress. Furthermore, cross-communication between SA and JA signaling pathways has been extendedly reported in response to environmental stresses, oriented to fine tune the transcriptional program determining the resistance mechanism in crop plants (Naeem et al., 2012; Kachroo et al., 2020).
5 CONCLUSIONS
In the present study, the B. napus cultivars showed differential responses to drought stress. Drought stress adversely affected the plant biomass accumulation and inhibited different physiological and biochemical processes, particularly in the cultivar GY605. Our data showed that, under drought stress, the activity of antioxidant enzymes (such as SOD, POD, CAT, GR), the TSPs, and proline content along with ABA and JA significantly increased in all B. napus cultivars. The maximum photosynthesis rate, phytohormone contents, and higher antioxidative enzymes activities provide a framework of drought tolerance in ZD622 and ZS11. However, reduced performance of Fv/Fm, photosynthetic pigment degradation, and decreased efficiency of Pn and Gs were observed in cultivar GY605. In addition, the pronounced accumulation of MDA and H2O2 contents in the cultivar GY605 depicts the most damaging effect of imposed drought stress in Brassica cultivars. Further information at the molecular level is required to explore the interacting mechanisms of drought-stimulated damages in tolerant and sensitive cultivars.
ACKNOWLEDGMENTS
This work was supported by the National Key Research and Development Program of China (2018YFD0100601), the National Natural Science Foundation of China (31950410554), the Jiangsu Collaborative Innovation Center for Modern Crop Production (JCIC-MCP), the Sino-German Research Project (GZ 1362), the Science and Technology Department of Zhejiang Province (2016C02050-8), and the Agricultural Technology Extension Funds of Zhejiang University. The authors thank Rong Jin from the Agricultural Experiment Station, Zhejiang University for her assistance during the experiment.
AUTHOR CONTRIBUTIONS
Ahsan Ayyaz and Weijun Zhou conceptualized and supervised the work. Ahsan Ayyaz performed experiments. Yilin Miao, Faisal Islam, and Fakhir Hannan helped in analyzing physiological parameters. Muhammad A. Farooq, Kangni Zhang, and Jianxiang Xu provided technical and helpful discussions. Ahsan Ayyaz, Weijun Zhou, and Muhammad A. Farooq wrote and edited the manuscript. All authors read and approved the manuscript.
Open Research
DATA AVAILABILITY STATEMENT
The data that support the findings of this study are available from the corresponding author upon reasonable request.


