Combined linkage mapping and association analysis reveals genetic control of maize kernel moisture content
Yinchao Zhang and Yu Hu contributed equally to this work.
Abstract
The free moisture in crop kernels after being naturally dried is referred to as kernel moisture content (KMC). Maize KMC reflects grain quality and influences transportation and storage of seeds. We used an IBM Syn10 DH maize population consisting of 249 lines and an association panel comprising 310 maize inbred lines to identify the genetic loci affecting maize KMC in three environments. Using the IBM population detected 13 QTL on seven chromosomes, which were clustered into nine common QTL. Genome-wide association analysis (GWAS) identified 16 significant SNPs across the 3 environments, which were linked to 158 genes across the three environments. Combined QTL mapping and GWAS found two SNPs that were located in two of the mapped QTL, respectively. Twenty-three genes were linked with the loci co-localized in both populations. Of these 181 genes, five have previously been reported to be associated with KMC or to regulate seed development. These associations were verified by candidate gene association analysis. Two superior alleles and one favorable haplotype for Zm00001d007774 and Zm00001d047868 were found to influence KMC. These findings provide insights into molecular mechanisms underlying maize KMC and contribute to the use of marker-assisted selection for breeding low-KMC maize.
Abbreviations
-
- ANOVA
-
- analysis of variance
-
- BLUP
-
- best linear unbiased prediction
-
- CV
-
- coefficient of variation
-
- CZ
-
- Chongzhou
-
- E
-
- environments
-
- FarmCPU
-
- fixed and random model circulating probability unification
-
- G
-
- genotypes
-
- GWAS
-
- genome-wide association study
-
- Hap
-
- haplotypes
-
- HY
-
- Hongya. HY, Hongya
-
- KMC
-
- Kernel moisture content
-
- LD
-
- linkage disequilibrium
-
- LOD
-
- logarithm of odds
-
- MAS
-
- marker-assisted selection
-
- MLM
-
- mixed linear model
-
- PCA
-
- principle component analysis
-
- PVE
-
- phenotypic variation explained
-
- Q-Q plot
-
- quantile-quantile plot
-
- QTL
-
- quantitative trait locus
-
- SNP
-
- single nucleotide polymorphism
-
- XSBN
-
- Xishuangbanna
-
- XX
-
- Xinxiang
-
- YA
-
- Ya'an
Introduction
Kernel moisture content (KMC) is an indicator of seed quality, and it affects seed vigor and safe storage conditions. Moisture content in dry seeds has a significant effect on the seed germination rate. KMC reaches a maximum at the 20th day after pollination and decreases before harvest (Borrás and Westgate 2006, Moreau et al. 2004). Among all agronomic traits, ear traits are the most important factors influencing KMC (Wang et al. 2015). Some irreversible physico-chemical properties in dried seeds are closely related to the moisture content of seeds (Malumba et al. 2014). Late embryogenesis abundant (LEA) proteins, plasma membrane intrinsic proteins, tonoplast intrinsic proteins and AP2/EREBP transcription factor superfamily proteins play key roles in regulating KMC (Capelle et al. 2010).
KMC is a quantitative trait that differs among cultivars (Zhang et al. 2017). Recently, some QTL for KMC have been reported in maize. In an F2:3 population of 181 lines, six major QTL explaining 10.4–19.7% of the phenotypic variation were detected for KMC (Sala et al. 2006). In a panel of 249 DH lines, 6 KMC QTL were mapped to five chromosomes, with one explaining 71% of the phenotypic variation (Song et al. 2016). However, these mapped QTL could not be used for marker-assisted breeding due to a lack of effective markers within the QTL. Because of the large confidence intervals of these QTL, few functional genes were cloned.
Combined linkage mapping and GWAS have been successfully used to dissect the genetic basis of complex agronomic traits in maize, and this has improved the accuracy and efficiency of QTL identification (Liu et al. 2020). Fifty-six loci influencing kernel size were simultaneously detected by QTL mapping and GWAS. Among these loci, zma-miR164e was also shown to control seed development in Arabidopsis (Liu et al. 2020). A kernel test weight (KTW)-associated SNP was detected by combined QTL mapping and GWAS, and three candidate genes were validated to affect KTW in a candidate gene association study (Zhang et al. 2020). This study used an association panel and an IBM Syn10 DH population to identify the QTL and the SNPs related to KMC by combined linkage mapping and GWAS in different environments. The objectives of this study were to (1) assess the phenotypic variations of KMC in two maize populations across three environments, (2) map the QTL controlling KMC and identify the SNPs associated with KMC, (3) detect the genetic loci co-localized in both populations and explore potential functional genes for KMC and (4) uncover the favorable intragenic alleles/haplotypes responsible for low KMC in maize. Our results will improve the understanding of molecular mechanisms underlying maize KMC and provide novel markers for developing better varieties.
Materials and methods
Plant materials
An IBM Syn10 DH population comprising 249 DH lines (Hussain et al. 2007) was used for QTL mapping. An association panel consisted of 310 temperate and tropical inbred lines, which were collected from the current Southwest China breeding program and specifically adapted to Southwest China (Zhang et al. 2016). They included some parents of commercialized hybrids in southwest China, and latest selected improved inbred lines (Zhang et al. 2016).
Field experiment
The IBM population was planted in three locations in China: Xinxiang (XX, E113°54′, N35°18′) in the Henan Province (June 2015–October 2015), Chongzhou (CZ, E103°67′, N30°63′) in the Sichuan Province (April 2015–August 2015) and Xishuangbanna (XSBN, E100°80′, N22°02′) in the Yunnan Province (November 2015–April 2016). The association panel was grown in the following environments of China: Ya'an (YA, E103°00′, N30°30′) in the Sichuan Province (April 2016–August 2016), Hongya (HY, E103°37′, N29°90′) in the Sichuan Province (April 2016–August 2016) and XSBN (November 2016–April 2017). In each population, all of the lines were planted in a completely randomized block with three replicates. Each line was grown in three rows with 14 plants per line. The distance between rows was 0.75 m, and the row length was 3 m. Standard cultivation was implemented at a density of 62 000 plants ha−1.
Phenotyping and data analysis
LDS-1G KMC tester (Shanghai Qingpu Oasis Test Instrument Co., LTD) was used to test the KMC phenotype. Firstly, the ears were harvested at physiological maturity stage. All the kernels of each ear were then used to measure KMC after oven drying at 37°C for 3 days. Three replications were set up for each line in every environment, and the mean value across these replications was taken as the final phenotypic value for QTL mapping and GWAS. SPSS Statistics 20.0 software (IBM, Armonk, NY, 2011) was used to perform analysis of variance (anova), including genotype, environment and genotype × environment. We used the mixed linear model of the R language package “lme4” to calculate the best linear unbiased predictions (BLUPs) of phenotypic data. Broad-sense heritability (H2) estimations for KMC were calculated as follows: H2 = σg2/(σg2 + σge2/n + σ2/nb) (Knapp et al. 1985), where σg2 represents the genetic variance, σge2 is the interaction variance of genotype × environment, n denotes the number of environments and b is the number of replications in each environment.
Linkage mapping
A high-density genetic map containing 6618 bin markers (http://www.iplantcollaborative.org/ci/discovery-environment) (Liu et al. 2015) was used for QTL mapping. QTL Cartographer version 1.17f was used for linkage analysis based on composite interval mapping (CIM) (Liu et al. 2017), with LOD = 2.5 as the threshold. Two QTL with a distance <10 cM were treated as the same QTL (Ma et al. 2018). Here, QTL were named according to the following rules: q + trait abbreviation-chromosome number-identified QTL serial number. For example, qKMC4-1, ‘q’ stands for QTL, ‘KMC’ is kernel moisture content, ‘4’ denotes chromosome 4 and ‘1’ represents the first QTL in chromosome 1.
Genome-wide association study (GWAS)
In the association panel, 56 110 SNPs were previously identified using the Illumina MaizeSNP50 Genotyping BeadChip (Zhang et al. 2016). This study filtered the 56 110 SNPs to retain the SNPs with missing rate <20% and minor allele frequency (MAF) ≥ 0.05. In total, 43 782 SNPs were retained for GWAS. The analysis of genetic structure in our previous study showed that this panel can be divided into three subpopulations (Zhang et al. 2020). Thus, ‘PCA = 3’ was adopted in GWAS of this study. To balance false negatives and false positives in GWAS, three models were compared: GLM (General Linear Model) + PCA, MLM (Mixed Linear Model), FarmCPU (Fixed and Random model Circulating Probability Unification) (Yu et al. 2006, Zhang et al. 2010, Liu et al. 2016). Herein, PCA was used as a covariate and calculated by GAPIT. GLM + PCA was implemented in TASSEL software, MLM and FarmCPU were run in R studio (version 3.5.3) software, GAPIT R package (Lipka et al. 2012) and FarmCPU R package (Liu et al. 2016) were used to conduct MLM and FarmCPU, respectively. Herein, only Mixed Linear Model (MLM) included a kinship matrix, which was calculated by GAPIT software. The QQ plot displays the fitting degree of observed and expected P-values. For a suitable GWAS model, the majority of the points in the QQ plot lie on the diagonal line because most of the tested SNPs are probably not associated with the trait (Liu et al. 2016). In this study, only FarmCPU model resulted in most points of the QQ plots on the diagonal, which was therefore considered as the optimal model for GWAS of maize KMC. The simpleM program in R studio (ver. 3.4.1) (Gao et al. 2010a) was utilized to perform multiple tests and to calculate the effective number of independent tests (Meff_G) (Randall et al. 2010, Gao et al. 2010a, Gao et al. 2010b). The P-value (0.05/N) was set as a significance threshold. Herein, Meff_G = 24 644, and thus, the P-value = 0.05/24644 = 2.01 × 10⁻⁶.
Candidate gene association study
We searched for all genes within the LD regions (220 Kb) of the top-significance (P < 2.01 × 10⁻⁶) SNPs and the SNPs co-localized in both populations. These were subsequently functionally annotated according to B73 AGPv4 genome (https://www.maizegdb.org/genome/assembly/Zm-B73-REFERENCE-GRAMENE-4.0). Genes that were previously found to correlate with KWC were considered as candidate genes for maize KWC. Sixty-three randomly selected lines from the association panel were subjected to PCR-amplification of the candidate genes for identifying the intragenic variations. The primers of PCR amplification are shown in Table S1. Sequence alignment was conducted using DNAMAN software (Zhang et al. 2020). DnaSP v5.0 was applied to identify sequence diversity. The identified nucleotide polymorphisms with MAF ≥5% were then used for candidate gene association analysis based on an MLM model in GAPIT software with the significance threshold set as P < 0.05/N.
Analysis of superior alleles
Herein, an allele related to a low KMC was considered as a favorable allele. The favorable allele ratio of each significant SNP was represented by the number of the lines containing favorable alleles divided by the total line number. The heatmap package program in the R (Mellbye and Schuster 2014) was used to generate the heat map to visualize superior allele percentage in each line.
Results
Phenotypic descriptions
In the IBM population, KMC ranged from 11.81 to 25.42% with a standard deviation (sd) of 1.67 to 2.17%. For the association panel, KWC ranged from 9.38 to 24.74% and the SD varied from 1.74 to 2.65% (Table 1). In both populations, the skewness values were between −1 and 1, indicating that KMC followed a normal distribution (Table 1). The proportion of phenotypic variance explained by the genotype was 65.19 and 76.14% in the IBM population and the association panel, respectively (Table 2). The H2 was 0.87 and 0.76 (Table 2), respectively, in the IBM population and the association panel, which suggested that genotype was the main factor affecting KMC. The variation coefficient of KMC ranged from 9.26 to 12.22% and 10.98 to 16.69%, respectively, in the two populations, indicating that the two population could be used for dissecting the genetic basis of KMC (Table 1). KMC was significantly associated with genotypes, environments and the interaction of genotype and environment in both the populations.
| Population | Env. | Mean (%) | sd | Max (%) | Min (%) | CV (%) | Kurtosis | Skewness |
|---|---|---|---|---|---|---|---|---|
| Association panel | HY | 15.85 | 2.65 | 23.96 | 10.3 | 16.69 | −0.23 | 0.45 |
| XSBN | 15.32 | 2.33 | 22.77 | 9.38 | 15.21 | 0.23 | 0.23 | |
| YA | 16.63 | 2.31 | 24.74 | 11.32 | 13.90 | 0.3 | 0.53 | |
| BLUP | 15.84 | 1.74 | 21.61 | 12.28 | 10.98 | 0.15 | 0.61 | |
| IBM Syn10 DH population | CZ | 17.99 | 1.67 | 23.53 | 14.51 | 9.26 | 0.47 | 0.64 |
| XX | 16.54 | 1.82 | 22.02 | 13.31 | 11.03 | −0.37 | 0.49 | |
| XSBN | 17.75 | 2.17 | 25.42 | 12.37 | 12.22 | 0.63 | 0.50 | |
| BLUP | 15.72 | 1.71 | 21.58 | 11.81 | 10.77 | 0.32 | −0.41 |
| Population | Source of variation | MS | F | PVE (%) | H2 |
|---|---|---|---|---|---|
| Association panel | E | 268.905 | 38.720*** | 4.67 | |
| G | 28.404 | 4.090*** | 76.14 | ||
| G × E | 3.569 | 0.514*** | 19.14 | 0.87 | |
| Error | 6.95 | 0.06 | |||
| IBM Syn10 DH population | E | 310.732 | 12 590.041*** | 7.94 | |
| G | 20.573 | 833.560*** | 65.19 | ||
| G × E | 4.893 | 198.284*** | 26.45 | 0.76 | |
| Error | 0.025 | 0.42 |
Detected QTL for KMC
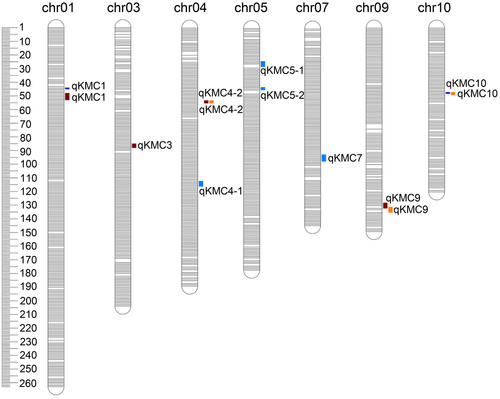
In the IBM population, 13 QTL controlled KWC across different environments, with the average phenotypic variation explanation (PVE) ranging from 3.90 to 9.99% (Table S2 and Fig. 1). Among them, qKMC9, identified in XX, had the largest LOD (6.47) and the highest PVE (9.99%). These QTL were distributed on all maize chromosomes, except chromosomes 2, 6 and 8. According to their physical intervals, the 13 QTL were clustered into 9 common QTL. Among them, qKMC1 (XX and XXBN), qKMC4-2 (XX and BLUP), qKMC9 (XX and BLUP) and qKMC10 (XXBN and BLUP) were consistently detected in two environments, which were considered as the environment-stable QTL for KWC. Of them, three (75%) showed negative additive effects on KWC, indicating that the larger KWC was mainly affected by the alleles from Mo17. Moreover, qKMC1 was located in qgm1-1 detected by Song et al. (2016), whereas qKMC4-2 overlapped with qgm1-1 as reported previously (Li et al. 2019).
Identified SNPs and candidate genes
Comparison of different models indicated that only the Q-Q plots resulting from FarmCPU displayed a sharp departure from the expected distribution of P-values exclusively in the tail area (Fig. S1). Therefore, the FarmCPU model could effectively control false positives and false negatives and was applied for detecting the associations between SNPs and KMC in this study.
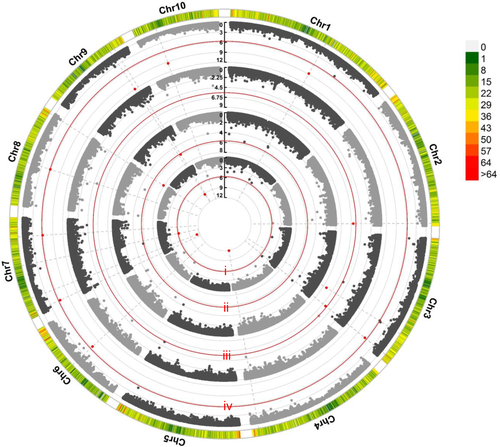
Across multiple locations, 16 significant (P < 2.01 × 10⁻⁶) SNPs were associated with KMC, and these occurred on all maize chromosomes, except chromosome 5 (Table 3 and Fig. 2). Among them, only one SNP (PZE-109078521) was repeatedly detected in two environments (HY and BLUP), which had the lowest P-value (1.05E-12, in BLUP). Based on a previously reported LD decay (220 Kb) of the association panel (Liu et al. 2020), 158 genes were identified for these significant SNPs (Table S3). According to the gene function reported previously, three genes Zm00001d007774 (Pentatricopeptide repeat protein, PPR), Zm00001d012585 (AP2/EREBP protein), and Zm00001d047868 (LEA protein) were selected as candidate genes strongly involved in maize KMC.
| SNP | Allele frequency | Env. | Chr | Position (bp) | P-value |
|---|---|---|---|---|---|
| SYN38863 | 16.45% (A), 79.35% (G) | BLUP | 1 | 173 661 199 | 1.6E-09 |
| PZE-102188267 | 80.00% (A), 16.13% (G) | XSBN | 2 | 232 365 605 | 0.000000526 |
| PZE-103118399 | 75.16% (A), 19.68% (G) | XSBN | 3 | 177 136 586 | 6.05E-09 |
| PZE-103174823 | 26.45% (A), 69.35% (G) | BLUP | 3 | 221 275 467 | 0.000000469 |
| SYN33544 | 15.16% (A), 82.26% (G) | XSBN | 3 | 221 560 240 | 0.000001 |
| PZE-104141106 | 66.77% (A), 28.39% (G) | HY | 4 | 229 405 483 | 1.35E-12 |
| PZE-106037314 | 90.32% (A), 8.06% (G) | BLUP | 6 | 85 211 749 | 0.000000302 |
| PZE-107027810 | 12.90% (A), 82.26% (C) | HY | 7 | 33 054 289 | 7.28E-12 |
| PZE-107045024 | 33.87% (A), 59.68% (G) | HY | 7 | 91 973 160 | 0.00000119 |
| SYN18432 | 13.23% (A), 80.97% (G) | BLUP | 7 | 142 811 366 | 0.00000125 |
| SYNGENTA6494 | 33.55% (A), 62.58% (G) | BLUP | 7 | 8 701 128 | 0.000000615 |
| PZE-108046673 | 84.19% (A), 12.9% (G) | BLUP | 8 | 77 746 276 | 0.0000017 |
| SYNGENTA5510 | 88.06% (A), 11.29% (G) | YA | 8 | 171 778 606 | 0.000000013 |
| PZE-109078521 | 84.52% (A), 8.71% (G) | HY, BLUP | 9 | 126 674 200 | 4.93E-10, 1.05E-12 |
| SYN24754 | 71.94% (A), 24.52% (G) | YA | 9 | 135 153 221 | 0.00000136 |
| PZE-110028318 | 82.9% (A), 12.58% (G) | BLUP | 10 | 38 935 323 | 3.33E-10 |
| SYNGENTA10955 | 41.29% (A), 55.16% (G) | GWAS, QTL | 1 | 15 170 841 | 0.00092 |
| PZE-107113180 | 67.10% (A), 30.00% (G) | GWAS, QTL | 7 | 162 036 118 | 0.0000493 |
Candidate genes co-localized by GWAS and QTL mapping
These loci, which were repeatedly identified in different populations, were considered to have stable effects on the investigated phenotypes (Liu et al. 2020). In this study, we paid close attention to loci co-localized by both populations. According to the previous study (Liu et al. 2020), we set P = 1 × 10⁻³ as the threshold to identify the population-stable SNPs (Liu et al. 2020). As a result, two SNPs (SYNGENTA10955 and PZE-107113180) were located in qKMC1 and qKMC7, respectively. In the LD regions of these SNPs, 23 genes were identified (Table S3), of which Zm00001d021988 and Zm00001d027855 were both annotated as transcription factor, and Zm00001d021993 and Zm00001d027854 belong to sugar transporter family.
Intragenic variations affecting KMC
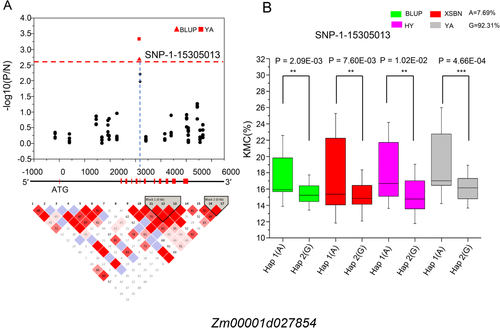
A total of 181 genes were located within the LD regions of the top-significance SNPs or the co-localized SNPs in two populations. In previous studies (Gutiérrez-Marcos et al. 2007, Huang et al. 2012, Sosso et al. 2015, Doll et al. 2017, Chen et al. 2018), the orthologs of the five genes (Zm00001d007774, Zm00001d027854, Zm00001d047868, Zm00001d021993 and Zm00001d012585) have been demonstrated to regulate KMC or seed development in plant species (Table 4). In order to verify the reliability of the five candidate genes, we separately calculated the linkage coefficients (D') between the significant SNPs and each of the SNPs located in the above five genes. The D' for the selected genes all showed high values (D' > 0.7), suggesting these five genes could be considered as KMC-associated candidate genes. To further confirm the function of these genes on maize KWC, we individually conducted candidate gene association analysis for each of them in 63 randomly selected lines. Thirty variations (29 SNPs and 1 InDel) were found in the gene regions or the promoters (the upstream 2000 bp) of four genes except Zm00001d021993. Three SNPs were significantly (P < 0.05/N, N is the number of SNP) associated with KMC, including two (SNP-2-239 385 085 and SNP-2-239 384 971) for Zm00001d007774, one (SNP-1-15 305 013) for Zm00001d027854 (Table S4). For Zm00001d027854, SNP-1-15 305 013 was identified in BLUP and YA environments (Fig. 3A), which divided the 63 lines into 2 groups, with one group containing the allele A and the other allele G. These lines with “A” had significantly (P ≤ 0.01) higher KMC than those with ‘G’ across all of the locations and the BLUP model (Fig. 3B). For Zm00001d007774, SNP-2-239 385 085 was repeatedly identified in three environments (YA, HY and BLUP), SNP-2-239 384 971 was associated with KMC only in HY. The two SNPs in Zm00001d007774 formed two main haplotypes in these lines, including Hap 1 (CG) and Hap 2 (TT). The phenotypic value of Hap 1 was significantly (P < 0.05) greater than that of Hap 2 across all of the environments, except YA (P = 0.056; Fig. S2). These findings suggested that Zm00001d007774 and Zm00001d027854 were potential functional genes regulating maize KMC.
| Candidate gene | Chr | Method | Interval (bp) | Function |
|---|---|---|---|---|
| Zm00001d027854 | 1 | GWAS, QTL mapping | 15 301 583-15 306 925 | Sucrose transporter1 |
| Zm00001d007774 | 2 | GWAS | 239 384 899-239 386 545 | Pentatricopeptide repeat protein |
| Zm00001d021993 | 7 | GWAS, QTL mapping | 167 643 773-167 647 474 | Nucleotide sugar transporter-KT |
| Zm00001d012585 | 8 | GWAS | 176 892 933-176 893 658 | AP2/EREBP transcription factor superfamily protein |
| Zm00001d047868 | 9 | GWAS | 143 837 505-143 839 327 | Late embryogenesis abundant protein |
Discussion
Abundant phenotypic variations of KMC in both populations
Abundant phenotypic variations are important factors for dissecting the genetic basis of traits. The IBM population has a high recombination rate and extensive phenotypic variability (Zhang et al. 2010), which contributed to the identification of important genes. In our study, KMC in the IBM population ranged from 11.81 to 25.42% with coefficients of variation (CV) being 9.26–12.22%, which showed greater variation than the other traits in the population (Zhang et al. 2016, Ma et al. 2018, Liu et al. 2020). The association panel, consisting of SS, NSS and tropical groups, also has high genetic diversity (Zhang et al. 2016). In this study, the phenotypic value of KMC varied from 9.38 to 24.74% with large CV (10.98–16.69%) in the association panel (Table 1). The abundant phenotypic variations in both populations were useful for detecting the genetic basis of KMC.
Genetic architecture of maize KMC
This study used QTL mapping and GWAS to dissect the genetic basis of maize KMC in a segregation population and an association panel under multi-environment exposure. Only a few loci were repeatedly detected across different environments including qKMC1, qKMC4-2, qKMC9 and PZE-109078521, suggesting that environment was an important factor affecting the KMC. Further, only two SNPs (SYNGENTA10955 and PZE-107113180) were co-localized by QTL mapping and GWAS, which were located in qKMC1 and qKMC7, respectively, on chromosomes 1 and 7. The heterogeneity between the two populations probably accounted for the few common loci. For these candidate genes co-localized by QTL mapping and GWAS, we found that two intragenic SNPs (SNP-1-15 305 013 within Zm00001d027854 and SNP-9-143 838 480 within Zm00001d047868), and one haplotype (TTG for Zm00001d047868) regulated maize KMC. The common QTL and stable SNPs above should be prioritized in marker-assisted breeding to improve KMC in maize.
Utilization of favorable alleles in maize elite lines
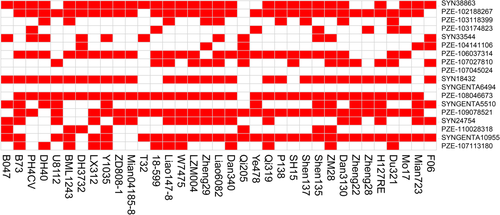
Thirty-five lines from the association panel acted as the parents of commercialized varieties (Fig. 4), which enabled us to estimate the utilization of favorable alleles during maize breeding programs. The favorable allele ratio of each significant SNP, which was represented by the number of the lines containing favorable alleles divided by the total line number, ranged from 0 (SYNGENTA6494) to 91.43% (PZE.108046673) among these 18 significant/co-localized SNPs. The percentage of favorable alleles exceeded 80% at six loci (SYN38863, PZE.102188267, SYN18432, PZE.108046673, PZE.109078521 and SYNGENTA10955). However, the proportion of favorable alleles was ≤20% at five loci (PZE.107045024, SYNGENTA6494, PZE.104141106, PZE.110028318, and PZE.104141106). Notably, two SNPs (PZE.107045024 and SYNGENTA6494) had no favorable alleles in any of these lines, implying that they failed to be selected during maize breeding. Each elite line contained the favorable alleles of 27.8% (T32)-66.7% (ZM28) loci. Of them, 18 lines possessed the favorable alleles of ≥50% loci, whereas the other 17 lines contained <50% favorable alleles. In future studies, improvement of the KMC phenotype in commercialized varieties could be achieved by the integration of more favorable alleles into elite maize lines.
Candidate genes involved in maize KMC
Within the LD regions of the significant/co-localized loci, 181 genes were identified, of which 5 were reported to be involved in KMC of plants. Zm00001d007774 belongs to the PPR family, which plays a role in RNA maturation through intron splicing (Gutiérrez-Marcos et al. 2007). PPR proteins affect seed development, especially endosperm development (Gutiérrez-Marcos et al. 2007, Sosso et al. 2012, Zhu et al. 2019). It is widely accepted that a close relationship exists between endosperm and KMC (Doll et al. 2017). Accordingly, Zm00001d007774 was assumed to influence maize KMC by regulating endosperm development. Zm00001d012585 was annotated as AP2/EREBP, which mediates plant growth and participates in the defense against biotic and abiotic stress (Sharoni et al. 2012, Qu et al. 2019, Song et al. 2005). AP2/EREBP controls the oil content of seeds (Sun et al. 2017, Chen et al. 2018), and increases seed size and final biomass by affecting cell proliferation in Arabidopsis (Li et al. 2013, Lei et al. 2019). Zm00001d047868 encodes a LEA protein, which forms at the late stage of seed development (Huang et al. 2012). It is characterized by high hydrophilicity and thermal stability and induced and synthesized by ABA and water stress to protect cells from dehydration (Huang et al. 2012, Jin et al. 2013, Wu et al. 2015). Therefore, Zm00001d047868 was presumed to regulate maize KMC by synthesizing LEA protein. Zm00001d027854 and Zm00001d021993 were annotated as sucrose transporter 1 and nucleotide sugar transporter-KT, respectively, which were reported to participate in carbohydrate metabolism (Sosso et al. 2015). Carbohydrate metabolism affects seed development during the filling stage of maize and rice.
Author contributions
L.M., Y.S. and G.P. conceived and designed the experiments; Y.Z., Y.H. and Z.G. performed the experiments; Y.Z., P.L., Y.H. and C.Z. analyzed the data; P.L., S.G., H.P. and C.Y. contributed reagents, materials, and analysis tools, respectively; Y.Z. and L.M. wrote the paper.
Acknowledgements
This work was supported by the Major Project of China on New Varieties of GMO Cultivation (2016ZX08003003) and the Science and Technology Research Program of Sichuan Municipal Education Commission (2018JY0170).
Open Research
Data availability statement
The data that support the findings of this study are available from the corresponding author upon reasonable request


