Comparative physiological and proteomic analysis deciphering tolerance and homeostatic signaling pathways in chrysanthemum under drought stress
Edited by M. Ahanger
Abstract
Drought is increasing prevalently, mostly due to global warming, and harmful effects associated with drought stress include a reduction in the developmental phases of the plant life cycle. Drought stress affects vital metabolic processes in plants such as transpiration, photosynthesis and respiration. The other physiological and cellular processes like protein denaturation and aggregation are also affected by drought. Drought stress severely affects the floral industry by reducing the yield of flowers and among them is chrysanthemum (Dendranthema grandiflorum). In this study, we determined the critical signaling pathways, tolerance mechanism and homeostatic maintenance to drought stress in chrysanthemum. We compared the proteome of chrysanthemum leaves under drought stress. Among 250 proteins on 2DE gels, 30 protein spots were differentially expressed. These proteins were involved in major signaling pathways including, stress response, flower development and other secondary metabolism like physiological transport, circadian rhythm, gene regulation, DNA synthesis and protein ubiquitination. A reduction in a biomass, flower development, photosynthesis, transpiration, stomatal conductance, PSII yield and stomatal index was also observed in our results. Moreover, the stress markers and leaf water potential were also analyzed to depict the level of stress tolerance in chrysanthemum. Our data suggested that chrysanthemum plants developed reactive oxygen species and revealed signaling pathways to cope with drought stress. These results, thus, provide crucial information about how chrysanthemum plants respond to drought stress to maintain homeostasis.
Abbreviations
-
- 2-DE
-
- second dimensional gel electrophoresis
-
- ACN
-
- acetonitrile
-
- APX
-
- ascorbate peroxidase
-
- BSA
-
- bovine serum albumin
-
- CAT
-
- catalase
-
- CHAPS
-
- 3-(3-cholamidopropyl) dimethylammonio-1-propanesulfonate
-
- IEF
-
- isoelectric focusing
-
- IPG
-
- immobilized pressure gradient
-
- MALDI-TOF MS
-
- matrix-assisted laser desorption/ionization time of flight mass spectrometer
-
- MDA
-
- malondialdehyde
-
- ROS
-
- reactive oxygen species
-
- SDS-PAGE
-
- sodium dodecyl sulphate polyacrylamide gel electrophoresis
-
- SOD
-
- superoxide dismutase
Introduction
Abiotic stresses are key restraints to crop production and food security worldwide and the situation has drastically increased due to climate change. Among abiotic stresses, drought is one of the most primitive fears that are having a significant impact on growth, development and productivity on crops (Lesk et al. 2016, Fahad et al. 2017). In tropical countries, heat and drought are prevalent in the loss of crop productivity due to less or change in rainfall patterns. Drought stress causes a substantial reduction in crop yields via negative impacts such as plant growth, physiology and reproduction (Yordanov et al. 2000, Barnabas et al. 2008, Fahad et al. 2017, Cheabu et al. 2018). The extreme drought has a dramatic impact on plant productivity (Kumudini et al. 2014, Barlow et al. 2015).
The response to drought varies among crop species throughout their life cycle and is primarily a phenological response. The initial effect of drought stress on a crop is poor germination and impaired seedling establishment. Several studies have reported a negative impact of drought stress on germination and seedling (Kaya et al. 2006, Farooq et al. 2009, Muneer et al. 2016). High drought also results in limitation of cell growth due to loss of turgor pressure (Taiz and Zeiger 2016). Drought stress, therefore, results in impaired development and elongation of cells by limiting the water transport (Nonami 1998). Additionally, biomass, height, leaf size and stem girth are also affected severely in drought-stressed plants (Zhao et al. 2006, Khan et al. 2015). Moreover, drought stress inhibits the nutrient uptake like nitrogen, magnesium and calcium. Drought stress also affects the soil–root microbe interaction and eventually inhibits the formation of root nodules in leguminous plants (Ladrera et al. 2007). Drought stress affects plants' metabolic processes like photosynthesis, opening and closing of a stoma, and transpiration (Nonami 1998, Zhao et al. 2006, Farooq et al. 2007, Ladrera et al. 2007, Wahid et al. 2007, Khan et al. 2015, Muneer et al. 2016, Taiz and Zeiger 2016).
Moreover, drought stress often leads to cellular damages, which result in the formation of reactive oxygen species (ROS). These ROS pose a severe threat to cell functioning by damaging lipids and proteins (Liu et al. 2007, Wahid et al. 2007). To cope with oxidative stress, plants usually rely on the antioxidative defense mechanism system, which is either enzymatic or non-enzymatic. A major enzyme involved in defense mechanism of oxidative stress includes superoxide dismutase (SOD), ascorbate peroxidase (APX), catalase (CAT) and glutathione reductase (GR) (Moller et al. 2007, Biyani et al. 2019). Several studies have depicted the role of defense enzymes mechanisms in plants under abiotic stresses (Biyani et al. 2019) at a physiological and cellular level. However, to investigate the more profound role of defense mechanisms, proteomics is an ideal tool that can reveal not only critical signaling pathways but also how plants maintain homeostasis during stress conditions. Several number of studies on proteomic are carried out under drought stress in model plants such as tomato (Muneer et al. 2016), wheat (Zhang et al. 2018) and Arabidopsis (Rocco et al. 2013). However, a limited number of proteomic studies are on horticultural plants, in particular flowering plants. Therefore, the present research is on chrysanthemum, one of the essential horticultural crops.
Chrysanthemum (Dendranthema grandiflorum) is a plant of high ornamental and economic values due to esthetic beauty, color and fragrance. Chrysanthemum has some medicinal properties and is a natural insecticide. Chrysanthemum is widely grown in Asian countries like Korea, Japan, China and India and some parts of Europe like France, Belgium, Italy and Spain. However, the production of chrysanthemum decreased the past years due to temperature fluctuations. In our previous studies, we studied how chrysanthemum flowering is affected by light conditions and indicate the measures to be taken to improve or initiate early flowering (Park et al. 2015). In this study, we focused on analyzing signaling pathways deciphering tolerance and homeostatic maintenance of chrysanthemum under drought stress.
Materials and methods
Plant materials and treatments
Young chrysanthemum (Dendranthema grandiflorum) ‘Gaya Yellow’ (short-day plant) plants were propagated in flower nursery pots in a Polyhouse for initiating firm roots and flowers for 2–3 weeks. The pots were prepared using red soil, sand (for proper aeration and moisture content) and vermicompost (for proper nutrients) in the ratio of 1:1:1. The plants were propagated in pots using terminal cutting taken from healthy stock plants. The potted plants were watered continuously using drip irrigation until the flowering stage. The temperature was set to 30–35°C with a relative humidity of 70–90% (monitored with the help of digital temperature sensor; Richie HTC infrared/Optical thermometer). The pH of the soil was maintained at 6.5. As the chrysanthemum is a short-day plant, the potted plants were covered using a black net to provide 11–12 hours of darkness. During the blooming stage, the pots were divided into two groups: one as a control and another set were induced with drought stress. Around 50 pots, each with a single plant, underwent a drought treatment and 50 were well-watered to evaluate the morphological changes. For physiological and molecular analysis, four independent biological replicates (four pots with single plant) were considered for experimental analysis. Drought stress in plants was induced using 20% of polyethylene glycol-6000 (PEG) and monitored for a week. For proteomic and biochemical measurements, leaves were collected and immediately frozen in a liquid N2 and stored in deep-freezer (−80°C) for further analysis.
Morphological measurements
Chrysanthemum plants under controlled and drought stress conditions were monitored morphologically and were photographed. The plants were uprooted from pots, washed carefully with distilled water and weighed on a digital weighing balance for fresh weight. For dry mass, the uprooted plants were incubated in an oven at 65°C to remove the moisture content for 48 h and then weighed subsequently. The flowers were also counted on each plant and for each treatment. The length of root and shoot were measured with the help of a measuring scale.
Physiological measurements
Malondialdehyde content (MDA content)
Thiobarbituric acid reactive substances (TBARS) were determined by the method given by Heath and Packer (1968). One gram of fresh tissue was homogenized in liquid nitrogen with a chilled pestle and mortar. The powdered sample was centrifuged in a 0.1% trichloroacetic acid (TCA) at 7000g for 5 min. The resulting 1 ml of supernatant was added to 0.5% thiobarbituric acid (TBA) and incubated for 30 min in a water bath at 100°C. After incubation, the mixture was cooled down to room temperature, and absorbance was read at 532 nm and corrected for unspecific turbidity after subtraction from the value obtained at 600 nm.
Leaf water potential
Leaf water potential (Ψw) was immediately evaluated as the leaf sheath xylem-pressure potential determined using a pressure chamber (PMS Instrument Co.).
Measurement of photosynthetic activity
Photosynthetic rate, transpiration rate and stomatal conductance were measured using an LI-6400XT portable photosynthesis measurement system (LI-COR). Gas exchange was measured on the fully expanded mature leaves at 20°C inside the clutch with CO2 concentration maintained at 600 μmol mol−1. Chlorophyll fluorescence (Fv/Fm) was measured by using a PAM 2000 chlorophyll fluorescence meter (Heinz Walz GmbH). The leaves were adapted to dark conditions for 30 min before measurement. The maximum fluorescence (Fm) and minimum fluorescence (F0) were determined by applying a saturating light pulse (20 kHz) of 1100 μmol m−2 s−1 PPF for 3 μs. The maximum PS II quantum yield (Fv/Fm) was calculated as Fv/Fm = (Fm−F0)/Fm.
Stomatal study
For stomatal observation, a thin layer of leaf tissues was carefully cut. It was laid on a glass slide, covered with a coverslip by adding few drops of water, and was observed under a light microscope under 40× magnification as described in our previous studies (Muneer and Lee 2018). Stomatal index is the percentage of total number of stomata to the total number of epidermal cells per unit area of a leaf.
The stomatal index was calculated by dividing the number of stomata counted by 10 times the area of 1 grid square.
Pigment analysis
The photosynthetic pigments like chlorophyll and carotenoid content were determined using dimethyl sulfoxide (DMSO) as described by Hiscox and Israelstam (1979). One gram of a leaf sample was incubated in 10 ml of DMSO in an oven at 65°C for 1 h to leech out the pigments from leaves. After incubation, the absorbance of leeched pigments was observed using a UV–VIS spectrophotometer at 410, 510, 663 and 445 nm and recorded accordingly. Each pigment was calculated by formulae given by Arnon (1949).
Proteomic analysis
Protein extraction and sample preparation
The phenol-based method with minor modifications (Lee et al. 2015) extracted total proteins from chrysanthemum leaves. In brief, leaf material was ground to a fine powder in liquid nitrogen and transferred to 50-ml falcon tubes. The powdered tissues were immediately suspended in protein extraction buffer containing 0.9 M sucrose, 0.1 M Tris–HCl, pH 8.8, 10 mM EDTA, and 0.4% (v/v) β-mercaptoethanol and incubated on ice for 10 min. Afterward, an equal volume of Tris-buffered phenol, pH 8.8, was added and vigorously vortexed. For aqueous and organic phase separation, the sample was centrifuged for 20 min 3500 g. The phenolic phase on top of the falcon tube was carefully recovered in a new tube and was then back-extracted in the extraction buffer 3–4 times. The resulting supernatant was precipitated overnight at −20°C in 4 volumes of precipitation solution containing 100 mM ammonium acetate prepared in methanol. The protein pellets collected were washed 4–5 times in precipitation solution and cold acetone. The resulting protein pellet was dried and solubilized in a lysis buffer containing 9 M urea, 2% CHAPS, 0.2% (w/v) Pharmalyte, pH 3–10, 50 mM DTT. A Bradford method (1976) was followed to quantify the proteins.
Isoelectric focusing, second dimensional gel electrophoresis and image analysis
Isoelectric focusing (IEF) and 2-dimensional SDS-PAGE (2-DE) were performed, as described previously (Lee et al. 2012). Four hundred micrograms of total protein extract were rehydrated on Bio-Rad 11-cm immobilized pH gradient gel strip (pH 4–7). IEF conditions were as follows: 250 V for a conditioning step of 15 min, followed by a slow ramping step to 10 000 V for 3 h and finally 10 000 V for 9 h. After focusing, the IPG strips were equilibrated and further processed for second dimension and image analysis as described previously (Lee et al. 2012).
MALDI-TOF/TOF MS identification of protein spots
Excised protein spots were subjected to in-gel digestion, according to Kim et al. (2007) with minor modifications. The tryptic digested proteins (peptides) were subjected to MALDI-TOF/TOF-MS (ABI 4800, Applied Biosystems; Muneer et al. 2016). The spectra were calibrated with the peptide calibration standard kit (Mass standard kit, 4700 proteomics analyzer; calibration mixture 1). At least the 12 most intense ions per peptide with high signal/noise ratios were selected for subsequent MS/MS analysis in 1 KV mode using 1000 consecutive laser shots. The MS/MS spectra were searched against Swissport/Uniport/NCBI Arabidopsis database by protein Pilot v.3.0 software (AB Sciex) using MASCOT as a search engine (ver. 2.3.0, MatrixScience). The search parameters used for protein identification were fixed modifications of carbamidomethylation of cysteines, and fragment ion mass tolerances 50 ppm, maximum trypsin missed cleavage-1 and instrument type-MALDI-TOF/TOF. Only significant hits, as identified by the MASCOT probability analysis (P < 0.05), were accepted.
Data processing, functional annotations and protein–protein interactions
The functional annotations of the identified proteins were carried out using panther gene analysis (http://pantherdb.org/). The functions and interactions of identified proteins, a protein–protein interaction network (PPI) was analyzed with an online tool STRING 9.0 (http://string-db.org).
Statistical analysis
Statistical analysis was performed using statistical analysis software (SAS) tool (USA). A complete randomized design was utilized with four biological replicates with a significant level set at P < 0.05. All the results were expressed as the mean ± se. Differences between protein spots in all treatments were determined using a two-way analysis of variance followed by a Student's t-test with P < 0.05 as the limit of significance.
Results
Effect of drought on morphology of chrysanthemum
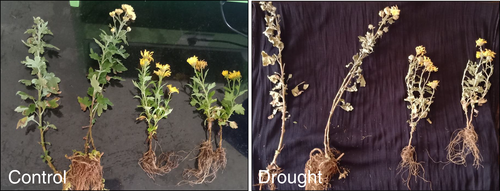
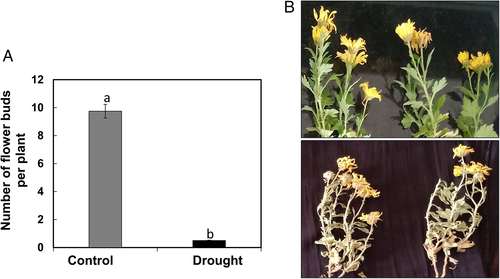
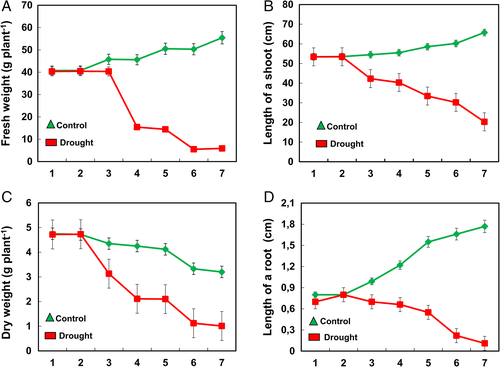
The morphological analysis carried out in chrysanthemum to drought stress showed that plants dried out with necrotic lesions on leaves (Fig. 1). The flowers in drought-stressed chrysanthemum observed were either less in number or thoroughly dried (Fig. 2). The biomass of plants did not change until day 3 of drought stress; however, a drastic reduction from day 3 to day 7 was observed (Fig. 3). Similarly, the length of shoot and root reduced in plants compared to control from day 3 to day 7 of drought stress (Fig. 3).
Effect of drought on physiological parameters of chrysanthemum
Oxidative damage
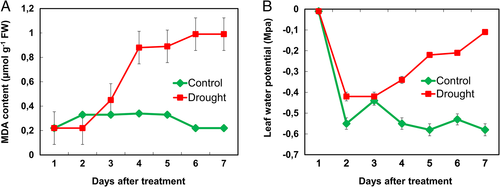
We examined one of the stress markers, malondialdehyde content (MDA) (Fig. 4A), to analyze the oxidative damage. We observed that MDA content did not change significantly during the initial time of drought-stressed chrysanthemum plants. However, when the time of drought increased, the MDA content increased and reached a maximum of 95% compared to controlled plants.
Leaf water potential (Ψw)
The leaf water potential (Ψw) gradually decreased in the drought-stressed chrysanthemum plants, while no significant changes occurred in the well-watered ones (Fig. 4B). After 7 days of drought treatment, the Ψw in well-watered plants reached a minimum value of −0.75 MPa, while the values in drought-stressed plants were − 0.1 (Fig. 4B).
Photosynthetic activity, stomatal conductance, transpiration and PSII yield
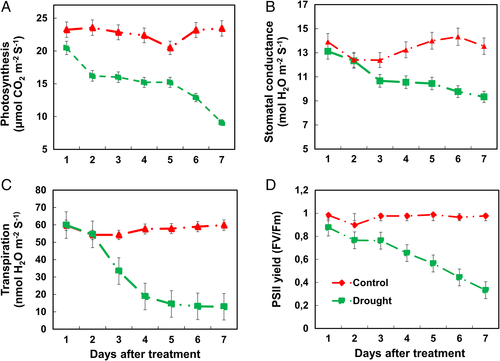
The chrysanthemum plants under drought conditions showed a significant change in photosynthetic activity, stomatal conductance and transpiration rate (Fig. 5). At the initial stage of drought stress (2 days), a slight decrease in photosynthesis, stomatal conductance and transpiration rate was observed. After that, it reduced to the maximum range at a later stage of drought stress. The lowest range of photosynthesis, stomatal conductance and transpiration rate in chrysanthemum plants was after 7 days of drought stress. Similarly, PSII yield was lower after 2 days of drought stress and reduced to the maximum at 7 days of drought stress (Fig. 5C).
Observation of stomata and pigment analysis
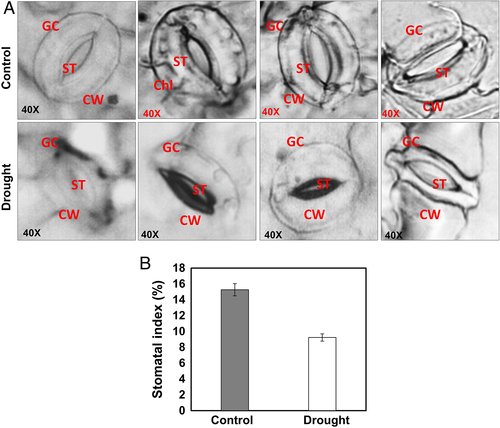
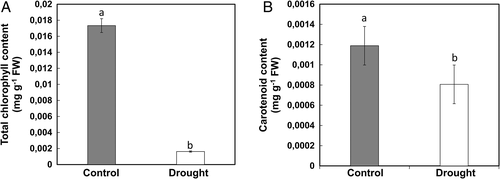
The stomata in control plants showed more stomata compared to drought stress (Fig. 6) and indicated the stomatal index was much higher in control plants than in stressed ones (Fig. 6B). The stomata were also observed open in control, whereas closed in stressed ones (Fig. 6A). The photosynthetic pigments like total chlorophyll and carotenoid content were also significantly decreased by 90 and 27%, respectively, under drought stress compared to control (Fig. 7).
Effect of drought on the proteome of chrysanthemum: identification and functional classification
Our morphological and physiological data revealed that chrysanthemum induced oxidative stress starting from day 1 of drought treatment and with more severe effects on day 7. To overcome the oxidative damage, plants respond by reprograming their transcriptome, proteome, and metabolome, which alter their proteins, lipids, and essential metabolites. Numerous proteomic studies on signaling pathways in many model crops are documented, while there is a limited report on the proteome of horticultural plants.
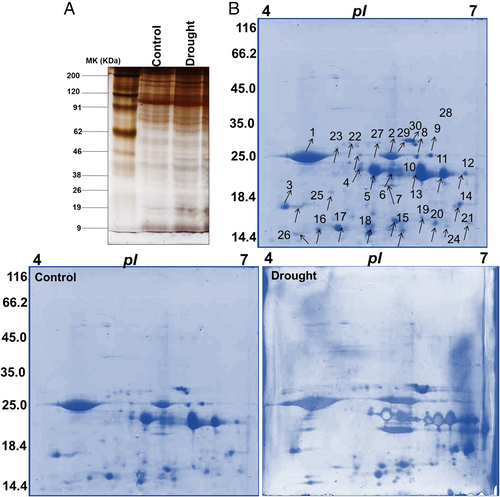
The total protein from severe drought-stressed plants (7 days after drought) was first evaluated by first-dimensional gel electrophoresis (SDS-PAGE) to check the protein enrichment between control- and drought-stressed plants (Fig. 8A). Comparative proteomic analysis of chrysanthemum under drought stress was performed using IPG strips (pI 4–7; Fig. 8B). On the 200–250 protein spots on protein maps, 30 protein spots were differentially expressed and subsequently analyzed by progenesis software (GE Healthcare). Spot quantification and fold changes between differentially expressed proteins are presented in Table 1.
| Spot no. | Protein name | Plant species | gi number | Protein score | Biological function | Mr value | Calcu. pI/ Exp. pI | Sequence coverage |
|---|---|---|---|---|---|---|---|---|
| 1 | Probable disease resistance protein | Prunus mume | gi|645 272 760 | 76 | Stress response | 40 819 | 8.9/4.5 | 68 |
| 2 | Paladin isoform X1 | Eucalyptus grandis | gi|702 489 295 | 46 | — | 67 832 | 6.7/4.9 | 53 |
| 3 | Root phototropism protein, putative | Ricinus communis | gi|255 568 128 | 50 | Circadian rhythm | 25 891 | 8.8/5.2 | 67 |
| 4 | Glu S.griseus protease inhibitor-like | Musa acuminata | gi|695 018 764 | 52 | Stress response | 27 083 | 4.9/5.5 | 59 |
| 5 | ATP-dependent 6-phosphofructokinase | Brassica napus | gi|674 952 919 | 57 | Physiological transport | 16 772 | 7.8/6.2 | 63 |
| 6 | Pentatricopeptide repeat-containing protein | Ricinus communis | gi|255 586 139 | 52 | Gene regulation | 40 309 | 8.2/6.3 | 69 |
| 7 | Vrn1, partial | Lolium multiflorum | gi|262 092 699 | 51 | Flower development | 43 360 | 4.9/4.9 | 70 |
| 8 | Actin-binding FH2 protein | Arabidopsis thaliana | gi|42 569 297 | 52 | Ion binding | 24 634 | 9.3/4.5 | 75 |
| 9 | Vrn1, partial | Lolium multiflorum | gi|262 092 699 | 51 | Flower development | 43 360 | 4.9/4.9 | 70 |
| 10 | Uncharacterized protein | Tarenaya hassleriana | gi|729 365 036 | 72 | — | 49 204 | 9.3/5.0 | 51 |
| 11 | Vacuolar protein sorting-associated protein 53 A isoform | Vitis vinifera | gi|731 403 643 | 52 | Stress response | 45 716 | 5.3/5.1 | 72 |
| 12 | Craniofacial development protein 1-like | Brassica rapa | gi|685 353 375 | 151 | Cell development | 57 732 | 7.8/5.2 | 67 |
| 13 | Reverse transcriptase (RNA-dependent DNA polymerase) | Oryza sativa | gi|50 881 459 | 54 | DNA synthesis | 38 475 | 6.2/5.3 | 79 |
| 14 | Actin-depolymerizing factor 5 | Fragaria vesca | gi|470 107 045 | 48 | Ion binding | 16 409 | 5.8/4.5 | 89 |
| 15 | Zinc finger AN1 and C2H2 domain-containing stress-associated protein 16-like | Glycine max | gi|356 572 040 | 49 | Stress response | 18 063 | 9.6/4.6 | 85 |
| 16 | Vrn1, partial | Lolium multiflorum | gi|262 092 699 | 51 | Flower development | 43 360 | 4.9/4.9 | 70 |
| 17 | RNA polymerase B | Zingiber mioga | gi|314 913 423 | 64 | Stress response | 66 044 | 8.9/5.5 | 48 |
| 18 | Translational elongation factor Tu (chloroplast) | Lobosphaera incisa | gi|725 650 968 | 51 | Translation | 26 725 | 5.2/6.0 | 70 |
| 19 | Uncharacterized protein | Citrus sinensis | gi|568 859 578 | 55 | — | 180 152 | 5.9/6.2 | 30 |
| 20 | RNA polymerase B | Zingiber mioga | gi|314 913 423 | 66 | Stress response | 11 425 | 5.3/6.8 | 90 |
| 21 | Probable disease resistance protein | Prunus mume | gi|645 272 760 | 57 | Stress response | 66 589 | 8.2/7.0 | 40 |
| 22 | F-box/kelch-repeat protein | Medicago truncatula | gi|357 456 453 | 52 | Protein ubiquitination | 40 101 | 9.1/4.5 | 51 |
| 23 | Vrn1, partial | Lolium multiflorum | gi|262 092 699 | 51 | Flower development | 43 360 | 4.9/4.9 | 70 |
| 24 | Vrn1, partial | Lolium multiflorum | gi|262 092 699 | 51 | Flower development | 43 360 | 4.9/4.9 | 70 |
| 25 | RNA polymerase B | Zingiber mioga | gi|314 913 423 | 70 | Stress response | 37 446 | 6.2/4.6 | 65 |
| 26 | Vrn1, partial | Lolium multiflorum | gi|262 092 699 | 51 | Flower development | 43 360 | 4.9/4.9 | 70 |
| 27 | Zinc finger MYM-type protein 1-like | Solanum tuberosum | gi|565 380 971 | 41 | Stress response | 28 185 | 7.6/5.1 | 56 |
| 28 | Thioredoxin-like protein | Viola biflora | gi|272 715 976 | 54 | Stress response | 96 184 | 6.0/4.9 | 46 |
| 29 | RNA polymerase B | Zingiber mioga | gi|314 913 423 | 62 | Stress response | 8792 | 8.6/5.1 | 89 |
| 30 | Probable disease resistance protein | Prunus mume | gi|645 272 760 | 51 | Stress response | 63 293 | 6.1/5.2 | 58 |
The protein spots which were differentially expressed were isolated using trypsin and analyzed using MALDI-TOF MS. Most of the protein spots identified by a mass spectrometer had functional annotations in the universal protein data bank. However, few of the protein spots were hypothetical or unknown with no functional annotations. The majority of the proteins were involved in stress response and were identified as probable disease response proteins (spot 1), glu S.griseus protease inhibitor-like (spot 4), vacuolar protein sorting-associated protein 53 A isoform (spot 11), zinc finger AN1 and C2H2 domain-containing stress-associated protein 16-like (spot 15), RNA polymerase B (spot 17, 20, 25, 29), and probable disease resistance protein (spot 21, 30). The other major protein spots were identified as vernalization 1 (VRN-1) (spot 7,9 16, 23, 24 and 26) which belong to flower development (Table 1).
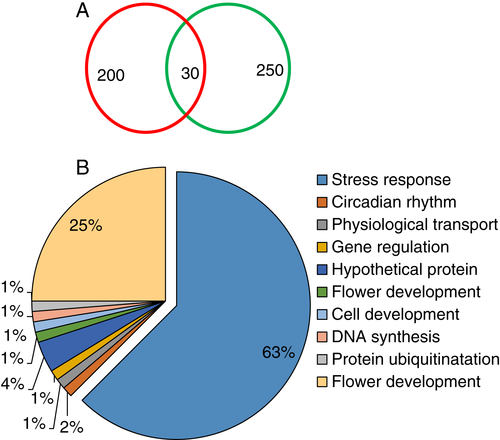
Upon the assessment of each protein using the classifications as analyzed by gene ontology (www.geneontology.com), we classified 30 identified proteins into different functional groups (Fig. 9) under drought stress. The classification indicated that most of the identified proteins under temperature stress were significantly related to stress/defense responses, circadian rhythm, physiological transport, gene regulation, flower development, cell development, DNA synthesis, protein ubiquitination. The majority were related to stress response (63%) and flower development (25%).
Regulatory protein–protein interaction networks
The protein–protein interaction network generated using STRING 9.0 revealed functional links between different proteins identified in chrysanthemum under drought stress (Fig. 10). The significant clusters of interacting proteins are highlighted in circles and contain proteins that are associated with stress response, ion binding and metabolism.
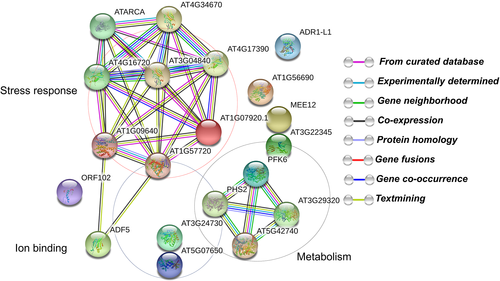
Bioinformatics approaches using STRING (Szklarczyk et al. 2011) enable the characterization of protein–protein interaction with main clusters related to stress response (most commonly classified proteins in chrysanthemum), ion binding and metabolism (including flower development). The protein–protein interaction data thus strongly suggest that these proteins are synthesized abundantly in chrysanthemum in response to high drought stress.
Discussion
The initial effect of drought stress is visible on the morphology of plants like drying of leaves, stunted growth, reduced biomass and reduced germination. These effects have been found in many crops like peas (Pisum sativum), alfalfa (Medicago sativa), rice (Oryza sativa; Manickavelu et al. 2006, Okcu et al. 2005, Zeid and Shedeed 2006) and tomato (Solanum Lycopersicon; Muneer et al. 2016) as well as observed in our results for chrysanthemum. The drying of leaves is obviously because of a decrease in water or osmotic potential, as seen in our results too (Fig. 4B). The reduced growth development is directly proportional to less absorption of water, and therefore nutrients, required for cell growth and development and also due to impairment of mitosis and cell elongation, which results in a weak growth (Hussain et al. 2008).
ROS are inevitable by-products of a healthy aerobic metabolism and can disrupt cellular homeostasis (Mittler 2002). ROS are known to affect several genes which are involved in transduction pathways of plants (Pitzschke et al. 2006). ROS affect other biomolecules like lipids, proteins and nucleic acids (Muneer et al. 2014, ). Our studies depicted oxidative stress in the form of an increase in lipid peroxidation (Fig. 4A). Using lipid peroxidation/MDA content as a proxy, we could measure the ROS level that was present at low quantity at the beginning of the treatment and peaked at later stages of the drought stress (Fig. 4A). It was, therefore, estimated that at initial stages of drought stress plants could have used a diverse group of redox reactions such as superoxide dismutase (SOD), ascorbate peroxidase (APX), catalase (CAT) glutathione reductase (GR) and low molecular weight antioxidants such as reduced glutathione (GSH) and oxidized glutathione (GSSG) to scavenge different types of ROS and thus keeping the cells against injury and potential damage (Mittler 2002) to reduce the formation of ROS. Although we did not represent the accumulation of ROS in the form of H2O2 and O2−1 or antioxidative enzymes, we observed several upregulated stress-responsive proteins in drought-stressed plants in our proteomic analysis (Table 1). Substantially it is evident that ROS is accumulated and formed in chloroplasts during photosynthesis. Thus, it was very essential to analyze the net-photosynthetic rate to correlate it with formation of ROS.
Photosynthesis is a critical metabolic process in plants and is also sensitive to environmental conditions, including drought (Farooq et al. 2007, Muneer et al. 2016). The reduction of photosynthesis is mainly due to reduced leaf expansion, improper functioning of photosynthesis machinery, and leaf senescence (Wahid et al. 2007). As expected, our results also depicted the reduced net-photosynthesis, transpiration, stomatal conductance, and photosynthetic pigments (Fig. 7), which is obviously due to reduced leaf expansion under drought-stress (Figs 1 and 2). Moreover, the stomatal closure seen in our results also depicts that CO2 availability is less which makes the plants more susceptible to photodamage (Fig. 6; Tombesi et al. 2015, Xu et al. 2016). The reduction of photosynthetic rate, photosynthetic pigments and the stomatal index could also be due to reduced availability of moisture content in chrysanthemum as seen morphologically in our results. The closure of stomata observed is obviously due to reduced moisture content and dryness of leaves, which could not help the plants for the exchange of gases and transpiration. The damages under drought stress to the photosynthetic machinery have been previously observed in many model plants (Dutta et al. 2009, Din et al. 2011). During photosynthesis, the quantum yield of PSII is important for photophosphorylation. It has been observed that abiotic stress reduces the quantum yield of PSII, as seen in our plants under drought stress (Fig. 5).
Many stress-responsive proteins are active in chloroplasts during photosynthesis to trigger the defense mechanisms during any stress. Therefore, we correlated photosynthesis and stress-responsive proteins to reveal signaling pathway in chrysanthemum under drought stress. Because proteomic is an ideal tool to reveal different signaling mechanisms in plants, two-dimensional gel electrophoresis combined with MALDI-TOF MS was performed. For the relative protein profile by two-dimensional gel electrophoresis in leaves of chrysanthemum, 30 protein spots were differentially expressed between control- and drought-stressed plants. We observed that most of the protein spots that were upregulated under drought stress were mostly related to defense and flower development. To obtain a more in-depth insight into the molecular detail of the drought stress defense mechanisms, we assessed several notable and differentially regulated proteins in further detail.
Proteins related to stress response
The proteins identified from chrysanthemum were 65% related to stress response, which indicated that plants had developed a defense mechanism towards high drought stress. The stress responsive proteins upregulated in our studies were identified as: probable disease resistance proteins, Glu S.griseus protease inhibitor, vacuolar protein sorting-associated protein 53 A isoform, zinc finger AN1 and C2H2 domain-containing stress-associated protein 16-like, and RNA polymerase B. All these proteins have been identified to regulate the drought in many plants like wheat (Zhang et al. 2018), barley (Guo et al. 2016), pyropia (Shi et al. 2017), and tomato (Muneer et al. 2016) and is therefore supporting our results. The upregulation of protein spots classified as a stress response (depicted in Table 1 and Fig. 9) in chrysanthemum suggested that these proteins were involved in the reduction of reactive oxygen species (ROS) to high drought stress and regulation of redox reactions to protect the cell damage. Several antioxidative enzymes like superoxide dismutase (SOD), catalase (CAT) and glutathione reductase (GR) might have also involved in the mitigation of ROS in chrysanthemum as observed previously in our proteomic studies (Muneer et al. 2016). Other stress-related proteins, like heat shock proteins (Haq et al. 2019, Ul Haq et al. 2019, Guo et al. 2020), might have also been involved in defense mechanisms, as observed in previous studies (Shi et al. 2017) but were unfortunately not detected in chrysanthemum.
Proteins related to flowering
Flower development is significant in ornamental plants, including chrysanthemum. Several proteins/genes involved in flowering have been already documented in the model plant Arabidopsis thaliana like FLORAL TRANSITION REPRESSOR (FLC), floral pathway integrators [FLOWERING LOCUS T (FT), SUPPRESSOR OF OVEREXPRESSION OF CO 1 (SOC1), and LEAFY (LFY)] and floral meristem [APETALA1 (AP1), CAULIFLOWER (CAL), FRUITFULL (FUL), LEAFY (LFY), SEPALLATA 4 (SEP4); Tan and Swain 2006]. There are several other proteins/genes directly or indirectly involved in flower development that have been earlier identified in many crops like Arabidopsis (Ditta et al. 2004, Liu et al. 2007, Gregis et al. 2008). In our studies, 25% of the protein spots were identified and classified in the flower development category. Several proteins related to flower development were VERNALIZATION PROTEIN 1 (VRN1), and the expression of this protein was mainly down-regulated under severe drought stress. Their downregulation indicated that flower development in chrysanthemum could be affected, as can also be seen morphologically. Flowers in drought-stressed chrysanthemum were dried out and fallen off and no new bud appeared after 7 days of drought. However, at initial stage of drought (1–3 days) no changed was observed in flower buds and buds continued to bloom. Our studies indicated that the downregulation of proteins related to flower development affected flowering severally under drought stress and could not maintain the homeostasis during flower development.
Conclusions
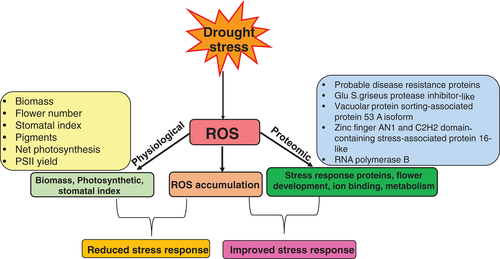
Chrysanthemum is one of the highest commercially-grown ornamental plants throughout the world, but one of the significant challenges for the flower's productivity is climate change. Drought has always been a substantial hurdle in crop growth and development, there are no exceptions for ornamental crops. Numerous studies documented the effects of severe drought in ornamental plants from a physiological perspective. The number of studies on molecular aspects of ornamental plants, particularly on signaling pathways and homeostatic maintenance, is limited. In this study, several proteins were identified along with morphological and physiological studies. These proteins were mostly associated with stress response and flower development. The stress-related proteins were upregulated and flower development proteins were downregulated. The upregulated proteins primarily defined the homeostatic maintenance in chrysanthemum and the possible signaling network for adaptation to severe drought. The probable pathways and homeostatic maintenance are schematically shown in Fig. 11.
Author contributions
S.M. conceptualized and supervised the work, S.M., B.M.S., K.R., M.A., A.V. and S.J performed the experiments. L.K.B. helped in statistical analysis. B.R.J. helped in analytical data. S.M. wrote and edited the manuscript. All authors read and approved the manuscript.
Acknowledgements
This research was funded by VIT-Seed grants and Balaji Polypacks (Agro-Industry), Karnataka, India.
Open Research
Data availability statement
Data sharing is not applicable to this article as all new created data is already contained within this article.


