Zinc treatment of hydroponically grown barley plants causes a reduction in root and cell hydraulic conductivity and isoform-dependent decrease in aquaporin gene expression
Abstract
The cellular and molecular basis of a reduction in root water uptake in plants exposed to heavy metals such as zinc (Zn) is poorly studied. The aim of the present study on hydroponically grown barley (Hordeum vulgare) was to test whether any reduction in root hydraulic conductivity (Lp) in response to Zn treatment is accompanied by a reduction in cell Lp and gene expression level of aquaporin (AQP) isoforms. Plants were grown in the presence of 0.25 μM, (control), 0.1 and 1 mM Zn in the root medium and analysed when they were 16–18 days old. Root and cell Lp was determined through exudation and cell pressure probe analyses, respectively, and gene expression of five candidate AQPs was analysed [real time quantitative polymerase chain reaction (PCR)]. Zinc treatments caused significant reductions (25–83%) in transpiration rate, root and shoot fresh weight, surface area and stomatal conductance. Zinc concentrations in tissues increased more than 100-fold. Root Lp decreased by 24% (0.1 mM Zn) and 58% (1 mM Zn), while cell Lp decreased by 45 and 71%, respectively. Gene expression of AQPs decreased by 14–80%; decreases were statistically significant for HvPIP1;3, HvPIP2;4 and HvPIP2;5. Turgor in root cortex cells was not reduced by Zn treatments. It is concluded that reductions in plant water flow in response to Zn treatment are facilitated through decreases in root (Lp) and shoot (stomata) hydraulics. The decrease in root Lp is facilitated through reductions in cell Lp and AQP gene expression and may also reflect increased suberization in the endodermis.
Abbreviations
-
- ABA
-
- abscisic acid
-
- AQP
-
- aquaporin
-
- Ct-value
-
- cycle threshold value
-
- FW
-
- fresh weight
-
- Lp
-
- hydraulic conductivity
-
- MIP
-
- major intrinsic protein
-
- P
-
- cell turgor pressure
-
- PIP
-
- plasma membrane intrinsic protein
-
- ROS
-
- reactive oxygen species
-
- RSA
-
- root surface area
-
- SSA
-
- shoot surface area
-
- T1/2
-
- half-time of water exchange
-
- TIP
-
- tonoplast intrinsic protein
-
- ϵ
-
- cell volumetric elastic modulus
-
- Ψ
-
- water potential
Introduction
Aquaporins (AQPs) are multifunctional membrane-integral protein channels. They belong to the family of major intrinsic proteins (MIPs) and are best known for their ability to facilitate the diffusion of water (for reviews, see Maurel et al. 2015, Chaumont and Tyerman 2014). Water channel activity is displayed in particular by members of the tonoplast intrinsic proteins (TIPs) and PIP2 subgroup of plasma membrane intrinsic proteins (PIPs). The activity of AQPs and water permeability of membranes can be regulated at the protein level through trafficking, phosphorylation and cytosolic pH (Johansson et al. 1998, Tournaire-Roux et al. 2003, for review, see Chaumont and Tyerman 2014), yet can also involve significant and rapid changes at the gene transcriptional level (Sakurai-Ishikawa et al. 2011, Vandeleur et al. 2014, Meng et al. 2016).
Aquaporins exert their controlling function on root water uptake through regulating the cell-to-cell transmembrane component of radial water flow across the root cylinder (Frensch and Steudle 1989, Steudle 2000, Gambetta et al. 2017). The extent to which AQPs control root water uptake and root hydraulic conductivity [Lp, m s−1 MPa−1; water (m3) uptake per unit root surface (m2), time (s) and driving force (MPa); Suku et al. 2014] depends on the relative contribution of cell-to-cell and apoplast path to radial water movement. This contribution varies with species, environmental conditions and day length (Frensch and Steudle 1989, Steudle 2000, Bramley et al. 2009, Knipfer et al. 2011, Aroca et al. 2012). Previous studies have shown that the cell-to-cell path dominates radial root water transport in barley (Steudle and Jeschke 1983, Knipfer and Fricke 2010, Knipfer et al. 2011, Suku et al. 2014).
There exist almost 40 heavy metal elements. These elements are divided into biological essential and non-biological essential metals. Biological essential heavy metals include copper (Cu), nickel (Ni), iron (Fe) and zinc (Zn) (Sadeghzadeh 2013). They are necessary for physiological and metabolic process but become toxic at higher concentrations. High concentrations of heavy metals in the root environment can limit plant growth by interfering with key metabolic and physiological processes such as photosynthesis, respiration, transpiration and root water uptake (Garbisu and Alkorta 2001). While detrimental effects of heavy metals are well documented at the macroscopic level, the underlying molecular mechanisms (Sanità di Toppi and Gabbrielli 1999) are often poorly understood. This applies in particular to changes in root water transport properties.
Barley (Hordeum vulgare L.) is a major cereal crop. It can be used as animal fodder, as a source of fermentable material for alcoholic beverages and as a source of flour and component of various health foods. Barley can accumulate up to 1% of its dry matter in heavy metal (Morel 1997) and has been identified as a plant for efficient uptake and accumulation of Zn (and Cd; Ebbs and Kochian 1998). However, higher Zn levels can induce change in the structure of root, stem and leaf tissues and alter some of their morphological and physiological characteristics (Maruthi Sridhar et al. 2007). The latter includes reductions in root water uptake. To date, it is not known which molecular mechanisms contribute to the reduction in root water uptake. Considering that much of root water uptake in barley is facilitated through AQPs, we addressed here the question whether any reduction in the root-intrinsic water transport property (Lp) in response to high Zn could be due to reduced AQP activity and gene expression. To this purpose, we exposed barley plants to two elevated levels (0.1 and 1 mM) of Zn in the nutrient solution for the final week of growth. We analysed 16–18 days old plants for growth, transpiration, root and shoot surface area (SSA), root and cell Lp and changes in the expression of candidate AQPs. These candidate AQPs had been identified in a previous study (Knipfer et al. 2011) to play a role in root water uptake in barley. Root Lp was determined through exudation analyses of detopped root systems, and cell Lp was determined for cortex cells in planta using the cell pressure probe technique. This technique also provided values of turgor pressure, which can give an indication of the intactness of plasma membrane of cells and, because turgor has to be actively maintained, of potential cytotoxicity of Zn treatments. In addition, root cross-sections were stained for the presence of apoplastic barriers (Casparian bands, suberin lamella), as these could contribute to any changes in root Lp (Steudle and Peterson 1998, Enstone et al. 2003) in response to Zn.
Materials and methods
Plant material and growth conditions
Barley (Hordeum vulgare L. cv. Quench) plants were grown on modified half-strength Hoagland's solution in a growth chamber (Microclima, MC1000HE, CEC Technology, Glasgow, UK) as described previously (Knipfer and Fricke 2011). The root medium was aerated, and plants grew at a day/night length of 16/8 h and temperature of 21/18°C. Relative humidity was 70% and photosynthetically active radiation at plant level was 300–350 μmol m−2 s−1.
Zinc treatments (0.1 and 1 mM ZnSO4 final concentration in nutrient medium) were applied when the seedlings were 11 days old. Treatments were started by adding aliquots (15 ml) of concentrated stock solutions of zinc (pH 6) to 800 ml of nutrient solution, which was contained in each 1-l beaker supporting the growth of four plants. Care was taken that the addition of Zn did not cause any precipitation of salts in the nutrient solution. Control plants had Zn provided throughout at a micronutrient level of 0.25 μM.
Plants were analysed when they were 16–18 days old, 3–7 h into the photoperiod.
Transpiration measurements
Transpirational water loss of plants growing in the growth chamber was determined gravimetrically as described previously (Meng et al. 2016). Bubbling or not bubbling nutrient solutions during the 2-h measurement period of transpiration did not affect the value of transpiration, yet bubbling increased the error significantly (not shown), probably due to variable amounts of water vapour escaping between the foam piece which supported the plant and the Erlenmeyer flask which contained the nutrient solution.
To obtain a measure of stomatal conductance (m s−1), transpirational water loss rate (m3 s−1) was related to SSA (m2).
Fresh weight and surface area
Following transpiration analyses, the fresh weight (FW) of the root system and shoot of each plant was determined with an analytical balance. The shoot was scanned (Canon 9900F model, Melville, NY) for subsequent determination of SSA, and the root system was used for exudation hydraulic analyses before being scanned too for determination of root surface area (RSA). Scanned images were analysed using the ‘set-threshold’ function of the freely available software ImageJ (www.imagej.nih.gov/ij/). To increase the contrast of root images, roots were stained in 0.25% Coomassie Brilliant Blue for 2 days prior to scanning (Kano-Nakata et al. 2012). Roots were treated as cylinders during surface area analyses.
Hydraulic analyses
Hydraulic analyses were carried out in a normal laboratory environment, with (cell Lp) or without (root exudation Lp) supplemental lighting to keep plant transpiration rates (cell pressure probe analyses on intact plants) comparable with those in the growth chamber. Ambient air temperature and temperature of root media was between 17 and 21°C.
Root systems were analysed through exudation experiments as described previously (Suku et al. 2014) being bathed in the identical nutrient solution used during plant growth. Osmotically driven water uptake was recorded at 5-min intervals over a period of 40–80 min. Exudate and root medium osmotic pressure was analysed using a VAPRO (Wescor Inc., South Logan, UT) osmometer. Root Lp (m s−1 MPa−1) was calculated by relating exudate flow rate (m3 s−1) to RSA (m2) and the osmotic driving force for water uptake (difference in osmotic pressure between exudate and root medium; unit MPa; for calculations, see Knipfer and Fricke 2011).
Cell turgor, halftime of water exchange (T1/2), elastic modulus (ϵ) and Lp were determined through the cell pressure probe technique as described previously (Knipfer et al. 2011, Sharipova et al. 2016). Cell osmotic pressure was determined through picolitre osmometry of sap extracted from cells (Fricke and Peters 2002). The dimension of cells was determined through free-hand cross-sections assuming that cells were shaped like cylinders. Cortex cells, which were located in the first three cortical cell layers beneath the epidermis were analysed, 1–1.5 cm from the tip (root hair region).
Molecular analyses
The entire root system of a plant was harvested and frozen immediately in liquid nitrogen. The harvested root systems of three plants were pooled together into one biological replicate and ground into a fine powder in liquid nitrogen and stored at −80°C. An aliquot of the powder was taken to extract RNA, using an RNeasy Mini Kit (Qiagen, Valencia, CA). The RNA sample was subjected to DNase I (Invitrogen, San Diego, CA) treatment and used to synthesise cDNA, using SuperScript II Reverse Transcriptase (Invitrogen), as described previously (Meng et al. 2016). Expression of candidate AQP genes was quantified at mRNA level by real-time quantitative polymerase chain reaction (qPCR), using a Stratagene rapid cycler and SYBR-Green as reagent (Takara Bio Inc., Otsu, Japan) on 96-well plates; for details, see Meng et al. (2016). Four biological replicates, each being derived from a different batch of plants, were analysed for each treatment. Each batch of plants had one control, one 0.1 mM Zn and one 1 mM Zn biological replicate analysed. The calculation of qPCR data was based on the ΔΔCt method (Pfaffl 2001; for details, see Meng et al. 2016). Sequences of primers are given in Besse et al. (2011). Originally, we used three housekeeping genes (ubiquitin, plasma membrane H+-ATPase, tubulin) as references of expression as in previous studies; however, tubulin turned out to be not a suitable reference gene as its gene expression level was occasionally very low in Zn treatments. Therefore, we based all ΔΔCt calculations on the other two reference genes.
Zinc tissue analyses
Concentrations of Zn were determined for a batch of plants in which four plants of each treatment were grown. At harvest, the root system of each plant was shortly suspended in a sequence of four 1-l beakers filled with distilled water to remove traces of externally adhering Zn. The roots were briefly blotted dry, and the plant was divided into a shoot and root sample. Each sample was analysed for FW and subsequently frozen in liquid nitrogen. Samples were thawed in 0.5 N HCl, contained in 50-ml Falcon tubes, and left in this solution for 2 months (room temperature), with daily (Monday–Friday) inversion of tubes. This ensured that Zn concentrations in the HCl solution equilibrated with those within plant tissues. Zinc concentrations in centrifuged extracts were determined by flame atomic absorption spectrometry and expressed as ppm (mg Zn per kg FW of tissue).
Root anatomical analyses
Root anatomy was studied on free-hand cross-sections, which were made from plant material stored in 50% ethanol. Sections were made at two positions along the root axis, at 10–12 mm (root hair region) and at 40–60 mm from the tip (lateral root region; 50–60 mm for control and 0.1 mM Zn-plants; 40–50 mm from 1 mM Zn plants to account for slower root growth and tissue displacement velocities in these plants). Sections were observed with a Leica microscope (DM IL; Leica, Wetzlar, Germany) and captured with a digital camera (DFC300 FX; Leica). For the detection of Casparian bands, sections were stained for 60 min with 0.1% (w/v) berberine hemisulfate, counterstained for 30 min with 0.5% (w/v) aniline blue and mounted in 0.1% (w/v) FeCl3 in 50% (v/v) glycerol (Brundrett et al. 1988). Sections were viewed under fluorescence light using an ultraviolet (UV)/violet filter with an excitation wavelength of 390–420 nm (Knipfer and Fricke 2011). Suberin and lipid deposits were visualised by staining sections with Sudan Red 7B for 1.5 h (Brundrett et al. 1991). The same sections were also used to detect autofluorescence of lignified tissues, using the filter setup (UV illumination) as employed for berberine hemisulfate-stained sections.
Statistical analyses
Data were subjected to one-way anova analyses (treatment effects) using the general linear model and Tukey functions in Minitab.
Results
Plant growth
Zinc treatments caused a significant reduction in shoot and root FW, with the reduction being about 15% at the lower and 60% at the higher Zn treatment (Fig. 1A). The ratio of root FW to shoot FW was not affected significantly by Zn treatments (Fig. 1C).
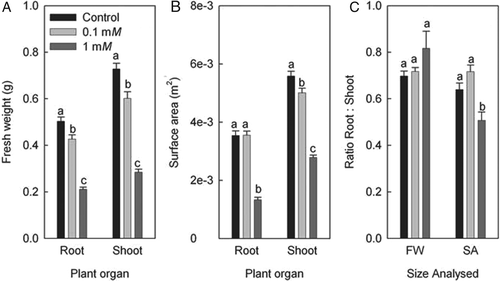
Leaf surface area was reduced significantly in response to all Zn treatments (Fig. 1B). In contrast, RSA was only reduced in response to the higher Zn treatment (Fig. 1B). The ratio of RSA to SSA decreased significantly at the higher Zn treatment (Fig. 1C).
Transpiration
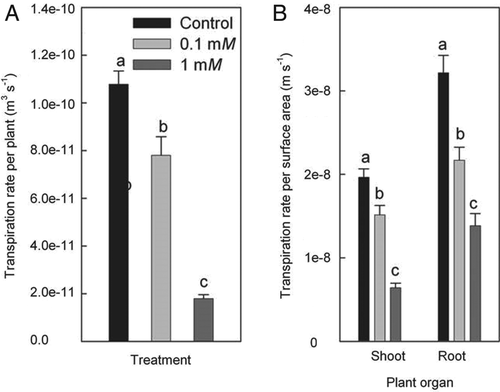
The rate of transpirational water loss per plant decreased significantly, by 28 (0.1 mM Zn) and 83% (1 mM Zn) in response to Zn treatments (Fig. 2A). The rate of transpirational water loss per unit SSA, being indicative of stomatal conductance, decreased also significantly at the two Zn treatments (Fig. 2B). When comparing per cent-reductions in SSA (control value set to 100%), plant transpiration rate and transpiration rate per unit SSA, transpiration in plants exposed to 0.1 mM Zn decreased mainly as a result of a reduced stomatal conductance (not shown). In contrast, in plants exposed to 1 mM Zn, a reduction in SSA contributed to the reduction in plant transpiration rate considerably too.
Tissue Zn concentrations
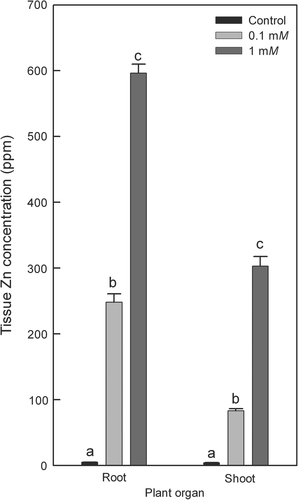
Concentrations of Zn in root and shoot tissue of plants grown under control conditions were comparable, averaging around 4 to 5 ppm (Fig. 3). Tissue Zn concentrations increased significantly, and by more than 100-fold, in response to Zn treatments. This applied in particular to roots, where Zn concentrations in Zn treatments were two to three times as high compared with concentrations in shoot tissue.
Root Lp
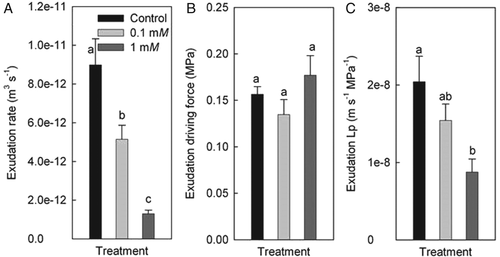
The exudation rate of excised root systems averaged 8.99 × 10⁻¹² m3 s−1 for plants grown under control conditions and decreased significantly in response to the 0.1 mM Zn (5.15 × 10⁻¹² m3 s−1) and 1 mM Zn treatment (1.3 × 10⁻¹² m3 s−1) (Fig. 4A). The osmotic force driving water flow between root medium and xylem was not affected significantly by Zn treatments and ranged between 0.135 and 0.177 MPa (Fig. 4B). Root system Lp was calculated using values of exudation rate, exudation driving force and surface area of analysed root systems. Root Lp averaged 2.04 × 10⁻⁸ m s−1 MPa in control plants (Fig. 4C). The lower Zn treatment caused a 24% reduction in root Lp, which was not significant. In contrast, the higher Zn treatment caused a 57% reduction in root Lp, which was significant (Fig. 4C).
Cell Lp and related sizes
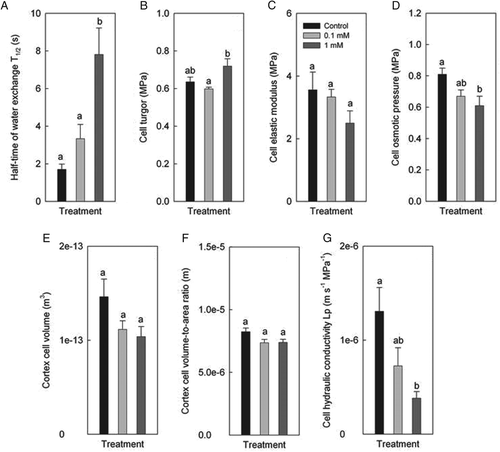
The half-time of water exchange increased in response to Zn treatment (Fig. 5A). The increase in T1/2 at the higher Zn treatment was significant. Cell turgor did not differ significantly between plants grown under control conditions and plants exposed to Zn treatment (Fig. 5B). Cell elastic modulus decreased, non-significantly, in response to Zn treatments (Fig. 5C). Cell osmotic pressure also decreased in response to Zn treatments, particularly at the higher Zn treatment, where the decrease in osmotic pressure was significant (Fig. 5D). The volume and surface area of cortex cells decreased to a similar extent in response to the two Zn treatments (Fig. 5E, F). Cell Lp decreased by 46 and 71% in response to the 0.1 and 1 mM Zn treatment, respectively (Fig. 5G). The reduction in Lp observed for the 1 mM Zn treatment was significant.
AQP gene expression
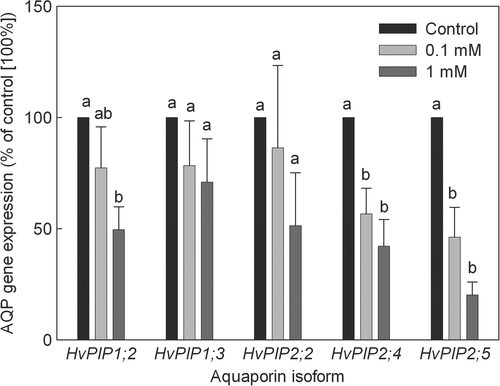
The expression level of AQP genes in Zn treatments was expressed as a percentage of the value in control plants, the latter being set to 100%. The general response of AQP gene expression to Zn treatments was that of a decrease in expression (Fig. 6). Three of the five PIPs analysed displayed significant decreases in gene expression. These genes were HvPIP1;2, which decreased significantly (P < 0.05) in expression in response to the 1 mM Zn treatment, and HvPIP2;4 and HvPIP2;5, which both decreased significantly in response to the 0.1 and 1 mM Zn treatments. The largest and most significant (P < 0.001) decrease in gene expression was observed for HvPIP2;5.
Root anatomy
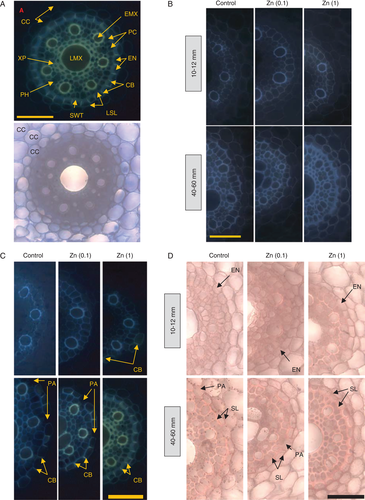
Sections of roots at 10–12 mm from the tip showed a patchy occurrence of Casparian bands in plants treated with 1 mM Zn, yet showed no Casparian bands in plants grown under either control conditions or presence of 0.1 mM Zn in the root medium (Fig. 7). At 40–60 mm from the tip, in-midst the lateral root region, where endodermis development has proceeded to stages II and III (Enstone et al. 2003), sections of all treatments showed Casparian bands and stained positive for suberin lamella. In addition, heavily thickened secondary walls in endodermal cells could be observed. Casparian bands, suberin lamella and thickened secondary endodermal walls were most prominent in plants treated with 1 mM Zn, while the occurrence of endodermal passage cells showing less of these apoplastic barrier features was low.
Discussion
Root and cell hydraulics decrease in response to high Zn level
We are not aware, to the best of our knowledge, of any previous study in which the effect of Zn on (root) cell Lp has been studied in planta, and following a longer-term (days) application of heavy metal. Studies in which the cell pressure probe has been used to test the effect of Zn on cell hydraulics were concerned mainly with shorter-term responses (min to h) and were carried out on epidermal peels of onion (Allium cepa L.) bulbs, using T1/2 as a measure of Lp (Przedpelska-Wasowicz and Wierzbicka 2011), or on giant algae cells of e.g. Chara (Tazawa et al. 1996). Other studies, which involved the analyses of cell Lp and application of heavy metals, typically focused on Hg, being a well-known AQP inhibitor, and also included Ag (e.g. Zhang and Tyerman 1999, Hukin et al. 2002, Niemietz and Tyerman 2002, Knipfer et al. 2011, for review, see Maurel et al. 2015). As these latter two heavy metals are more cytotoxic compared with Zn (Shaw 1990), the time frame of studies (min to hour) was considerably shorter than in the present study (days). Gunse et al. (1997) used the root and cell pressure probe to study changes in Lp in maize root (cells) after 24 h of exposure to Al, and observed an increase and decrease in cell Lp in the Al-tolerant and -sensitive variety, respectively. These and the present results point to a decrease in root cell Lp as being a general response to heavy metal stress.
Zinc has been shown in the animal (Németh-Cahalan et al. 2007) system to increase the water channel activity of some AQP isoforms by factor 2, supposedly through direct interaction with the protein. In contrast, studies on plant cells have consistently shown an inhibitory effect of Zn on membrane water permeability. This effect resembles the inhibitory response caused by Hg, is reversible through application of reducing agents, and is thought to result from oxidation of SH-groups of AQP protein (e.g. Tazawa et al. 1996, Przedpelska-Wasowicz and Wierzbicka 2011, for review, see Maurel et al. 2015). The inhibitory effect of Zn on membrane water permeability is also concentration-dependent, as application of 0.1 mM Zn to onion epidermal cells caused only a 10% increase in T1/2 (and decrease in Lp), while application of 2 mM Zn caused a more than 100% decrease in T1/2 (and 50% decrease in Lp) (Przedpelska-Wasowicz and Wierzbicka 2011).
Root exudation Lp, which is dependent on osmotically driven water uptake, decreased in response to the 0.1 and 1 mM Zn treatments. The reduction in root Lp is a general response observed in response to abiotic stresses (Aroca et al. 2012) including heavy metals (Beaudette et al. 2007, Nedjimi and Daoud 2009, De Silva et al. 2012, Belimov et al. 2015). The residual root system Lp accounted for 76 (0.1 mM Zn) and 43% (1 mM Zn) of the value in control plants, which grew on micronutrient level of Zn. The residual level of root cortex cell Lp in these plants was 54 (0.1 mM Zn) and 29% (1 mM Zn), while residual levels of those three AQPs (HvPIP1;2, HvPIP2;4, HvPIP2;5), which showed significant decreases in gene expression, ranged from 46–77% (0.1 mM Zn) and 20–50% (1 mM Zn). There was (1) considerable variation in gene expression data between biological replicates, (2) we used an average cell volume (and not specific volume of every cell analysed with the cell pressure probe) to calculate cell Lp values, (3) we used detached root systems to determine root Lp, which may lead to downregulation of AQP expression (see Sakurai-Ishikawa et al. 2011, Vandeleur et al. 2014, Meng et al. 2016) and (4) it is well-known that AQP activity can be regulated also at the non-transcriptional level (for a more detailed discussion, see section AQP gene expression; for review, see Chaumont and Tyerman 2014). Despite these uncertainties, we feel that the present data strongly suggest, that downregulation of AQP activity (cell Lp) and gene expression (qPCR data) play an integral part of the hydraulic response of barley roots to Zn treatment.
AQP gene expression decreases in response to high Zn level
There exist only a few studies in which AQP gene expression was studied in response to application of heavy metals, in particular Cd and Hg but also involving Zn (Beaudette et al. 2007, Zhang et al. 2008, Devia et al. 2016). However, these studies, which focused on short-term (h) responses, often showed increases in AQP gene expression. The discrepancy in results between these and the present study is most likely due to differences in the exposure time to heavy metals and may also reflect species- and concentration-dependent responses.
The three PIPs (HvPIP1;2, HvPIP2;4, HvPIP2;5) which decreased in gene expression in response to high Zn have either been shown previously to display high water channel activity when tested in heterologous expression systems (HvPIP1;2, HvPIP2;5; Besse et al. 2011) or have been predicted to display such activity (HvPIP2;4; Hove et al. 2015). The genes of HvPIP1;2 and HvPIP2;5 are expressed almost ubiquitously in all major root tissues including the epidermis, cortex, endodermis and xylem parenchyma (Knipfer et al. 2011); the tissue localization of expression of HvPIP2;4 in roots is not known. HvPIP1;2 is the second-highest expressed PIP1 in seminal roots of barley, accounting for 22% of the combined gene expression of all PIP1s; the highest expressed PIP1 is HvPIP1;3 (62%) (Knipfer et al. 2011). Similarly, HvPIP2;5 and HvPIP2;4, account for the most (64%, HvPIP2;5) and second-most (18%, HvPIP2;4) gene expression of all PIP2s in seminal roots (Knipfer et al. 2011). While these data are not proof per se that the respective PIPs fulfil a controlling role in regulation of root water uptake, they point towards such a role. In support of this, Knipfer et al. (2011) studied PIP gene expression and cell Lp in different root zones of barley. The authors observed that a three- to fourfold higher gene expression of HvPIP2;2 and HvPIP2;5 in a particular root zone was accompanied by a three- to fourfold higher cell Lp in that zone. HvPIP2;5, but not HvPIP2;2, was one of the three PIP genes which was reduced in gene expression by high Zn in the present study. Veselov et al. (2016) observed for barley plants, which were exposed to an increased vapour pressure deficit and transpirational demand, that an increase in root Lp was accompanied by a large increase in protein level of HvPIP2;2, while protein levels of HvPIP2;1 and HvPIP2;5 did not change. Katsuhara et al. (2003) studied changes in root Lp and gene transcript and protein level of HvPIP2;1 during day/night and concluded that HvPIP2;1 plays a key role in the diurnal root water uptake and plant transpiration response of barley. We did not test expression of HvPIP2;1 in the present study, yet the above data suggest that a stress such as high Zn causes not only a AQP isoform-specific expression response among PIPs in general, but also among those PIPs which are prime candidates for facilitating water flow in barley roots. Considering that HvPIP2;5 displayed the largest and most significant decrease in gene expression in response to high Zn of all PIPs tested, and that the rice homologue, OsPIP2;5, showed the largest decrease in gene expression, parallel to decreases in Lp, in roots in response to shoot removal and longer-term salt stress (Meng et al. 2016, Meng and Fricke 2017), we regard HvPIP2;5 as the prime candidate for future studies into the AQP-mediated hydraulic response of barley to high Zn.
We tested the gene expression but not protein levels of candidate PIP isoforms. There exists ample evidence in literature which shows that the two can, but do not have to change in concert in response to stress, and that additional means of regulation of PIP activity in the plasma membrane, such as phosphorylation and relocalisation have to be considered (Boursiac et al. 2005, 2008, Wudick et al. 2015, Lee and Zwiazek 2015; for review, see Maurel et al. 2015). Muries et al. (2011; see also studies cited therein) concluded from studies of broccoli (Brassica napus L.) plants exposed to shorter- and longer-term salt stress that inverse changes in protein and transcript levels of PIPs could point to a negative feedback of accumulating PIP protein on the transcription of respective gene. Similarly, Beaudette et al. (2007) observed a rapid (1 h) increase in PsPIP2;1 gene expression in pea (Pisum sativum L.) following application of Hg, parallel to a decrease in root Lp, and explained this finding such that the increased gene expression was making up in part for the inhibition of AQP protein through Hg. We do not know how the protein levels of HvPIP1;3, HvPIP2;4 and HvPIP2;5 changed, e.g. whether they increased parallel to the decrease in their gene expression level, or whether changes in the phosphorylation status and plasma membrane localisation of these PIPs occurred. However, we know that radial water transport in barley involves AQP function (Knipfer and Fricke 2010, Knipfer et al. 2011). The significant decrease in cell Lp – and also root Lp – observed here, shows that there must have been a parallel decrease in the overall activity of AQPs localised at the plasma membrane.
Aroca et al. (2005) concluded from studies of a chilling-tolerant and -sensitive cultivar of maize (Zea mays L.) that the hydraulic response to chilling involved, but was not restricted to, an AQP-mediated mechanism with avoidance of oxidative stress and associated membrane damage being the most favoured additional mechanism. Heavy metal stress is known to causes oxidative stress, and Zn toxicity has been associated with membrane damage (Bazihizina et al. 2014, for review, see Martinka et al. 2014). However, it is unlikely that any membrane damage resulting from oxidative stress will have contributed to the decrease in root and cell Lp observed here. The turgor of root cortex cells was maintained at control level in both Zn treatments. This reflects an (osmotic) integrity of plasma membrane of root cortex cells, despite Zn concentrations accumulating to much higher levels in root compared with shoot tissues, as reported previously (e.g. Kherbani et al. 2015). Similarly, Gunse et al. (1997) concluded from cell pressure probe studies of maize, that Al toxicity did not lead to a general breakdown in membrane integrity of root cortex cells. Solute accumulation in cells is an energy-requiring process, and the decrease in cortex cell osmotic pressure in Zn-treated barley plants observed here points to some metabolic limitation in these cells. This limitation may well be the result of oxidative stress.
Changes in root apoplastic barriers contribute to the decrease in root Lp in response to high Zn levels
The higher Zn treatment (1 mM) caused an appearance of Casparian bands in the endodermis already 10–12 mm from the root tip, in the root hair region, and a more complete formation of Casparian bands and increased formation of suberin lamella and secondary wall thickening in the endodermis halfway along the more mature lateral root region. The main axis of lateral root region also contributes to water transport in barley (Sanderson 1983). This applied in particular to roots of plants treated with 1 mM Zn, as these roots were about 20–30% shorter (not shown) and showed few lateral roots compared with roots of plants grown under control conditions or treated with 0.1 mM Zn (apoplastic barriers in the mature region of lateral roots were more developed in control plants compared with plants exposed to 1 mM Zn, and impacted on overall root Lp more in the former than in the latter; see Appendix S1, Supporting Information). As plants were of the same age, the reduced root length reflects slower displacement velocities of cells along the root axis. Endodermal cells of plants treated with 1 mM Zn had more developmental time available per unit distance being displaced and endodermal developmental states I-III (for reviews, see Enstone et al. 2003, Geldner 2013) were shifted closer to the root tip. We tried to account for this aspect by analysing cells in the lateral root region closer to the tip in plants exposed to 1 mM Zn compared with control plants and plants treated with 0.1 mM Zn. Still, we cannot rule out that the anatomical changes in the endodermis in response to 1 mM Zn resulted mainly from a developmental shift closer to the tip, as reported for Arabidopsis plants exposed to potassium deficiency (Barberon et al. 2016) and maize plants exposed to Cd (Líška et al. 2016). The result was that roots of plants treated with 1 mM Zn had a larger portion of their entire surface containing an endodermis with increased apoplastic transport barriers (and lateral roots were less abundant). This is a well-documented response of plants subjected to heavy metal stress (for review, see Martinka et al. 2014, Líška et al. 2016, and studies cited therein) and should slow down the diffusive and mass-flow driven movement of Zn along the apoplast (White et al. 2002) into the root stele. Furthermore, increased suberisation will also slow down the transport of any substance, which moves across the membranes of endodermal cells. Suberin lamella are located between the plasma membrane (or secondary wall) and primary wall and encase the entire protoplast of an endodermal cell, including the tangential walls which are perpendicular to the direction of radial flow across the root cylinder (for review, see Geldner 2013). Therefore, the changes in apoplastic barriers observed here in response to the 1 mM Zn treatment will not only impact on Zn transport involving the ZIP family of Zn membrane transporters (Tiong et al. 2015), but will also impact on root Lp – despite most if not all radial water transport in barley occurring along the cell-to-cell path (Steudle and Jeschke 1983, Knipfer and Fricke 2010).
The precise function of the heavily thickened secondary (often also referred to as ‘tertiary’) walls in the endodermis is not clear (Geldner 2013). Given the overall thickness and lignification of wall material in the stele (Fig. 7), we doubt that these wall thickenings provide a substantial additional diffusion barrier in xylem to water (Steudle and Peterson 1998). Rather, we favour the idea that these thickenings provide increased mechanical stability and protection for the stele, particularly in more basal root sections (further away from the tip) where cortex cell senescence can occur in barley as an adaptive response to stress (Schneider et al. 2017).
Conclusion: main players in the hydraulic response of barley plants to high Zn
Application of high Zn puts pressure on the water balance of plants (for review, see Martinka et al. 2014). Barley plants exposed to 0.1 mM Zn had a reduced water flow rate through a coordinated reduction in root (AQPs) and shoot (stomata) hydraulic properties, rather than through a reduction in water-absorbing (root) and -loosing (shoot) surface. In contrast, plants exposed to the higher Zn concentration (1 mM), had a residual transpiration rate of 17% of that in control plants, which resulted from a combination of 50% residual SSA and 33% residual stomatal conductance (0.38 × 0.50 = 0.17). Similarly, at root level, the 17% residual rate of water uptake resulted from a combination of 38% residual RSA and 43% residual root Lp (0.38 × 0.43 = 0.16).
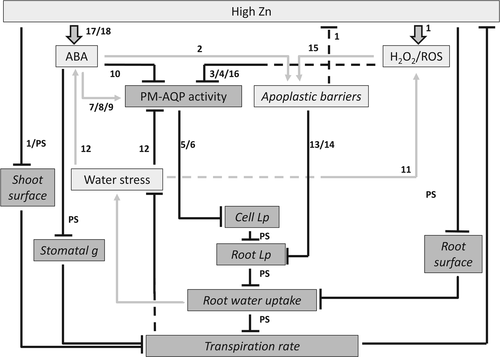
Fig. 8 provides a model, in which data obtained here and data from literature (see numbers in figure and legend) are combined to explain the hydraulic response of barley to high Zn, and how this response feeds back onto the stressor (Zn). Key players in the response are abscisic acid (ABA), reactive oxygen species (ROS) including H2O2, plasma membrane localised AQPs, and apoplastic barriers. Accordingly, high Zn in the root medium causes an increase in the tissue levels of ABA and ROS. High Zn also impacts directly, and negatively, on the production of shoot and RSA. The formation of apoplastic barriers is promoted by ROS and ABA, while plasma membrane AQP activity is reduced by ROS, with ABA having both negative and positive influences on plasma membrane AQP activity based on the level of interaction (gene transcript, protein, trafficking). Together, this results in a reduction in cell and root Lp, which in turn reduces root water uptake – in addition to the reduction due to the reduced RSA – and plant transpiration rate. Reductions in SSA and stomatal conductance contribute further to the reduction in plant transpiration rate and assist in the alignment of root with shoot hydraulic response. The reduction in plant transpiration rate potentially limits mass transfer of Zn to the shoot; it also counters the build-up of water stress, which would otherwise further promote formation of ROS and inhibition of plasma membrane AQP activity. Together, these responses are primarily aimed at safeguarding the water balance of plant, and at limiting the transfer of Zn to shoot tissue.
Author contributions
A.G. carried out all experiments except cell pressure probe and root anatomical analyses, the latter were performed by W.F. Both A.G. and W.F. designed the experiments, analysed the data and wrote the manuscript.
Acknowledgements
This project was funded by Università degli Studi di Roma “La Sapienza” (no. 1003/2015 class. V5) to A. G.


