Effects of temperature and drought manipulations on seedlings of Scots pine provenances
Abstract
Rising temperatures and more frequent and severe climatic extremes as a consequence of climate change are expected to affect growth and distribution of tree species that are adapted to current local conditions. Species distribution models predict a considerable loss of habitats for Pinus sylvestris. These models do not consider possible intraspecific differences in response to drought and warming that could buffer those impacts. We tested 10 European provenances of P. sylvestris, from the southwestern to the central European part of the species distribution, for their response to warming and to drought using a factorial design. In this common-garden experiment the air surrounding plants was heated directly to prevent excessive soil heating, and drought manipulation, using a rain-out shelter, permitted almost natural radiation, including high light stress. Plant responses were assessed as changes in phenology, growth increment and biomass allocation. Seedlings of P. sylvestris revealed a plastic response to drought by increased taproot length and root–shoot ratios. Strongest phenotypic plasticity of root growth was found for southwestern provenances, indicating a specific drought adaptation at the cost of overall low growth of aboveground structures even under non-drought conditions. Warming had a minor effect on growth but advanced phenological development and had a contrasting effect on bud biomass and diameter increment, depending on water availability. The intraspecific variation of P. sylvestris provenances could buffer climate change impacts, although additional factors such as the adaptation to other climatic extremes have to be considered before assisted migration could become a management option.
Introduction
Climate change will have a major impact on European forests, including the goods and services they provide (Lindner et al. 2010). In addition to a rise of mean temperatures, an increase of extreme climatic events is expected (Salinger 2005; Beniston et al. 2007; IPCC 2012, 2013). Due to the particular importance of extreme events in shaping forest ecosystems (Fuhrer et al. 2006) and their possible consequences (Reichstein et al. 2013; Reyer et al. 2013), the adaptedness and adaptability of forest trees to increased climate variability is a prerequisite for survival under future conditions.
A changing climate has now been shown to contribute to dieback of forest trees (Allen et al. 2010). The numerous reports on Pinus sylvestris mortality (Dobbertin et al. 2005; Galiano et al. 2010; Giuggiola et al. 2010) could therefore suggest a gradual decline of its southernmost distribution in the future, accompanied by an expansion to higher latitudes (Matías & Jump 2012). As a consequence, for many regions, such as Germany, the future fitness of this species is questioned, as for other tree species, e.g. Picea abies (Kölling et al. 2009). However, due to its huge distribution range (Euforgen 2009), P. sylvestris inhabits contrasting environments and has evolved wide genotypic variation and phenotypic plasticity (Lang et al. 2007). This has resulted in considerable differences in phenology, morphology and growth traits among different P. sylvestris provenances described in various provenance tests of this species (Giertych 1979; Mátyás 1996).
Pinus sylvestris provenances reveal latitudinal and longitudinal clines, and differ in bud burst, growth cessation and bud set (Andersson & Fedorkov 2004; Chmura et al. 2012). Growth rates and overall growth traits vary among provenances even at the seedling stage (Chmura et al. 2012) and continue to maturity (Giertych 1979). This was also demonstrated in a greenhouse experiment using the same provenances as in this study (Taeger et al. 2013a). In the context of climate change, populations at the rear edge of the distribution are of special interest because they could store special genetic diversity or adaptations to heat or drought (Nielsen & Jørgensen 2003; Hampe & Petit 2005). However, those populations have often been neglected in established provenance trials, which have focused mainly on quality and maximum growth under optimum conditions.
In spite of high within-population variability and low genetic differentiation of P. sylvestris populations (Prus-Glowacki & Stephan 1994; Robledo-Arnuncio et al. 2005), investigations of European populations reveal differences in genetic variation, particularly between populations of the continuous distribution range and marginal populations. Spanish provenances are distinguished by characteristic patterns of rare alleles (Prus-Głowacki et al. 2012). Scalfi et al. (2009) showed the distinctiveness of Italian provenances derived from the Apennine region. Provenances with different genetic composition are also expected to exhibit different responses to extreme events (Thiel et al. 2012). Thus, the characterisation of their genetic composition, as well as investigation of their response patterns, is of utmost importance to predict the future performance of P. sylvestris provenances in response to increased climatic variability (Martínez-Vilalta et al. 2012). Identification of pre-adapted provenances could then enable assisted migration to be used as a tool to stabilise forest stands for the future (Kreyling et al. 2011).
The response of tree growth to temperature is not uniform. In some experiments warming did not impact growth performance of P. sylvestris (Richter et al. 2012), Pinus nigra (Thiel et al. 2012) or oak species (Kuster et al. 2013). Pumpanen et al. (2012) describe a positive effect of temperature on root biomass, photosynthetic rate and respiration of P. sylvestris, Picea abies and Betula pendula. A rise in temperature can increase P. sylvestris growth as long as water availability is sufficient (Martínez-Vilalta et al. 2008). In contrast, high temperatures accompanied by strong radiation input can boost evaporation rates and negatively affect growth conditions (Pichler & Oberhuber 2007). Therefore an increase in temperatures due to climate change is expected to reduce growth and survival of P. sylvestris trees in warm and dry regions, whereas it will stimulate growth in temperature-limited areas of higher altitudes or northern latitudes (Reich & Oleksyn 2008). In addition, extreme high temperatures are a serious threat since they affect plant metabolism directly (Rennenberg et al. 2006) and have to be taken into consideration.
Clearly, the impact of drought leads to growth reduction and plays a major role in the discussion of mortality and dieback of P. sylvestris (Dobbertin et al. 2007; Eilmann et al. 2011; Vacchiano et al. 2012). Growth reductions due to limited water availability are associated with allocation changes in trees (Delucia et al. 2000; Bréda et al. 2006). Differences in the response to drought stress among provenances are expected, although Thiel et al. (2012) could not prove this for P. nigra provenances. Similar to the results of Czajkowski & Bolte (2006) for Fagus sylvatica, the studies of Cregg & Zhang (2001) and Alia et al. (2001) provide evidence for differences in drought adaptation among P. sylvestris provenances.
In order to obtain a mechanistic understanding of tree responses to extreme events, experiments are indispensable (Jentsch et al. 2007; Reyer et al. 2013). The relevance of results depends on the design of the experiment. Pot experiments easily allow the control of important factors affecting plant responses, but encompass a number of artefacts at the same time (Ray & Sinclair 1998; Passioura 2006). Most importantly, natural root development is hindered, being a trait of major interest in terms of drought response. Root growth is also affected by planting, which has to be taken into account in investigations focusing on seedlings and young plants (Grossnickle 2005; Struve 2009). Furthermore, microclimatic artefacts have to be minimised to simulate climatic extremes as realistically as possible. The manipulation of precipitation using permanent shelters causes various artefacts such as shading or passive warming (Beier et al. 2012). In particular, radiation, as a potential additional stress factor, is often neglected. However, high light stress is one component of stress affecting plants during heatwaves, accompanying a precipitation deficit and maximum temperatures (De Boeck et al. 2010).
In addition, atmospheric feedback in terms of altered potential evapotranspiration is absent under permanent shelters, which could be alleviated by simultaneous heating. Open-top chambers are a viable method for increasing daytime temperature, but their heating capacity is usually limited (Godfree et al. 2011). Active heating via infrared lamps to imitate climate change has been controversial (Aronson & McNulty 2009; Amthor et al. 2010). Experiments using soil heating via heating cables are another approach (Richter et al. 2012), but this method affects belowground parts of plants to a larger extent than aboveground parts. It would be more realistic to directly warm the air enveloping the plants (Amthor et al. 2010).
In this study, we investigated the response of P. sylvestris seedlings to predicted future climate conditions. We tested 10 provenances from the southwestern border of its distribution range up to more central European origins in the field using a factorial combination of warming and drought. Warming was achieved using a novel advanced air heating system preventing excessive soil warming, whereas drought was simulated using an automatic rain-out shelter allowing for high light stress and almost natural radiation throughout the experiment. We assessed plant responses as changes in phenology, growth increment, allocation and overall growth performance. We focused on the following questions: (i) are there differences in growth traits between the treatments and populations; (ii) are there differences between the provenances in their response to drought and warming; (iii) does warming enhance drought stress; (iv) is there a trade-off between performance of provenances under control conditions and under drought; and (v) are we able to identify a provenance better adapted to extreme conditions?
Material and methods
Provenances and treatment of seeds and seedlings
We used seeds of P. sylvestris from 10 different regions for this experiment (Table 1). Except for the German progeny, Alpenkiefer, which was obtained from a seed orchard in Germany (parent trees originate from the Bavarian Alps, above 900 m a.s.l.), all seeds were derived from autochthonous populations. For more details about the origin of seeds as well as genetic information, see Taeger et al. (2013a). Throughout the study we will refer to all progeny simply as ‘provenances’ or ‘populations’.
| no. | origin | country | lat. | long. | alt. (m a.s.l.) | T (°C) | PPT (mm) | DI Min |
|---|---|---|---|---|---|---|---|---|
| S1 | Alto Ebro | Spain | 42°59′ N | 03°17′ W | 860 | 10.1 | 937 | 20 |
| S2 | Montes Universales | Spain | 40°28′ N | 01°53′ W | 1670 | 7.4 | 667 | 14 |
| F3 | Prealpes du Sud | France | 43°45′ N | 06°40′ E | 1185 | 7.8 | 947 | 19 |
| I4 | Emilia Romagna | Italy | 44°30′ N | 10°27′ E | 460 | 10.8 | 886 | 18 |
| C5 | Wallis | Switzerland | 46°18′ N | 07°39′ E | 900 | 6.7 | 1089 | 42 |
| D6 | Hauptsmoorwald | Germany | 49°51′ N | 10°58′ E | 250 | 8.5 | 625 | 26 |
| D7 | Alpenkiefer | Germany | 47°57′ N | 12°54′ E | 420 | 8.7 | 1114 | 44 |
| D8 | Ostdeutsches Tiefland | Germany | 53°04′ N | 13°29′ E | 75 | 8.4 | 571 | 24 |
| P9 | Suprasl | Poland | 53°15′ N | 23°23′ E | 181 | 6.6 | 580 | 29 |
| B10 | Garmen | Bulgaria | 41°43′ N | 23°54′ E | 1300 | 6.2 | 657 | 18 |
- Shown are annual mean temperature (T), annual sum of precipitation (PPT) and the minimum monthly value of the de Martonne drought index (DI Min) during the vegetation period (1951–2000). Climate data were obtained from the WorldClim database (Hijmans et al. 2005).
Five days before sowing, seeds were soaked in water for 12 h. Seeds were sown in a split-plot design on 25 May 2011. Seedling locations within the plots were defined following a regular grid. We sowed 10 seeds at each seedling location, reduced the germinated seedlings at each location to three individuals on 30 July 2011 and further to one individual on 1 March 2012. During the germination period, all plots were covered with a shade net with 25% shading, which was removed at the beginning of July 2011. Thereafter, seedlings were grown under natural light conditions. All plots were fertilised in autumn 2011 and spring 2012. We applied fungicides to prevent damping off and needle cast disease (Previcur N, Bayer; Dithane Ultra, Spiess Urania).
Experimental design
The experiment was set up in a field of the Technische Universität München close to Freising (48°24′ N, 11°41′ E, 445 m a.s.l.). The soil texture of the site was a sandy loam with increasing clay proportion by depth. The climate conditions are characterised by a mean annual temperature of 7.9 °C and a mean annual precipitation of 785 mm (period 1971–2000, German Meteorological Service).
The experiment was set up following a split-plot design (Figure S1). The seedlings were exposed to two temperature levels (ambient, heated) and two levels of precipitation (ambient, dry). The climate manipulations were factorial, resulting in four treatments: control, warm, dry, warm + dry. Each treatment was replicated three times, i.e. 12 whole plots with 10 provenances randomised as a subplot factor. Every subplot contained 12 individuals of the provenances.
A hot water heating system was installed and operational in all heated plots from 1 June to 12 October 2011 and from 26 March to 29 October 2012. We placed a grid of corrugated black plastic tubes 9 cm from the seedlings. The tubes were mounted 2 cm above the ground on top of wooden strips to prevent disproportionate soil heating. Computer-controlled regulation allowed a maximum warming of the seedlings of 4 K (measured at 10 cm above the ground) compared to the control plots. For additional heating, we covered 50% of the ground with stripes of a black water-permeable geomembrane during the heating period in 2012. This resulted in a warming during the heating period of 1.6 K (relative humidity −6%) on average in 2011 and 3.1 K (relative humidity −13%) in 2012 (Fig. 1). Daily temperature maxima were raised about the same magnitude, but warming during the night was about 0.5 K lower than during the day. Soil temperatures at 10-cm depth were increased by about 1 K in 2011 and about 2.8 K in 2012.
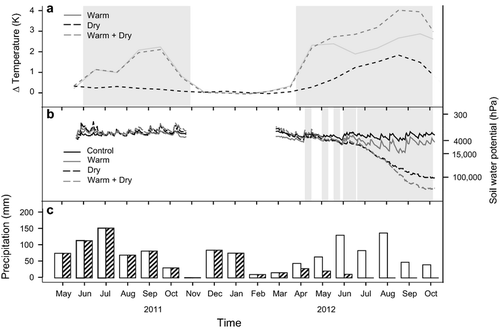
All plots received natural precipitation in 2011. Starting on 12 April 2012, we excluded precipitation of dry plots with an automated transparent rain-out shelter that covered the dry plots only during rain events (Fig. 1). Lateral water movement was prevented down to 80 cm depth by the concrete foundations of the rain-out shelter and plastic sheets. We reduced precipitation of dry plots in April and May 2012 during three 10-day periods from 103 to 50 mm. From 30 May 2012, the rain-out shelter operated until the end of the experiment, with the exception of a power loss during a thunderstorm on 18 June 2012 (Fig. 1). In 2012, this resulted in precipitation for the control plots of 786 mm (550 mm from April to October) and 298 mm (62 mm from April to October) for the dry plots.
Air temperature and relative humidity was measured 10 cm above the surface (representing plant height) in each of the 12 subplots using shaded HOBO sensors (HOBO Pro v2 U23-002; Onset Computer Corp., Boston, MA, USA). At 10-cm depth, soil temperature was monitored with HOBO sensors (HOBO TMC20-HD) and volumetric soil water content with ECH2O EC-5 sensors (Decagon Devices, Inc., Pullman, WA, USA). All devices recorded data at 10-min intervals. The soil-water matrix potentials were determined following the pressure plate method of L.A. Richard (Scheffer & Schachtschabel 1998).
Growth measurements
Seedling emergence percentage was recorded 21 days after sowing. We recorded phenological development of the seedlings every 5–6 days from 20 March to 14 May 2012. Onset dates of phenological stages were linearly interpolated between two consecutive sampling dates following the method of weighted plant development (Cornelius et al. 2011). Height and diameter of the seedlings were recorded at the end of 2011, and in 2012 every 4–6 weeks, beginning on 2 May. The last measurement was taken after harvesting. We measured stem diameter of the seedlings at 1.5 cm above the ground with a digital calliper with a resolution of 0.01 mm (IP 65; Preisser Messtechnik, Gammertingen, Germany). Survival and fitness of seedlings were monitored at each measurement campaign. Dead seedlings were excluded from further growth analysis. Specific leaf area was determined on nine seedlings per provenance and treatment. In August 2012 we harvested 20 needles per individual, assessed leaf area with a computer scanner in combination with the program ImageJ (Brasband 2012) and measured dry weight (after 48 h at 60 °C). Together with the total needle biomass (after harvesting), we calculated whole-plant leaf area. All plants were harvested on 30 October 2012. Roots were excavated carefully down to a depth of 80 cm; rooting depth and taproot length was measured. Proleptic shoots were assessed, and all plants were dried (48 h at 60 °C). We counted buds, and separated buds, needles, stem and root to determine biomass separately.
Statistical analysis
All statistical analyses were performed with Minitab 16 (Minitab Inc., State College, PA, USA) and SPSS version 19.0 (SPSS, Chicago, IL, USA). Percentages of emergence and survival were arcsin transformed prior to statistical analysis (Sachs & Hedderich 2006). Effects of the whole plot factors, warming and drought, the subplot factor provenance and all their interactions were analysed by means of anova using a univariate general linear model (GLM) with a weighted fit for number of samples (weighted least squares) and including the subplot as a random factor. As post hoc tests, Tukey HSD pair-wise tests were conducted. Normality and homogeneity of variances were checked before analysis (Sachs & Hedderich 2006).

To summarise all measured traits, we conducted a principal components analysis.
Results
Emergence, phenology and survival
The percentage emergence differed among provenances (P < 0.001) but not among temperature or drought treatments. German and Polish provenances had the highest emergence (77–84%), whereas those from Spain and France had the lowest emergence (ca. 60%). Due to our experimental set-up (10 seeds per seedling location), all seedling locations were occupied by at least one seedling. Differences among provenances were detected for all phenological development stages during spring 2012. On average over treatments, bud swelling was first observed in German (D7: April 3, D6: April 8) and Polish (P9: April 6) provenances, whereas southern provenances S1, S2 and I4 began swelling about 11 days later (P < 0.001). Bud burst revealed similar behaviour (P < 0.001) but with differences among provenances of <5 days. The mean time period for needle foliation (bud burst to total needle elongation) was shortest for S1, S2 and I4 (16–19 days), whereas needle development of German, French and Polish provenances took 24–30 days (P < 0.001). Warming led to earlier bud burst (P < 0.001) and a longer period for needle foliation (P = 0.035). No significant interaction between provenance and warming was observed for bud burst (P = 0.089) or needle foliation (P = 0.571).
Survival rate at the end of the experiment differed among provenances (P = 0.048) but not among treatments. S1 (68.3%), D8 (68.9%) and S2 (72.9%) had the lowest survival rates, while I4 (78.1%), D7 (77.5%) and F3 (77.0%) had the highest. Neither a significant effect of drought (P = 0.12) nor of warming (P = 0.07) on survival was detected. We excluded mortality caused by the insect Agrotis vestigialis in summer 2011 (10% loss of seedlings overall) from this analysis because damage patterns were random and did not depend on treatment or provenances.
Overall growth traits
Warming had no significant effect on overall stem length, diameter or taproot length of the seedlings after two vegetation periods (Fig. 2). Overall stem length of most provenances was slightly reduced by the drought treatment, but this trend was not significant (P = 0.113). Drought significantly reduced stem diameter by about 18% and increased taproot length considerably (>60% on average over all provenances; Figs 2 and 3). This also led to a significant drought effect on stem length–diameter ratio as well as on root–stem length ratio (P < 0.001; Figure S2, Table S1).
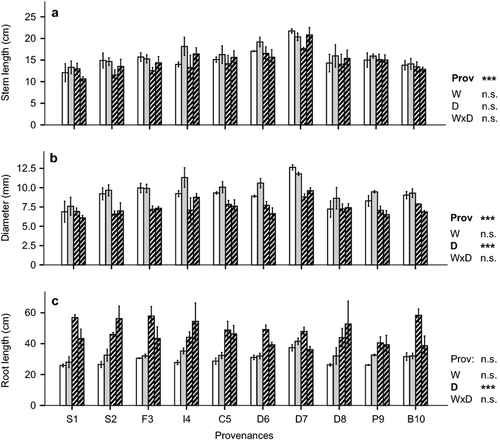
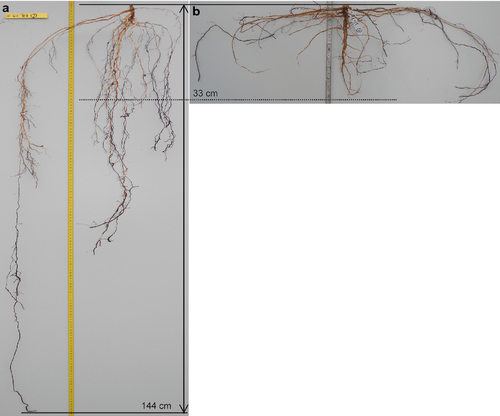
Provenances differed significantly in all measured traits except taproot length (P = 0.544; Fig. 2, Tables S1 and S2). On average, over all treatments, D7 (20.1 cm), D6 (17.1 cm) and I4 (15.5 cm) had longest stem lengths, whereas S2 (13.7 cm), B10 (13.6 cm) and S1 (12.2 cm) were shortest. No interactions between provenance and treatment were observed for stem length and diameter, in contrast to taproot length (Table S1). Response of taproot length to drought differed among provenances (interaction between drought and provenance; P = 0.038). German provenances D6 and D7 had the longest taproots in the control plots (although provenance effects were not significant), and responded to drought with the smallest increase in taproot length (−3% to 58%). In contrast, provenances S1, S2 and D8 almost doubled their taproot length in the dry or warm + dry treatments compared to controls (Fig. 2). This also led to the highest root–stem length ratios of provenances S1, F3 and S2 (Figure S2). In addition, the interaction between provenance and warming was significant for taproot length (P = 0.023), although there was no significant effect of warming.
Effects of warming and drought on increment of stem length and diameter
In contrast to overall stem length, drought led to a significant reduction of stem length increment between July and October 2012 (Table 2, Fig. 4). Mean stem length increment of provenances at plots with ambient rainfall during this period was about 2.4 cm and was reduced 50% by drought. Warming significantly promoted height growth during March and April (P = 0.047), but no significant effect was found for later periods (Fig. 4). Drought had a major effect on diameter increment between July and October, but there was no significant effect of warming (Table 2). However, warming seemed to increase diameter increment of seedlings with ambient rainfall and slightly reduced it under drought (Fig. 4), resulting in a significant interaction of warming and drought.
| stem length increment (July–October) | diameter increment (July–October) | |||||
|---|---|---|---|---|---|---|
| df | F | P | df | F | P | |
| drought | 1 | 141.76 | <0.001 | 1 | 342.72 | <0.001 |
| warming | 1 | 0.97 | 0.354 | 1 | 0.01 | 0.938 |
| drought × warming | 1 | 3.17 | 0.112 | 1 | 6.84 | 0.030 |
| whole-plot error | 8 | 8 | ||||
| provenance | 9 | 2.36 | 0.022 | 9 | 9.58 | <0.001 |
| provenance × drought | 9 | 3.99 | <0.001 | 9 | 3.39 | 0.002 |
| provenance × warming | 9 | 2.32 | 0.024 | 9 | 0.71 | 0.697 |
| provenance × drought × warming | 9 | 0.40 | 0.932 | 9 | 0.78 | 0.636 |
| subplot Error | 72 | 72 | ||||
| total | 119 | 119 | ||||
- Significant P-values (<0.05) are in bold.
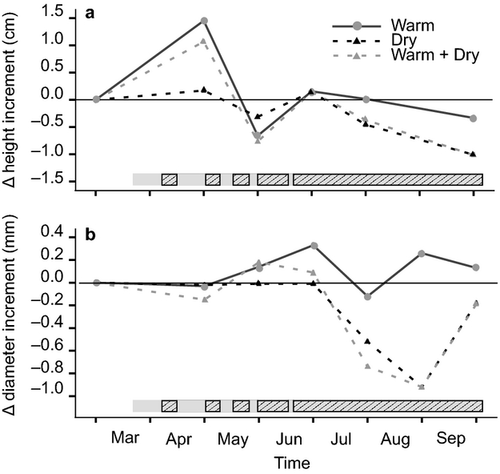
Similar to overall stem length and diameter after two vegetation periods, provenances differed significantly in increment of these two traits for the period July to October. Response to drought was not uniform, as indicated by the significant interaction of drought and provenance (Table 2). The largest reduction compared to control plots was for provenances I4 and D7 in terms of stem length increment, and D7 and F3 for diameter increment, whereas the smallest reduction of both traits was found for D8 (Figure S3).
Biomass allocation
Drought significantly affected whole plant biomass and biomass allocation, whereas the effect of warming was again not significant (Fig. 5, Figure S2, Table S1). Whole plant biomass on average was reduced under drought treatments for all provenances compared to the two treatments with ambient rainfall (control, warm). In terms of biomass allocation, the largest reduction due to drought was seen for bud biomass per plant, decreasing by about 40% over all provenances. This drought effect on bud biomass was clearly caused by a reduction of bud quantity (P < 0.001) and not by average bud weight (P = 0.307; Figure S2, Table S1). Warming seemed to have a (non-significant) positive effect on bud biomass of seedlings with ambient rainfall in contrast to those exposed to drought treatments, resulting in a significant interaction of warming and drought. Root–stem biomass ratios were significantly increased by drought (Fig. 5). Whereas drought reduced stem biomass by about 35% (P < 0.001; Table S1), there was no significant effect on root biomass (P = 0.054; Figure S2, Table S1). Whole plant leaf area did not differ significantly among treatments (Fig. 5), although specific leaf area was slightly increased by drought (P = 0.017; Figure S2).
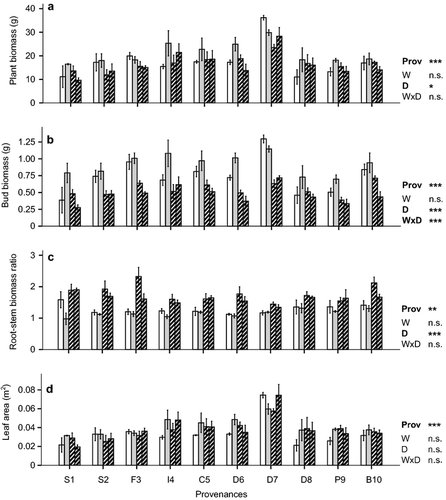
Provenances differed in whole plant biomass, all measures of biomass allocation and leaf area traits. Whole plant biomass of the German provenance D7 over all treatments (29.5 g) was on average twice that of the lightest provenances; S2 (15.2 g), P9 (15.0 g) and S1 (12.7 g). Provenance D8 had the lowest whole plant biomass in the control treatment, with higher values under drought treatments. Nevertheless, there were no interactions between provenance and either warming or drought. All compartments of D7 had the largest dry weights compared to all other provenances (Fig. 5, Table S1). D8 and S1 had the lowest bud biomasses on average over all treatments, while at the same time showing the least reduction of this trait under drought conditions. For bud biomass the interaction between drought and provenance was significant (P < 0.001; Table S1). Differences in root–stem biomass ratios among provenances were increased by drought, resulting in a significant interaction between drought and provenance. Root–stem biomass ratio of D7 showed almost no response to drought, whereas S2 and F3 increased their root–stem biomass ratios considerably under drought. Due to their low average needle biomass over all treatments (Figure S2), whole plant leaf area was lowest in the Spanish provenances S1 (0.025 m2), S2 (0.030 m2) and the German provenance D8 (0.033 m2).
Summarising provenance performance
Provenance responses to the four treatments are summarised in Tables S1 and S2. Phenotypic plasticity, assessed for root length and for root–stem biomass ratio as RDPIS, differed significantly among provenances (Table 3). Highest values of RDPIS were found for S1, S2, D8 (regarding root length) and S1, F3 (root–stem biomass ratio), whereas D7 had the lowest RDPIS.
| provenance | RDPIS root length | RDPIS root–stem biomass ratio |
|---|---|---|
| S1 | 0.23 ± 0.03 a | 0.21 ± 0.04 a |
| S2 | 0.22 ± 0.03 a | 0.17 ± 0.02 ab |
| F3 | 0.18 ± 0.03 ab | 0.20 ± 0.03 a |
| I4 | 0.17 ± 0.03 ab | 0.12 ± 0.02 ab |
| C5 | 0.17 ± 0.02 ab | 0.13 ± 0.02 ab |
| D6 | 0.14 ± 0.02 ab | 0.16 ± 0.02 ab |
| D7 | 0.09 ± 0.01 b | 0.08 ± 0.01 b |
| D8 | 0.21 ± 0.03 a | 0.13 ± 0.02 ab |
| P9 | 0.13 ± 0.02 ab | 0.12 ± 0.02 ab |
| B10 | 0.19 ± 0.03 ab | 0.14 ± 0.02 ab |
| anova | ||
| df | 9, 170 | 9, 170 |
| F | 2.97 | 2.61 |
| P | 0.003 | 0.007 |
- Plasticity was calculated according to Valladares et al. (2006). Given are mean values ± SE for each provenance (N = 18). Results of the Tukey test are indicated with letters; mean values followed by the same letter are not significantly different. Results for one-way anova are shown; significant results are in bold (P < 0.05).
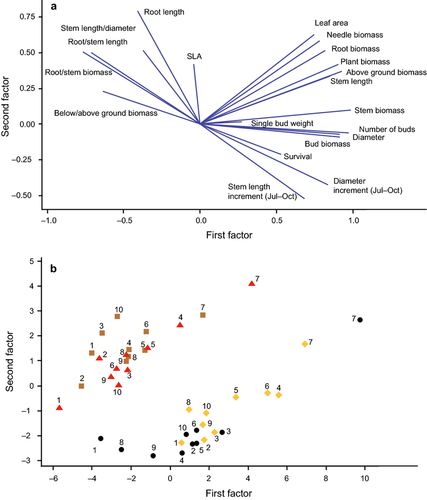
A principal components analysis was conducted to summarise the overall growth performance of the provenances in all treatments (Fig. 6) based on 20 measured parameters and calculated ratios. The first two factors explained 73.3% of the variance. The control and warm treatments had the highest values of the first factor, mainly representing aboveground growth traits (and root biomass), and lower values of the second factor representing root growth and root/stem ratios than the dry and warm + dry treatments. Thus there was a clear separation of plants with drought treatments from plants without drought treatments. Treatments receiving ambient rainfall showed a positive response to temperature in aboveground growth traits, resulting in higher values of the first and second factor for provenances of the warm treatment, with the exception of D7. Within the two drought treatments (dry, warm + dry) there was no clear separation due to temperature.
Discussion
Genotypic variation
Provenance differences in phenology and growth traits, even in the absence of climate manipulations, were expected to be related to genetic differences among the selected provenances (Taeger et al. 2013a). In that earlier study, genetic variability and genetic diversity were found to increase from westernmost to central European provenances, and Italian, French and Spanish provenances showed strong differentiation from all other provenances. In the field experiment presented here, seedling emergence was lower than in the earlier greenhouse experiment. Nevertheless, seedling emergence revealed a similar correlation to latitude, with lower rates of emergence in southern provenances.
The advanced phenological development during spring of provenances from origins of higher latitude is also in agreement with other studies (Beuker 1994; Chmura et al. 2012). Due to genetic differences, provenances also differed in almost all measured growth traits, as found in the earlier study; again revealing superior growth performance of the German alpine P. sylvestris (D7) and lower aboveground growth of southern provenances (Taeger et al. 2013a). Since the seeds of the German provenance D7 were derived from ‘plus’ trees in a seed orchard, the superior growth performance can be explained at least partially as genetic gain (Ahtikoski & Pulkkinen 2003; Wennström et al. 2007). No correlations of other growth traits to genetic parameters or climate parameters of seed origin were detected (data not shown).
Effects of temperature and drought on P. sylvestris
Under projected climate change, an increase in temperature and in drought periods will impact tree growth and forests in Europe (Lindner et al. 2010). Warming can enhance plant growth through higher carbon storage if water availability is not limited (Chung et al. 2013), but can also promote drought stress because of a rise in water vapour pressure deficit (Park Williams et al. 2012). The growth reduction due to drought (Bréda et al. 2006) is associated with tree mortality in numerous studies (Bigler et al. 2006; Sánchez-Salguero et al. 2012).
In this study, warming advanced the development of spring phenology, as demonstrated in bud swelling, bud burst and the increase in stem length growth during early spring. This is in agreement with findings of other studies for P. sylvestris (Repo et al. 1996), P. nigra (Thiel et al. 2012) and oak species (Morin et al. 2010). The phenological response of P. sylvestris to climate change might be even more pronounced, since Wolkovich et al. (2012) showed that experiments tend to under-predict the response to increased temperatures.
The extended growing season of seedlings exposed to warming did not lead to significantly higher growth. In fact, the only significant effect of warming is seen in the number of developed buds. Limited effects of temperature on growth yields were also found in other short-term experiments (Arend et al. 2011; Richter et al. 2012; Thiel et al. 2012). A meta-analysis by Wu et al. (2011) suggested that stronger plant responses to warming were reported in long-term experiments. Nevertheless, we see a contrasting effect of temperature on the development of number of buds, bud biomass and diameter increment (July–October) depending on water availability and resulting in a significant interaction of warming and drought. Warming led to an increase in number of buds, bud biomass and diameter increment (July–October) with ambient rainfall, whereas under drought this effect was absent (number of buds) or even reversed (bud biomass and diameter increment (July–October)). Therefore, in our experiment, drought stress was clearly enhanced by warming in terms of bud biomass and diameter increment. The described plant responses reflect the two hypotheses of possible temperature effects of Park Williams et al. (2012) and Chung et al. (2013) described above.
As expected, drought had a major impact on almost all growth traits of the P. sylvestris seedlings. The reduction in height growth (stem length increment), diameter growth and bud formation is consistent with findings of Bréda et al. (2006) and also with dendroclimatic results (e.g. Thabeet et al. 2009). The timing of the drought conditions explains the absence of drought effects on overall stem length, needle biomass and, consequently, leaf area. During the 2012 vegetation period the bulk of stem length and needle biomass was developed before drought conditions came into effect, similar to the results of the experiment of Thiel et al. (2012). We expect that the lower number of buds and lower bud biomass would have triggered considerable reductions in leaf area and height growth during the following year (Larcher 2001; Bréda et al. 2006).
In contrast to overall root biomass, the parameters taproot length, root–stem ratio of length and biomass were significantly increased by drought. The magnitude of taproot length and rooting depth developed by 2-year-old seedlings in quite heavy soil exposed to drought conditions is remarkable. Our results regarding a drought response of root length and root–stem ratio, but not of root biomass, match those of Joslin et al. (2000) and Poorter et al. (2012). In addition, Goisser et al. (2013) found increasing root depth and root–shoot ratios of beech seedlings under drought conditions, in agreement with our results. A reduction in fine root mass of P. sylvestris under drought, as shown by Palatova (2002), could not be confirmed in our study, since we did not focus on this particular root compartment. The development of a deep rooting system and the change in allocation from aboveground to belowground compartments under drought conditions are key strategies of drought avoidance and tolerance (Reader et al. 1993; Bréda et al. 2006). In our experiment, seedlings of all provenances revealed a plastic response of root growth under drought conditions. Therefore, they probably avoided more severe drought conditions as they reached the water resources of deeper soil layers that were not reflected in our measurements of soil water potential at 10-cm depth. This result may explain why there was no treatment effect on the survival of P. sylvestris seedlings.
Provenance-specific response to drought and temperature
In contrast to air warming, P. sylvestris seedlings responded strongly to drought treatments. All provenances showed phenotypic plasticity to a notable extent, summarised as the distinct separation of provenances by drought in the principal components analysis. These short-term adaptations to changes in site conditions are of major importance with regard to expected climate change (Vitasse et al. 2010). Drought responses of provenances were not uniform, contradicting the results found for seedlings of P. nigra by Thiel et al. (2012). Provenance differences in our study were detected for growth increment during the drought period as well as for root and root-stem ratios, which these authors did not consider. However, our results confirm the findings of an experiment comprising provenances of three oak species (Arend et al. 2011) and, similar to those authors, we were not able to correlate diverging drought resistance (defined as low growth reduction during drought; Figure S3) with climatic parameters of seed origin (data not shown).
The largest aboveground growth parameters were found for the German provenance D7, no matter what treatment they were exposed to. Therefore this provenance is clearly separated from all other provenances in the principal components analysis. Regarding the drought treatment, the Spanish provenances S1 and S2 represent the most conservative provenances, with low investment in aboveground structures compared to root growth. Surprisingly, the reduction in relative height growth and relative diameter growth by drought of southern provenances was not significantly less than that of other provenances, as was implied in an earlier greenhouse experiment (Taeger et al. 2013a). The significantly lower reduction in height and diameter increment of the German provenance D8 is probably not due to specific drought adaption. These values of relative increment are calculated as a ratio to that of control plants. Therefore the low performance of control plants, as indicated by various other traits such as leaf area or overall plant biomass, of this provenance could be a more likely explanation. In addition to drought resistance, it would also have been interesting to analyse drought recovery and resilience parameters of these provenances, as these are important aspects of drought tolerance (Lloret et al. 2011; Pretzsch et al. 2013; Taeger et al. 2013b); due to harvesting immediately after the drought treatment, this was not possible.
Nevertheless, drought response of provenances differed in terms of taproot length and root–stem ratio of length and biomass. The lowest drought responses regarding these traits in the German provenance D7 compared to all other provenances are explained by their long taproots and large root biomass even under non-drought conditions, providing access to deeper water resources regardless of which treatment they were exposed to. Control plants of D7 had twice as much root biomass as control plants of almost all other provenances, but due to the highest aboveground growth traits, their root–stem ratios were within the range of other provenances.
Southwestern provenances from France (F3) and Spain (S2, S1) with unexceptional values of taproot length and root–stem ratios under non-drought conditions responded to drought with the strongest increase in root length and root–stem ratio and showed the strongest phenotypic plasticity regarding these traits. We show that the increase in root–stem length ratio and root–stem biomass ratio is driven by higher allocation of resources to deeper roots rather than a disproportionate reduction of stem growth under drought. In accordance with Poorter et al. (2012), morphological traits are altered to a greater extent than biomass allocation. Southwestern provenances revealed the strongest phenotypic plasticity, contradicting the results of Richter et al. (2012) derived from an experiment on seedling development of a smaller number of provenances during the first vegetation period, suggesting that southern provenances are less plastic than continental ones. However, in accordance with Richter et al. (2012), we can confirm that southern provenances of P. sylvestris, especially Spanish ones, show low investment in aboveground structures, which can be linked with drought adaptation (Alia et al. 2001; Valladares et al. 2007). Drought adaptation comes at the cost of low growth of aboveground traits and could also be shown for adult trees of P. sylvestris provenances (Taeger et al. 2013b). Cregg & Zhang (2001) found that Asian P. sylvestris seedlings were better adapted to drought than European ones due to lower height growth and higher allocation of biomass to roots. Accordingly, we argue that the strong phenotypic plasticity of southwestern provenances is due to a specific drought adaption, which is expected of provenances from the warm and dry margin of the species distribution. Under increasing frequencies of severe droughts in the face of climate change, these provenances could thus have an advantage. Because the strong plastic response of all provenances exposed to drought prevented diebacks, this finding currently remains hypothetical. This study is based on plant responses during the first two vegetation periods of seedlings, which should be borne in mind when interpreting results. Furthermore, plant responses could be modified by various additional factors, such as light availability (Goisser et al. 2013), soil type (Lindsey & Kilgore 2013) or changes in the atmospheric composition (Huttunen & Manninen 2013). Moreover, interactions with pests and pathogens were not considered in our study.
However, our results confirm that neglecting provenance differences will underestimate the future adaptedness and adaptability of tree species in the face of climate change (Oney et al. 2013). Provenance differences in phenotypic response and drought adaptation of southwestern provenances argue for the concept of assisted migration as a forest management strategy (Kreyling et al. 2011). On the other hand, such local adaptations to one specific climatic extreme may carry the risk that these provenances are not adapted to other climatic extremes, e.g. frost hardiness (Kreyling et al. 2012). This risk is amplified by the low genetic diversity and genetic variation of the southwestern provenances compared to the northeastern provenances in our study. Furthermore, the decision on which provenance is best suited is rather difficult since it depends on the particular desired traits and must also include economic aspects of tree growth, such as wood quality. Therefore, there is a need for further experiments that should be complemented by long-term, standardised provenance trials that include those southwestern provenances.
Acknowledgements
This work was financed by the Bavarian Ministry of Food, Agriculture and Forestry with funds of the Bavarian Climate Program 2020 (project KLIP 10), and by the European Research Council under the European Union Seventh Framework Programme (FP7/2007–2013/ERC grant agreement No. 282250). We thank Andreas Ludwig for advice regarding the handling of seeds and seedlings, Nicole Estrella for helpful discussions, Nik Hofmann for technical support, Sebastian Friedrich for installing the heating system and all colleagues for providing seed material. We further thank the team of the GHL Dürnast, staff members and numerous student workers for outstanding help during the fieldwork. The support of the Technische Universität München Institute for Advanced Study, funded by the German Excellence Initiative, is gratefully acknowledged.


