Novel non-alcoholic steatohepatitis model with histopathological and insulin-resistant features
Abstract
Although several non-alcoholic steatohepatitis (NASH) models have been reported to date, few of these models fully reflect the histopathology and pathophysiology of human NASH. The aim of this study was to establish a novel NASH model by feeding a high-fat (HF) diet and administering both carbon tetrachloride (CCl4) and the Liver X receptor agonist T0901317. Male C57BL/6J mice were divided into four groups (each n = 5): HF, HF + CCl4, HF + T0901317, and the novel NASH model (HF + CCl4 + T0901317). CCl4 (0.1 mL/kg) and T0901317 (2.5 mg/kg) were intraperitoneally administered four times and five times, respectively. The livers of the novel NASH model group presented a whitish colour. The serum levels of TNF-α and IL-6 were significantly increased in the novel NASH model group, and mice in this group exhibited histopathological features and insulin resistance reflective of NASH, i.e., macrovesicular hepatic steatosis, ballooning hepatocytes, Mallory-Denk bodies, lobular inflammation and fibrosis. The novel NASH model group presented significantly upregulated expression levels of mRNAs related to lipogenesis, oxidative stress, fibrosis and steatosis and significantly downregulated expression levels of mRNAs related to triglyceride export. We successfully established a novel experimental NASH model that exhibits similar histopathology and pathophysiology to human NASH.
Metabolic syndrome has been increasing worldwide concomitant with the increased prevalence of obesity, diabetes mellitus, and hyperlipidemia. Non-alcoholic fatty liver disease (NAFLD) was recently recognized as a hepatic manifestation of metabolic syndrome.1 NAFLD consists of simple hepatic steatosis and NASH.2 NASH is diagnosed using only histopathological findings, i.e., hepatic steatosis, ballooning hepatocytes, lobular inflammation and perisinusoidal fibrosis. Currently, NAFLD is present in 20–40% of the general population of industrialized countries.3, 4 Among all patients with NAFLD, features of NASH are observed in 10–20%.5, 6 Thus, NAFLD is considered a common chronic liver disease. Because studies of NASH using human materials are limited by ethical concerns regarding the administration of drugs to patients or the collection of liver tissues from patients, the pathogenesis of NASH is currently not well understood, and treatments for NASH have not been established.
In recent years, many experimental NASH models have been reported.7-11 The methionine-/choline-deficient (MCD) model has been widely used for basic studies of NASH.12 The advantage of the MCD model is that it can rapidly induce steatohepatitis in mice. After three weeks of MCD feeding, steatohepatitis is well developed, and after 8–10 weeks, pericellular and perisinusoidal fibroses are present.13 The disadvantages of this model are that the mice exhibit a dramatic body weight loss and do not develop insulin resistance.13, 14 As a result, these features of the MCD model do not fully reflect the clinical features of human NASH.
A high-fat (HF) diet model is also widely used for the basic study of NASH because it causes obesity and insulin resistance.15 In the HF diet models, long-term feeding of a HF diet leads to steatohepatitis that resembles that observed in human NASH.16 However, this model is not suitable for researching the pathogenesis of NASH because a long time is required for the development of NASH symptoms and because the hepatic fibrosis in the model animals is weaker than that found in human NASH.16 Therefore, the establishment of a novel animal model that exhibits features similar to those of human NASH is necessary for the basic study of NASH.
We aimed to develop a novel NASH model by feeding an HF diet and administering both carbon tetrachloride (CCl4) and T0901317, which resulted in a combination of multiple important factors, including overnutrition, oxidative stress and lipogenesis. The administration of CCl4 is known to induce chronic oxidative stress and liver injury in mice, and CCl4 has been used to create acute hepatitis animal models.17 An analysis of histopathological findings has revealed that CCl4 leads to inflammation and fibrosis but not steatosis or ballooning. The liver X receptor (LXR) is a nuclear receptor that plays a key role in regulating cholesterol, fatty acid and glucose metabolism.18 The LXR activator T0901317 has been recognized as a potential target for the treatment of atherosclerosis. However, T0901317 produces several severe side effects, including hepatic steatosis.18
The aim of this study was to establish a novel NASH model with histopathological and insulin-resistance features similar to those of human NASH.
MATERIALS AND METHODS
Animals
Six-week-old male C57BL/6J mice were obtained from Charles River Laboratories JAPAN, Inc. (Kanagawa, Japan) and were acclimated for one week before the start of the experiment. The mice were maintained under a 12 h light-dark cycle and had free access to standard chow and tap water. The animal experiments were conducted in a humane manner after receiving approval from the Institutional University Experiment Committee of the University of Tsukuba and in accordance with the Regulations for Animal Experiments of the university and Fundamental Guidelines for Proper Conduct of Animal Experiment and Related Activities in Academic Research Institutions under the jurisdiction of the Ministry of Education, Culture, Sports, Science, and Technology.
Experimental groups
Twenty mice were divided into the following four groups (n = 5 per group): (i) the mice in the HF group were fed an HF diet (60 kcal% fat, D12492, Research Diets, Inc., New Brunswick, NJ, USA) for four weeks; (ii) the mice in the HF + CCl4 group were fed an HF diet for four weeks and administered CCl4 (Wako Pure Chemical Industries, Ltd., Osaka, Japan) intraperitoneally (i.p.) twice a week for the final two weeks; (iii) the mice in the HF + T0901317 group were fed an HF diet for four weeks and administered T0901317 (Cayman Chemical Co., Ann Arbor, MI, USA) solubilized in DMSO i.p. once a day for the final five days; and (iv) the mice in the novel NASH model group were fed an HF diet for four weeks and administered both CCl4 and T0901317, as described above. The CCl4 dose was 0.1 mL/kg, and the T0901317 dose was 2.5 mg/kg.
Twenty-four hours after the final administration of CCl4 or T0901317, the mice were killed by exsanguination under isoflurane anesthesia. Blood samples were collected from the orbital capillary and centrifuged at 3,000 rpm for 10 min to isolate the serum. Each sample was stored at −30°C until analysis. The liver was rapidly removed and weighed. The right medial lobe of the liver was immediately fixed in 10% neutral-buffered formalin for further histological examination.
Histological analysis
The fixed liver tissues were processed and embedded in paraffin using standard methods. The liver tissues were assessed by cutting into 2 µm thick paraffin sections, staining with haematoxylin and eosin, and evaluating the extent of inflammation and hepatocellular ballooning. Fibrosis was evaluated by Masson's trichrome and Sirius red staining. Steatosis was evaluated by Oil Red O staining. The steatosis area was quantified using a BZ-X710 hybrid cell count system (KEYENCE, Corp., Osaka, Japan). For each section, at least ten non-consecutive random digital images were obtained. The liver specimens were evaluated by an experienced pathologist in a blinded fashion, and the severity of hepatocellular steatosis, inflammation and ballooning was assessed using the following NAFLD activity scores (NAS). With respect to hepatocellular steatosis, the specimens were classified into grades 0–3 (grade 0, steatosis occupied less than 5% of the hepatic parenchyma; grade 1, steatosis occupied 6–33% of the hepatic parenchyma; grade 2, steatosis occupied 34–66% of the hepatic parenchyma; and grade 3, steatosis occupied more than 66% of the hepatic parenchyma). In terms of inflammatory cell infiltration, the specimens were classified as grades 0–3 (grade 0, no infiltration; grade 1, one to two foci per 200× field; grade 2, three to four foci per 200× field; and grade 3, more than four foci per 200× field). With respect to hepatocellular ballooning, the specimens were classified into grades 0–2 (grade 0, no ballooning; grade 1, few balloon cells; and grade 2, many cells/prominent ballooning). Hepatic fibrosis was classified as stage 0–4 (stage 0, no fibrosis; stage 1, mild, perisinusoidal or periportal fibrosis; stage 2, moderate, perisinusoidal and periportal fibrosis; stage 3, bridging fibrosis; and stage 4, cirrhosis).19
Biochemical analysis
The serum levels of aspartate aminotransferase (AST), alanine aminotransferase (ALT), triglyceride (TG), and total cholesterol (T-CHO) were measured with a FUJI DRI-CHEM 7000 V serum multiple biochemical analyser (Fujifilm, Co. Tokyo, Japan).
The serum levels of tumor necrosis factor alpha (TNF-α) and interleukin-6 (IL-6) were measured using a mouse enzyme-linked immunosorbent assay (ELISA) kit (BioLegend, Inc., San Diego, CA, USA).
Insulin tolerance test (ITT)
Four groups of mice subjected to the same regimen (n = 5 per group) were assessed using the ITT. The mice were fasted for 4 h before the injection of insulin (Humulin R, 0.75 U/kg, i.p.; Eli Lilly, Co., Kobe, Japan). The blood glucose levels in the tail vein blood were measured 0, 15, 30, 60, 90 and 120 min after the insulin injection.
Gene expression analysis
Liver tissue samples were freshly collected and immediately frozen at −30°C until use. The frozen liver samples were homogenized, and total RNA was isolated from whole cells using a NucleoSpin RNA kit (Takara Bio, Inc., Otsu, Japan). The RNA concentrations were determined by measuring the absorbance at 260/280 nm with a NanoDrop Spectrophotometer (Thermo Fisher Scientific, Inc., Wilmington, DE, USA). The synthesis of complementary DNA was performed using AMV Reverse Transcriptase (Promega, Corp., Madison, WI, USA) and random primers (Takara Bio, Inc. Otsu, Japan). Briefly, a mixture of 1 mM dNTPs (Fermentas Life Sciences, Inc., Burlington, ON, Canada), 0.025 µg/mL random primers, 0.25 U/mL reverse transcriptase, and 500 ng of total RNA was incubated at 30°C for 10 min, 37°C for 60 min, 95°C for 5 min and at 4°C prior to storage at −80°C.
The primers for RT-PCR were designed using Primer Express software for Real-Time PCR ver. 3.0 (Applied Biosystems, Inc., Foster City, CA, USA) based on the sequences available in GenBank. The primers were purchased from Hokkaido System Science Co., Ltd. (Hokkaido, Japan) and Takara Bio, Inc. (Otsu, Japan). The Srebp-1c primer sequences were 5’-GCAGCCACCATCTAGCCTG-3’ and 5’-CAGCAGTGAGTCTGCCTTGAT-3’. The Fas primer sequences were 5’-GGAGGTGGTGATAGCCGGTAT-3’ and 5’-TGGGTAATCCATAGAGCCCAG-3’, and the ApoB primer sequences were 5’-TTGGCAAACTGCATAGCATCC-3’ and 5’-TCAAATTGGGACTCTCCTTTAGC-3’. The Gstm3 primer sequences were 5’-CATCCGCTTGCTCCTGGAATA-3’ and 5’-GATGGCATTGCTCTGGGTGA-3’. The Scd1 primer sequences were 5’-TGTCTGACCTGAAAGCCGAGAA-3’ and 5’-AGCACCAGAGTGTATCGCAAGAA-3’. The Scd2 primer sequences were 5’-GCTGCATTTGGGAGCCTTGTA-3’ and 5’-CCATGGTGTTGGCAATGATGA-3’. The Ly6d primer sequences were 5’-AGCTCTGCTCGTCCTCCTTGTC-3’ and 5’-TCCTCACCAGGTTCCCATTCA-3’, and the Lepr primer sequences were 5’-GGCACCATTTCCGCTTCAATA-3’ and 5’-ACCAGCAGAGATGTAGCTGAGACAA-3’, and the GAPDH primer sequences were 5’-TGCATCCTGCACCACCAACT-3’ and 5’-AACACGGAAGGCCATGCCAG-3’. Glyceraldehyde-3-phosohate dehydrogenase (GAPDH) was used as an endogenous control. RT-PCR was performed using SYBR-Green Real-time PCR Master Mix-Plus (Toyobo Co., Ltd., Osaka, Japan) and an Applied Biosystems 7300 Real-time PCR system (Applied Biosystems, Inc., Foster City, CA, USA) as recommended by the manufacturers.20
Microarray analysis
A DNA microarray analysis was conducted using RNA samples isolated from liver tissues from the HF group and the novel NASH model group. Labelled cRNA was synthesized from 100 ng of total RNA using a GeneChip 3’ IVT Plus Reagent Kit (Affymetrix, Inc., Santa Clara, CA, USA) according to the manufacturer's recommended protocol. Fragmented and labelled cRNA (7.5 μg) was hybridized to an Affymetrix Mouse MG-430 PM Array Strip (Affymetrix) for 16 h at 45°C. The strips were washed and stained using a GeneAtlas Fluidics Station 400 (Affymetrix), and the resulting images were scanned using a GeneAtlas Imaging Station (Affymetrix). Probe-level analysis, including background subtraction and quantile normalization, was conducted using the robust multi-array average algorithm (RMA) with Affymetrix Expression Console Software 1.4 (Affymetrix). The gene expression profile of the novel NASH model was compared with that of the HF group. Genes showing a more than two-fold increase in expression were classified as upregulated genes and less than 0.5 fold decrease in expression were classified as downregulated.
Statistical analysis
All data are expressed as the mean ± standard deviation. Statistical analyses were conducted using PRISM. Inter-group differences were assessed by one-way analysis of variance (ANOVA) with the Holm-Sidak post-test. Pairwise comparisons of the ITT results were performed using Student's t-test. In all cases, P values less than 0.05 were considered to indicate statistical significance.
RESULTS
The novel NASH model developed liver injury, dyslipidaemia and hypercytokinaemia
Findings at laparotomy and gross appearance of the liver
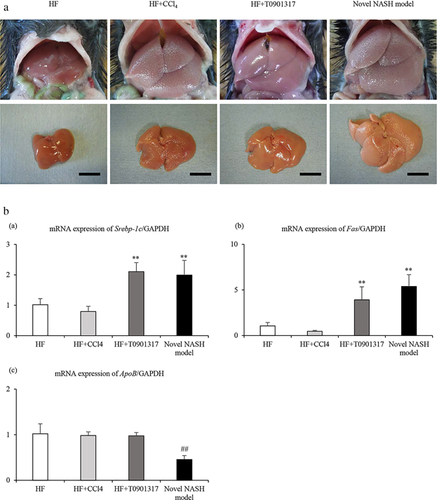
There was no findings of necrosis or inflammation at the intraperitoneal injection site. The livers of the novel NASH model group indicated a whitish colour and an uneven surface that could be recognized even with the naked eye and was markedly enlarged relative to the other groups (Fig. 1a).
Body and liver weight
Table 1 indicates the body weights, liver weights and liver-to-body weight ratios of the mice. The final body weight was increased in all the groups relative to the initial body weight. The final and initial body weight in the CCl4 group and the novel NASH group was nearly to the mice fed the normal diet (data was not shown). The liver weight and liver-to-body weight ratio were significantly higher in the novel NASH model group than in the other groups.
| HF | HF + CCl4 | HF + T0901317 | Novel NASH model | |
|---|---|---|---|---|
| Body weight (g) | ||||
| Initial | 23.2 ± 1.1 | 22.9 ± 0.8 | 22.3 ± 0.5 | 22.4 ± 0.4 |
| Final | 31.7 ± 1.8 | 30.4 ± 0.9 | 27.6 ± 1.1** | 27.0 ± 1.8** |
| Liver weight (mg) | 1339 ± 151 | 1546 ± 128 | 1798 ± 167** | 2491 ± 253** |
| Liver/body weight (%) | 4.24 ± 0.49 | 5.08 ± 0.33* | 6.50 ± 0.51** | 9.21 ± 0.37** |
| Biochemical parameters | ||||
| ALT (U/L) | 58.3 ± 47.4 | 1425 ± 347.4## | 83.7 ± 30.6 | 739.6 ± 494.2** |
| AST (U/L) | 79.2 ± 39.6 | 613.8 ± 139.9** | 107.7 ± 27.4 | 620.8 ± 251.4** |
| TG (mg/dL) | 128.8 ± 22.3 | 145.2 ± 46.2 | 172.2 ± 35.3 | 509.4 ± 252.3## |
| T-CHO (mg/dL) | 129.3 ± 10.5 | 157.5 ± 14.8** | 198.7 ± 6.1** | 125.4 ± 18.2 |
| Inflammatory parameters | ||||
| TNF-α (pg/mL) | 4.72 ± 2.88 | 5.30 ± 0.93 | 3.56 ± 0.64 | 10.80 ± 3.48## |
| IL-6 (pg/mL) | 4.79 ± 2.06 | 23.65 ± 9.41 | 11.60 ± 6.67 | 372.12 ± 107.36## |
- Note: ALT, alanine aminotransferase; AST, aspartate aminotransferase; TG, triglyceride; T-CHO, total cholesterol; TNFα, tumour necrosis factor-α; IL-6, interleukin-6. Data are mean ± SD (n = 5). *P < 0.05, ** P <0.01 vs HF group (control). ## P < 0.01 vs other groups.
Serum parameters
Table 1 indicates the serum parameters responsible for liver injury, lipid metabolism and inflammatory cytokines in mice. The serum ALT and AST levels were significantly increased in the HF + CCl4 group relative to the other groups and increased in the novel NASH model group relative to the HF and HF + T0901317 groups. Furthermore, the serum TG level was significantly increased in the novel NASH model group relative to the other groups. The serum TNF-α and IL-6 concentrations were measured as indicators of circulating inflammation, and their levels were significantly higher in the novel NASH model group relative to the other groups.
Liver expression of genes involved in lipid metabolism
Figure 1b indicates the mRNA levels of Srebp-1c, Fas and ApoB. Srebp-1c and Fas are related to de novo lipogenesis in the liver, whereas ApoB is related to lipid transport in the liver. The mRNA expression levels of Srebp-1c and Fas were significantly upregulated in the HF + T0901317 and novel NASH model groups relative to the HF and HF + CCl4 groups. The mRNA expression level of ApoB was significantly downregulated in the novel NASH model group relative to the other groups.
Insulin sensitivity
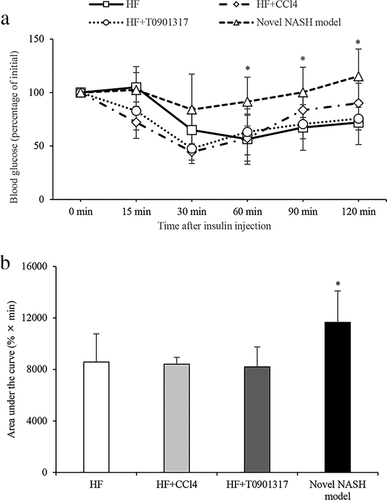
Insulin resistance was evaluated using the ITT. The glucose level after insulin injection remained high in the novel NASH model group (Fig. 2a). The glucose level measured in the novel NASH model group was significantly higher than that of the HF group at 60 min, 90 min and 120 min, and the area under the curve of the novel NASH model group was significantly higher than that of the HF group (Fig. 2b).
Histological findings
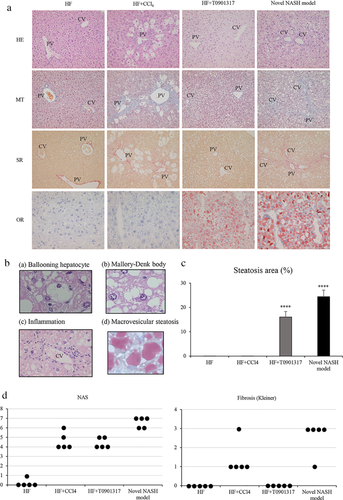
Figure 3a indicates the liver histology of each group. The novel NASH model group developed macrovesicular hepatic steatosis, ballooning hepatocyte with Mallory-Denk bodies, lobular inflammation and bridging fibrosis (Fig. 3b). In the novel NASH group, hepatic steatosis was found in the whole liver. The steatosis area in the liver was significantly larger in the novel NASH model group relative to the other groups (Fig. 3c). In the novel NASH group, the lobular inflammation was found in zone 1 in the liver and the hepatic fibrosis was found from zone 1 to zone 3. The average values of the NAS and the stage of hepatic fibrosis obtained for the novel NASH model group were 6.6 and 2.6, respectively, and both values were significantly higher than those found for the other groups (Fig. 3d).
Liver expression of genes involved in NASH
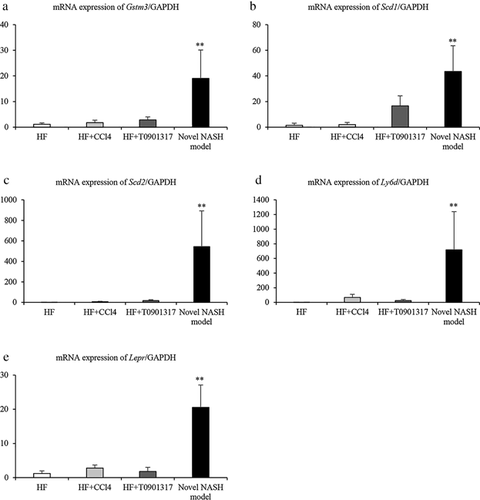
Table 2 indicates the results of the microarray analysis. Eight genes were significantly upregulated and five genes were significantly downregulated in the novel NASH group. Five genes (Gstm3, Scd1. Scd2, Ly6d, and Lepr) related to NASH were detected. Furthermore, the expression of these five genes in all the groups was further confirmed by real-time PCR. The mRNA expression levels of all the tested genes were significantly upregulated in the novel NASH model group relative to the other groups (Fig. 4).
| Relation | Gene symbol | Gene Name (Description) | Fold change | P-value | Regulation |
|---|---|---|---|---|---|
| CYP4A11 | Cytochrome P450, family 4, subfamily A, polypeptide 11 | 2.78 | 0.005 | Up | |
| Oxidative stress | Gstm3 | Glutathione S-transferase mu 3 | 2.69 | 0.013 | Up |
| Lipogenesis | Scd2 | Stearoyl-CoA desaturase (delta-9-desaturase) | 2.67 | 0.001 | Up |
| RAD51B | RAD51 paralog B | 2.34 | 0.007 | Up | |
| Hepatic fibrosis | LEPR | leptin receptor | 2.28 | 0.025 | Up |
| Hepatic steatosis | LY6D | lymphocyte antigen 6 complex, locus D | 2.26 | 0.001 | Up |
| Lipogenesis | Scd1 | Stearoyl-CoA desaturase (delta-9-desaturase) | 2.09 | 0.003 | Up |
| BIRC5 | baculoviral IAP repeat containing 5 | 2.03 | 0.016 | Up | |
| MOXD1 | monooxygenase, DBH-like 1 | 0.47 | 0.041 | Down | |
| m_1500017E21Rik | RIKEN cDNA 1500017E21 gene | 0.47 | 0.002 | Down | |
| m_Serpina4-ps1 | serine (or cysteine) peptidase inhibitor, clade A, member 4, pseudogene | 0.47 | 0.041 | Down | |
| UGT2B28 | UDP glucuronosyltransferase 2 family, polypeptide B28 | 0.46 | 0.002 | Down | |
| m_Mup3 | Major urinary protein 3 | 0.45 | 0.001 | Down |
- Note: Liver samples from two mice in the novel NASH model group and HF group were used for the microarray analysis. Five genes related to NASH were upregulated in the novel NASH model group more than 2-fold compared to the corresponding genes in the HF group.
DISCUSSION
Although several NASH models have been reported, few models fully reflect the histopathology and pathophysiology of human NASH.7-11 The MCD model and the HF diet model have been widely used for basic studies of NASH. However, these models do not closely resemble human NASH in terms of histopathological findings and insulin resistance.2 In this study, we established a novel experimental NASH model using a combination of an HF diet, CCl4 and T0901317, and the novel model exhibits similar histopathology and pathophysiology to human NASH. Specifically, macrovesicular hepatic steatosis, ballooning hepatocytes, Mallory-Denk bodies, lobular inflammation and bridging fibrosis were observed in our novel NASH model. These manifestations are similar to those found in human NASH. Additionally, this model exhibited metabolic abnormalities such as insulin resistance and dyslipidemia. These features are the essential requisites for an ideal NASH model.15 Although CCl4 is usually used in the classical hepatic fibrotic model and is administered at 1 mL/kg, it is too much as a NASH model. Thus, we adjusted the dosage of CCl4 to 0.1 mL/kg. Our novel NASH model led to steatohepatitis with severe hepatic fibrosis in the short term. Furthermore, this model also developed insulin resistance. Thus, this model is expected to be useful for basic research on NASH.
To date, the pathogenesis of NASH has not been completely elucidated. The ‘two-hit’ theory is the most widely used to explain the pathogenesis and progression of NASH; the first hit causes fat accumulation in hepatocytes, and the second hit causes inflammation and fibrosis.21 However, the pathogenesis of NASH is too complex to be completely explained by this theory. Although the pathogenesis of NASH remains poorly understood, proinflammatory cytokines appear to play an important role in the development of NASH,22 with TNF-α and IL-6 showing strong involvement in NASH pathogenesis.22 In a clinical setting, the serum TNF-α and IL-6 levels are significantly increased in NASH relative to simple steatosis.23 This finding suggests that high serum TNF-α and IL-6 levels are involved in the development of NASH. Tomita et al. reported that the serum TNF-α level is a predictor of NASH.24 In our study, we found that the serum TNF-α and IL-6 levels are significantly increased in the novel NASH model group. These factors are important components of an ideal NASH model.
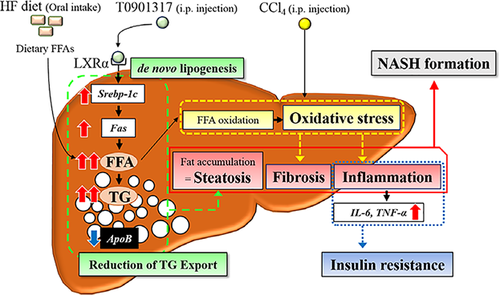
Fat accumulation in hepatocytes plays a central role in the progression of NASH.25 This accumulation occurs when the rate of fatty acid import exceeds the rate of export. In our model, the following mechanisms appear to contribute to lipid accumulation in the liver: (i) an HF diet increases the uptake of fatty acids by hepatocytes; (ii) the administration of T0901317 increases de novo fatty acid and triglyceride synthesis in the liver; and (iii) the rates of very-low-density lipoprotein (VLDL) synthesis and triglyceride export are decreased. Our study demonstrated that the mRNA expression of Srebp-1c and Fas (a marker of de novo fatty acids synthesis) was upregulated in the two groups administered T0901317. In contrast, the mRNA expression of ApoB (a marker of triglyceride export) was downregulated in only the novel NASH model group. Although the detailed mechanism remains unclear, increased de novo fatty acid synthesis and decreased triglyceride export promote fat accumulation in the liver. These effects might have played a key role in the progression of NASH in our model. Further studies are necessary to clarify the precise pathogenesis of NASH.
In addition to the histopathological findings, insulin resistance is an important feature of human NASH. In fact, insulin resistance is a frequent finding in NASH patients despite the absence of overt diabetes and is known to play a significant role in obesity-related metabolic disturbances.26 We used the ITT to evaluate insulin resistance27 and found that the novel NASH model developed prominent overall insulin resistance. Several in vitro studies have demonstrated that IL-6 promotes insulin resistance,28-31 and studies in animal models have also shown a correlation between IL-6 and insulin resistance.32, 33 The increased serum level of IL-6 observed in our model might have influenced the development of insulin resistance.
We performed a microarray analysis for the evaluation of gene expression in the novel NASH model and found that several genes were upregulated in the novel NASH model group relative to the HF group. Furthermore, we confirmed that five genes (Gstm3, Scd1, Scd2, Ly6d, and Lepr) related to NASH were significantly upregulated in the novel NASH model group relative to the other groups. Gstm3 is related to oxidative stress, and oxidative stress induced by the overproduction of reactive oxygen species (ROS) is necessary for the development of NASH.21, 34 Glutathione S-transferases (GSTs), including Gstm3, detoxify xenobiotics.35 Thus, the upregulation of this gene suggests that ROS are overproduced in mice. Scd1 and Scd2 are related to lipogenesis and have been shown to be upregulated in NASH animal models.36 Leptin is involved in the pathogenesis of NASH due to its important modulatory effects on the regulation of body weight and appetite and in preventing fat accumulation in the liver.37 Medici et al. reported that the soluble leptin receptor (SLR) is positively correlated with the stage of hepatic fibrosis in humans.38 Guillén et al. reported that Ly6d gene expression is positively correlated with hepatic steatosis in animals.39 Thus, several genes related to the development of NASH were found to be upregulated in the novel NASH model group. This finding supports the conclusion that our model exhibits the transcriptomic features of NASH.
In conclusion, we established a novel experimental NASH model through feeding an HF diet and administering both CCl4 and T0901317 to mice. Figure 5 indicates the mechanism of the progression of NASH in the novel animal model. NASH is diagnosed based on histological findings, and clinical insulin resistance and hypercytokinaemia play central roles in its progression. Our novel NASH model exhibits these important features and the associated transcriptomic characteristics. We believe that our animal model, which has the characteristics of human NASH, will be useful for basic research on NASH.
ACKNOWLEDGMENT
This study is supported by the Ministry of Education, Culture, Sports, Science, and Technology of Japan, KAKENHI, No. 26861059 and No. 16K10489.
DISCLOSURE STATEMENT
None declared.


