Continuous allocation: The problem with EPTS and pediatric kidney candidates
Abstract
Background
The 2014 Kidney Allocation System (KAS) introduced longevity matching for adult candidates using the Estimated Post-Transplant Survival (EPTS) score, which includes candidate age, time on dialysis, diabetes status, and number of previous solid organ transplants. The proposed continuous distribution framework may expand the use of this attribute to pediatric candidates, but there is no data on its performance among pediatric kidney transplant recipients.
Methods
We performed a retrospective cohort study of 6800 pediatric kidney transplant recipients from 2001 to 2011 using Organ Procurement and Transplantation Network (OPTN) data. EPTS score was calculated for each patient and compared to reported patient survival to estimate the validity of the score in children.
Results
The median age of patients was 14.01 years (IQR 9.29–16.37 years), and dialysis vintage was 0.67 years (IQR 0–1.82 years). 18.2% of the cohort had a prior transplant and 1% had diabetes. Median EPTS score was 2 (IQR 1–2). Seven percent of patients died during the study period and 54.7% of the cohort was censored prior to 10 years. The c-statistic was 0.505 (95% CI: 0.49–0.53).
Conclusion
Overall, EPTS is not a valid predictor of patient survival among pediatric kidney transplant recipients.
Abbreviations
-
- EPTS
-
- Estimated Post-Transplant Survival
-
- ESRD
-
- end-stage renal disease
-
- FSGS
-
- focal segmental glomerulosclerosis
-
- HRSA
-
- health resources and services administration
-
- IQR
-
- interquartile range
-
- KAS
-
- kidney allocation system
-
- OPTN
-
- Organ Procurement and Transplantation Network
-
- SRTR
-
- Scientific Registry of Transplant Recipients
-
- UNOS
-
- United Network for Organ Sharing
1 INTRODUCTION
The equitable allocation of organ distribution and maximizing the utility of deceased donor organs are main features of the Final Rule of the Organ Procurement and Transplantation Network (OPTN).1 In 2014, the United States Kidney Allocation System (KAS) introduced longevity matching using estimated post transplant survival (EPTS) for adult patients.2, 3 Longevity matching is the concept that kidneys that are expected to function longer should be prioritized for patients who are most likely to survive longer after receiving a transplant. It is facilitated through the EPTS, a numerical score developed by the Scientific Registry of Transplant Recipients (SRTR) that ranges from 0 to 100, with lower EPTS corresponding to higher expected post-transplant survival. Age, time on dialysis, previous solid organ transplant, and diabetes status are aspects used in calculating the raw EPTS, which is then converted to an EPTS score using an annually updated mapping table.4 The c-statistic for the EPTS score is estimated at 0.69 by SRTR4 and 0.67–0.69 in an external validation using the Australia and New Zealand Dialysis and Transplant Registry.5 In current allocation policy, adult candidates with an EPTS score of 20% or less are given increased priority for kidneys with a KDPI of 20% or less; EPTS score does not affect allocation of kidneys with a KDPI >20%, which accounted for 84.3% of transplants 2019–2021.6 There is no data on the predictive ability of the current EPTS formula in pediatric patients. EPTS score is not currently used for allocation to pediatric candidates,7 available OPTN calculators do not return an EPTS score for individuals less than 18 years old,8 and pediatric patients are not included in the reference population for EPTS mapping table updates.4
The OPTN is currently considering a shift to a new continuous distribution framework. In continuous distribution, candidates receive points in various categories, called “attributes.” Examples of attributes include calculated panel reactive antibody, distance from the donor hospital, wait time, and pediatric status.9 Each attribute point score is then weighted relative to other attributes, and the sum of points from all attributes is the candidate's composite allocation score. Under a continuous distribution framework, a donor kidney would be offered first to the candidate with the highest composite allocation score. This is a change from the current framework, in which a kidney is offered to all candidates with a particular category (ie candidates registered prior to age 18 years) before being offered to any candidates in the next category (ie medically urgent).
EPTS score is one attribute under consideration for inclusion and potential expanded use,9 even including children (personal communication, R Brookman, UNOS, April 14, 2022). Continuous distribution has the possibility to change the priority pediatrics receive for KDPI < 35% kidneys and raises key questions for the potential application of EPTS score to pediatric candidates. If EPTS is calculated but is not predictive in pediatric candidates, EPTS points could inappropriately prioritize or de-prioritize pediatric candidates relative to both adult and other pediatric candidates. If an EPTS is not calculated for pediatric candidates, as in the current allocation system, then pediatric candidates will either: (1) have access to fewer points and be disadvantaged relative to adult candidates or (2) require the creation of a different, pediatric-specific equation for calculation of a continuous allocation score. The OPTN Pediatric Transplantation Committee was asked to evaluate this issue. Our aim was to determine whether the current EPTS formula is predictive in pediatric patients.
2 METHODS
This is a retrospective cohort study using OPTN data to identify kidney transplants performed between January 1, 2001 and December 31, 2011 in patients who were less than 18 years of age at the time of transplant. EPTS was calculated for each patient using the current, adult equation.4 EPTS was then converted to EPTS score using the 2021 mapping.10 The primary outcome of interest was 10-year patient survival, chosen to correlate with the timeframe used to generate the EPTS for adult recipients. Patients missing data needed to calculate EPTS comprised 0.42% (n = 29) and were excluded from the study.
Descriptive statistics reported counts and percentages for categorical variables and medians and interquartile range for continuous variables comprising the EPTS. We then generated a Cox proportional hazards regression model for the association between EPTS and patient survival. Patients were censored at the time of graft loss or loss to follow-up (patient declines further care, patient transfers care). The model was used to calculate a c-statistic and 95% confidence interval (based on 1000 bootstrap iterations) using the concordance function. We then compared the calculated c-statistic to that calculated in the original SRTR modeling. Analysis was conducted using R version 4.2.0.
3 RESULTS
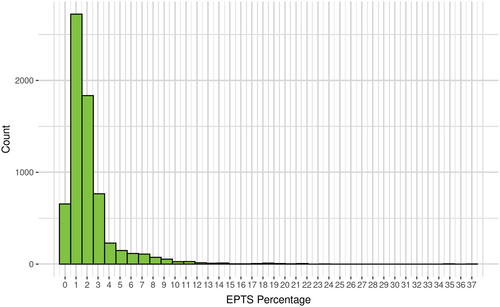
There were 6800 pediatric recipients included in the cohort. The median age of the patient at time of transplant was 14.01 years (IQR: 9.29–16.37 years). The median time on dialysis was 0.67 years (IQR 0–1.82 years). Among the study cohort 1235 (18.2%) had had a previous transplant and 70 (1%) patients had diabetes. Table 1. The median EPTS score for pediatric kidney transplant recipients was 2 (IQR 1–2, range 0–37), with 87% of recipients having an EPTS score less than 3, as shown in Figure 1.
| Pediatric transplant recipients | N = 6800 | |
|---|---|---|
| n/median | %/IQR | |
| Age (years) | 14.01 | 9.29–16.37 |
| Time on dialysis (years) | 0.67 | 0–1.82 |
| Diabetes | 710 | 1% |
| Previous transplant | 1235 | 18.8% |

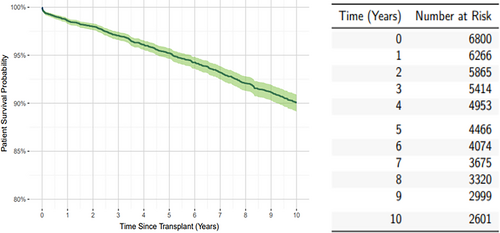
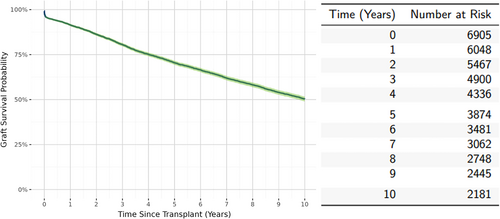
There were 476 (7%) patient deaths during the study period. Overall estimated patient survival was 90% (95% CI: 89%–91%) at 10 years posttransplant Figure 2. Patient survival was censored prior to 10 years for 3735 (54.7%) recipients; of these 1871 (19.1% of the total cohort) were censored due to graft failure prior to 10 years of follow-up. Overall estimated graft survival was 50.3% (95% CI: 48.9%–51.6%) as shown in Figure 3.


The c-statistic for the association between EPTS and patient survival was 0.505 (95% CI: 0.49–0.53), showing no statistically significant predictive value of the EPTS.
4 DISCUSSION
The United States kidney transplant community is currently considering a transition from the current, categorical KAS to a continuous distribution model.9 In this study, we cannot show that the existing EPTS is a valid estimate of posttransplant patient survival for pediatric kidney transplant recipients. The variables included in the EPTS age, time on dialysis, previous solid organ transplant and diabetes status -show low variability in pediatric candidates, minimal variation in the EPTS among pediatric candidates, and EPTS is not significantly predictive of pediatric patient survival. As the United States transplant community is discussing the potential shift to a continuous distribution allocation system, this data call into question the most appropriate application of EPTS for pediatric patients.
The data originally contributing to the EPTS were necessarily overwhelmingly from adult recipients and intended for use among adult candidates. Pediatric patients develop end-stage renal disease (ESRD) due to a variety of causes, many of which are very different from common adult indications for kidney transplantation. In 2020, 38.3% of pediatric candidates had congenital anomalies of the kidney and urinary tract, while approximately 52.5% % of adult candidates developed ESRD due to diabetes or hypertension.11 Our data show that diabetes is present in only 1% of pediatric candidates, compared to 47.1% of adult candidates, time on dialysis is shorter (compared to approximately 55% of adults dialyzing >2 years pre-transplant)11 and the age range among candidates is, of course, smaller. Given these differences, it is unsurprising that the current adult EPTS score fails to predict survival among pediatric recipients. Further research would be needed to create a pediatric-specific EPTS and could include examination of current EPTS variables as well as pediatric-specific factors such as pulmonary hypoplasia, other congenital anomalies (including neurologic and cardiac), urologic issues, growth/nutritional status, and EBV serostatus. Unfortunately, many of these variables are not captured in existing large registries such as OPTN. This issue is especially relevant as estimated post-transplant survival is being considered for liver and heart continuous distribution; estimates devised based primarily based on adult data may not be appropriate for pediatric candidates.
Under the current United States KAS, pediatric patients age 0–17 are generally treated similarly. Allocation among pediatric candidates is based primarily on waiting time, with the exception of one additional point (roughly equivalent to one additional year of waiting time) given to children less than 11 years of age.7 The addition of EPTS as an attribute in a continuous distribution model would theoretically end this equity of treatment, prioritizing some children over others based on estimated survival. However, our data show that there is very little variation in EPTS among most pediatric candidates, but a long tail. Given the lack of association between EPTS and patient survival among the entire pediatric cohort, this raises a concern that the small number of pediatric patients with high EPTS could be inappropriately disadvantaged in allocation.
The primary limitation of the study is the high number of censored recipients and the low number of deaths in the cohort, both of which significantly limit the power of the Cox model to identify a statistically significant result. The high censoring is likely related to loss to follow-up by the transplant center of pediatric candidates who transition to adult care. After a transfer of care, current OPTN guidance documentation suggests that the transplant recipient follow-up (TRF) forms should be completed by the receiving transplant program.12 If the patient is transferring care to a provider not associated with a transplant center, the transplanting program should continue to complete the TRF form. However, OPTN does not currently track pediatric transfers of care and does not automatically generate TRF forms for transferred patients. This loss of data significantly limits analysis on many pediatric outcomes. To improve overall data collection on outcomes of pediatric transplant recipients, UNOS could consider requiring that graft failure be reported for every patient by every provider, regardless of transplant center. Improved integration between SRTR data collection and dialysis registries, such as the United States Renal Data System, could also provide improved tracking of both pediatric and adult outcomes across the spectrum of renal disease.
Nevertheless, this study cohort was chosen specifically to mimic the cohort on which the EPTS was originally created to allow comparison to existing adult data. A cohort defined by a longer time period would not necessarily solve the problem of power. Wang et al showed that 10-year, 15-year, and 20-year patient survival for pediatric kidney transplant recipients, excluding those with FSGS, was estimated at 93.72%, 88.09%, and 78.84%, respectively, while allograft survival was 59.7% at 10 years, 45.68% at 15 years, and 26.35% at 20 years posttransplant.13 Therefore, any extension of the cohort's inclusion dates would lead to increased censoring, limiting any increase in study power. Similarly, a larger cohort would be unlikely to have more variability in EPTS and, therefore, unlikely to show a high c-statistic. The primary strength of this study is its focus on pediatric recipients, for whom there is limited existing data on EPTS.
Overall, our data show that the use of EPTS for pediatric kidney allocation is not supported by current data. Several options remain for incorporating EPTS into a continuous distribution framework for adult candidates while avoiding inaccurate calculations for children. One option includes creating a pediatric-specific EPTS for use in pediatric candidate; this would involve identification and modeling of appropriate variables to predict pediatric kidney recipient survival, some of which may not be included in current OPTN data collection. A second option may include consideration of estimated graft survival, rather than patient survival, for longevity matching in pediatric candidates, as graft survival is more variable and may better discriminate among patients. However, given known socioeconomic and ethnic disparities in graft survival, it is likely that such a system would exacerbate existing inequalities in transplantation.14 A third option includes giving all pediatric candidates the same, uniformly low EPTS score for the purposes of allocation. This would be reasonable given the overall high patient survival and low EPTS variability seen in this cohort and would have the virtue of simplicity and rapid potential implementation. A fourth option would be creating a separate continuous distribution scoring system for pediatric candidates. This would increase complexity and be challenging to integrate with the adult scoring system, but would allow the inclusion of pediatric-specific allocation factors. Regardless of the option chosen, it is key that allocation policy is data driven and applicable to each of the varied subpopulations seeking transplantation, including children.
AUTHOR CONTRIBUTIONS
Rachel M. Engen participated in the research design and writing of the paper. Samantha Weiss participated in data analysis and writing of the paper. Caitlin G. Peterson participated in research design and writing of the paper.
FUNDING INFORMATION
This work was funded by the U.S. Department of Health and Human Services, Health Resources and Services Administration (HRSA), Health Systems Bureau, Division of Transplantation under contract number HHSH250201900001C and was conducted under the auspices of the United Network for Organ Sharing (UNOS), the contractor for the Organ Procurement and Transplantation Network (OPTN). The interpretation and reporting of these data are the responsibility of the authors and in no way should be seen as official policy of or interpretation by the OPTN or the US government.
CONFLICT OF INTEREST STATEMENT
The authors have no conflicts of interest to declare.
Open Research
DATA AVAILABILITY STATEMENT
The data that support the findings of this study are openly available through the Organ Procurement and Transplantation Network: https://optn.transplant.hrsa.gov/data/view-data-reports/request-data/.


