A pepper RING-finger E3 ligase, CaFIRF1, negatively regulates the high-salt stress response by modulating the stability of CaFAF1
Yeongil Bae and Woonhee Baek contributed equally to this work.
Abstract
Controlling protein stability or degradation via the ubiquitin-26S proteasome system is a crucial mechanism in plant cellular responses to stress conditions. Previous studies have revealed that the pepper FANTASTIC FOUR-like gene, CaFAF1, plays a positive role in salt tolerance and that, in this process, CaFAF1 protein degradation is delayed. Here, we sought to isolate the E3 ligases potentially responsible for modulating CaFAF1 protein stability in response to salt stress. The pepper RING-type E3 ligase CaFIRF1 (Capsicum annuum FAF1 Interacting RING Finger protein 1) was found to interact with and ubiquitinate CaFAF1, leading to the degradation of CaFAF1 proteins. In response to high-salt treatments, CaFIRF1-silenced pepper plants exhibited tolerant phenotypes. In contrast, co-silencing of CaFAF1 and CaFIRF1 led to increased sensitivity to high-salt treatments, revealing that CaFIRF1 functions upstream of CaFAF1. A cell-free degradation analysis showed that high-salt treatment suppressed CaFAF1 protein degradation via the 26S proteasome pathway, in which CaFIRF1 is functionally involved. In addition, an in vivo ubiquitination assay revealed that CaFIRF1-mediated ubiquitination of CaFAF1 proteins was reduced by high-salt treatment. Taken together, these findings suggest that the degradation of CaFAF1 mediated by CaFIRF1 has a critical role in pepper plant responses to high salinity.
Summary statement
We previously reported that pepper FANTASTIC FOUR-like protein CaFAF1 functions as a positive modulator of high salt response. Building on this in the present study, we identified the RING type E3 ligase CaFIRF1 as an interactor of CaFAF1, which plays a negative role in response to high salt stress via regulation of CaFAF1 stability.
1 INTRODUCTION
The exacerbation of global climate change has been linked to an increase in extreme weather events, which in turn accelerate the processes of desertification and salinization in agricultural lands, thereby adversely affecting crop plants (He et al., 2018; Zhang et al., 2022; Zhao et al., 2021). Water deficits, caused by desiccation and salinization, seriously threaten plants, leading to impaired growth and reduced crop productivity. In addition, saline stress, especially from sodium (Na+) ions, causes ion toxicity in cells, resulting in the inhibition of plant growth and seed germination or promotion of senescence and cell death (Hasegawa et al., 2000; Osakabe et al., 2014; Zhao et al., 2021). As sessile organisms, plants have established various regulatory pathways to survive in adverse conditions (He et al., 2018; Tuteja, 2007; Zhang et al., 2022). In response to osmotic stress, the coordinated action of PYR/PYL/RCAR-PP2C-SnRK2s mediates stomatal closure and induces the expression of multiple stress-responsive genes, thereby enabling plants to modulate their physiology and cellular processes to conserve water resources (Fujita et al., 2011; Schroeder et al., 2001; Umezawa et al., 2010). Moreover, several sodium transport systems including the salt-overly-sensitive pathway, sodium/proton exchanger (NHX) and high-affinity potassium transporter work to relieve ion toxicity (Yamaguchi et al., 2013; Zhao et al., 2021; Zhu, 2002). Nevertheless, further study is required to comprehensively understand these intricate processes.
In recent decades, various posttranslational modifications have been actively studied from simple microbes to higher organisms (Aletta et al., 1998; Conradi & Shiu, 2018; Prabakaran et al., 2012). Notably, the ubiquitin-proteasome system (UPS)-mediated proteasomal degradation is important for plant cellular processes, including growth and development as well as abiotic stress responses (Sharma et al., 2016). In this system, the ubiquitination module consists of the three enzymes E1, E2 and E3 (Bachmair et al., 2001). E1 is known to be responsible for activating ubiquitin, and this activated ubiquitin is subsequently transferred to E2, the ubiquitin-conjugating enzyme. In turn, E3 ubiquitin ligase binds to both E2 and a substrate, thereby accomplishing substrate ubiquitination. In this regard, E3 ubiquitin ligase is considered to be the key enzyme for substrate recognition and determination of specificity (Bachmair et al., 2001; Chen & Hellmann, 2013). The many E3 ligases that have been reported can be divided into two superfamilies: single- and multi-subunit E3 ligases (Wang et al., 2022). Single-subunit E3 ligases are composed of homology to E6-AP C-terminus (HECT), plant U-box (PUB) and really interesting new gene (RING), while multi-subunit E3 ligases comprise the anaphase promoting complex, Skp1-cullin-F-box (SCF) and CULLIN4-damaged-specific DNA binding protein1 (CUL4-DDB1) (Al-Saharin et al., 2022). Among these ligases, numerous RING-type E3 ligases participate in various abiotic stress responses (Al-Saharin et al., 2022; Chen & Hellmann, 2013; Stone, 2014; Wang et al., 2022). In the salt stress response, AtAIRP3 positively regulates the ABA-mediated high salinity stress responses via the ubiquitination of RD21 (Kim & Kim, 2013). Moreover, RDUF1 and SDIR1 function as positive regulators in high-salinity stress responses (Li et al., 2013; Zhang et al., 2007). On the other hand, AtXBAT35.2 negatively modulate the salt tolerance by promoting the degradation of ACD11 (Li et al., 2020). OsMAR1 and OsSIRP4 also act as a negative regulator in the salt stress response via the ubiquitination of OCPI2 and OsPEX11-1, respectively (Kim & Jang, 2021; Park et al., 2018). Despite several investigations into the mechanisms by which RING-type E3 ligases mediate high-salt stress response, the role of these RING-type E3 ligases in the high-salinity stress response remains less clear.
Previously, we reported that expression of the C. annuum FANTASTIC FOUR-like (CaFAF1) gene was significantly induced by high salinity and that this gene played a positive role in responses to high-salinity stress through modulation of its protein stability (Lim et al., 2022). In the present study, we identified the RING-type E3 ligase CaFIRF1 (C. annuum FAF1 Interacting RING Finger protein 1, CA02g30250) as an interaction partner of CaFAF1 and showed that CaFIRF1 plays negative roles in the high-salinity stress response and ubiquitinates CaFAF1. In addition, we found that under high-salinity stress conditions, CaFIRF1 facilitates the proteasomal degradation of CaFAF1. Our findings indicate that CaFIRF1 functions as a negative regulator in the high-salinity stress response and is associated with the modulation of CaFAF1 protein stability in a salinity-dependent manner.
2 MATERIALS AND METHODS
2.1 Plant materials
For in vivo experiments, hot pepper (Capsicum annuum cv. Nockwang) and tobacco (Nicotiana benthamiana) were used. Pepper seeds were soaked and incubated at 28°C under dark conditions for 4 days. Germinated seeds of pepper and tobacco were planted in soil and grown in a growth room (24°C, light for 16 h/dark for 8 h). The soil composition was as described in previous studies (Bae et al., 2021; Lim et al., 2022).
2.2 Abiotic stress treatments
The methods of stress treatments were as previously described (Bae et al., 2021; Lim et al., 2022). To measure the expression levels of CaFIRF1, we treated pepper plants (six-leaf stage) with dehydration (detaching the shoot), NaCl (200 mM), mannitol (600 mM) or ABA (100 µM). For investigations into the expression patterns of stress-responsive genes, 2-week-old pepper plants (after agroinfiltration) were treated with dehydration (detaching the shoot) or an NaCl (250 mM) solution, after which first and second leaves were harvested at designated time points (0, 4 and 8 h).
2.3 Virus-induced gene silencing (VIGS)
The CaFAF1 knockdown model of pepper plants was used as previously described (Lim et al., 2022). For generating the knockdown model of CaFIRF1, a validated region for gene silencing was examined using the Sol Genomics Network (SGN) web tool (https://vigs.solgenomics.net/) and a 212 bp fragment of CaFIRF1 cDNA was designed. Agrobacterium tumefaciens (strain GV3101, carrying pTRV1, pTRV2:CaFAF1, pTRV2:CaFIRF1 or pTRV2:00) were coinfiltrated into the cotyledons of 2-week-old pepper plants in four combinations (pTRV2:00 for the negative control, pTRV2:CaFAF1 or pTRV2:CaFIRF1 for single gene silenced plants and pTRV2:CaFAF1/CaFIRF1 for double gene silenced plants), and the expression levels of CaFAF1 or CaFIRF1 were evaluated using RT-PCR after 2 weeks (Figure S6).
2.4 Reverse transcription-quantitative polymerase chain reaction analyses (RT-qPCR)
RNA isolation and cDNA synthesis were performed according to protocol described previously (Lim et al., 2022). Briefly, total RNA was isolated from the first and second leaves. cDNA was synthesized with 1 µg of quantified total RNA using an iScript™ cDNA synthesis kit (Bio-Rad) and used as a template for RT-qPCR analysis. As an internal control, the pepper protein phosphatase 2A (CaPP2A) gene was used (Table S1) (Petriccione et al., 2015; Wang et al., 2014).
2.5 Protein–protein interaction assay
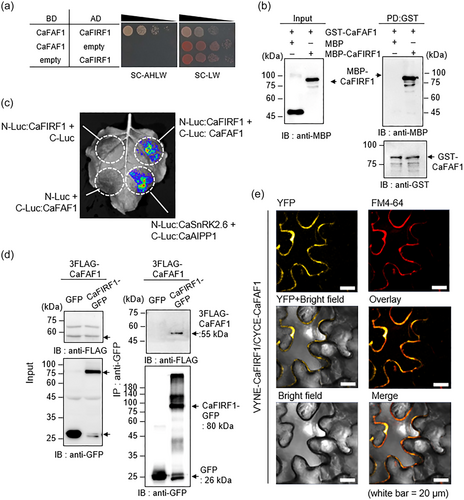
For the one-by-one yeast two-hybrid (Y2H) assay, the full-length CDS (coding sequences) of CaFIRF1 and CaFAF1 were cloned into pGADT7 and pGBKT7 vectors, respectively. Yeast cells of Saccharomyces cerevisiae (strain AH109) were cotransformed with each combination assessed in the present study (Figure 1a) using the lithium acetate yeast transformation method.
To generate recombinant proteins, we cloned the full-length CDS of CaFIRF1 and CaFAF1 into pMAL-c2X and pGEX 4T-3 (GE Healthcare Bio-Sciences) vectors, respectively. Expression of the recombinant proteins was as previously described (Baek et al., 2021; Lim et al., 2018). For the pull-down assay, the GST-CaFAF1 protein was incubated with precleared MBP-CaFIRF1 or free-MBP proteins and glutathione-Sepharose 4 flow beads at 4°C for 2 h. The beads were washed and eluted with elution buffer (20 mM Tris–HCl, 150 mM NaCl and reduced glutathione). The eluted proteins were resolved by SDS-PAGE for western blot analysis (Baek et al., 2021).
For the luciferase complementation imaging (LCI) assay (Gehl et al., 2011), CaFIRF1 and CaFAF1 were fused to the N- and C-terminal halves, respectively, of firefly LUC. A. tumefaciens (strain GV3101) carrying different combinations with p19 strain cells were infiltrated in epidermal cells of N. benthamiana leaves and incubated for 3 days. After 3 days, these leaves were treated with 1 mM luciferin and placed in the dark for 30 min. The luciferase luminescence signal was then detected using NightShade LB 985 (Berthold Technologies).
For the coimmunoprecipitation (Co-IP) assay, 35S:3xFLAG-CaFAF1 were coexpressed with 35S:CaFIRF1-GFP or 35S:GFP in N. benthamiana leaves with p19 strain cells. After 3 days, the infiltrated leaves were harvested, and protein extraction and IP assays were performed as previously described (Lim, Baek, et al., 2021).
For the bimolecular fluorescence complementation (BiFC) assay (Citovsky et al., 2006), the full-length CDS of CaFIRF1 and CaFAF1 were cloned into the 35S-VYNE and 35S-CYCE vectors, respectively. A. tumefaciens strain GV3101 carrying different combinations were infiltrated into epidermal cells of N. benthamiana leaves with p19 strain cells and incubated for 3 days. Two hours before confocal observation, FM4-64 (50 μM) was added, and yellow fluorescent protein signals were detected with a confocal microscope.
2.6 In vitro and in vivo ubiquitination assays
In vitro and in vivo ubiquitination assays were performed following the protocol described by Lim et al. (2018) with some modifications. For the in vitro ubiquitination assay, purified MBP-CaFIRF1, MBP-CaFIRF1CC (C441S/C444S) or MBP-CaFIRF1CH (C455S/H457Y) (500 ng) was mixed with reaction buffer [50 mM Tris-HCl, pH 7.5, 5 mM MgCl2, 2 mM ATP, 2 mM dithiothreitol (DTT)], recombinant human UBE1 (Boston Biochemicals), His-tagged human UbcH5b (Enzo Life Science) and bovine ubiquitin (Sigma-Aldrich). The mixture was then incubated at 30°C for 6 h. For the ubiquitination of CaFAF1, purified GST-CaFAF1 (50 ng) was added to the reaction mixture as described above and was incubated at 30°C for 6 h. The reacted proteins were resolved by SDS-PAGE for western blot analysis with anti-MBP, anti-ubiquitin and anti-GST antibodies.
For the in vivo ubiquitination assay, Pro35S:3xFLAG-CaFAF1 was coexpressed with Pro35S:CaFIRF1-GFP or Pro35S:CaFIRF1CC-GFP in N. benthamiana leaves. After 3 days, tobacco leaves were treated with MG132 (50 µM), a 26S proteasome inhibitor, 9 h before sampling. Each leaf sample was extracted with native extraction buffer [50 mM Tris-MES (pH 8.0), 0.5 M sucrose, 1 mM MgCl2, 10 mM EDTA, 5 mM DTT and complete protease inhibitor (Roche)]. Immunoprecipitation (Anti-FLAG® M2 magnetic beads; Sigma-Aldrich) and immunoblot (plant ubiquitin antibody: Agrisera UBQ11 antibody; FLAG antibody: Abcam Anti-FLAG(DDDK); GFP antibody: Santacruz) analyses were performed as described above.
2.7 Phenotypic analyses
For phenotypic analyses, we used pepper plants (2 weeks after agroinfiltration) of several lines (TRV2:00 as a control, TRV2:CaFIRF1, TRV2:CaFAF1 and TRV2:CaFIRF1/CaFAF1). For the verification of high-salinity tolerance, the roots of each pepper line were soaked in various concentrations of NaCl (0, 200 and 250 mM). After 4 days, the survival rates of each pepper line were calculated at indicated time points. Moreover, the relative chlorophyll content was measured spectrophotometrically as previously described (Lim et al., 2022). To conduct physiological assessments, we measured electrolyte leakage, proline and malondialdehyde (MDA) contents. Each pepper line was soaked in NaCl solution (200 mM) for 16 h, after which the first and second leaves were used for the respective assays, as previously described (Bae et al., 2021; Lim et al., 2022; Lim, Lim, et al., 2021).
2.8 Cell-free degradation
CaFIRF1-silenced pepper plants were treated with dehydration or 250 mM NaCl for 6 h, which time point is referred to in the previous study (Lim et al., 2022). Thereafter, the first and second pepper leaves were harvested and used to produce crude extracts with extraction buffer [1 mM ATP, 10 mM MgCl2, 10 mM NaCl, 25 mM Tris–HCl (pH 7.5), 5 mM DTT and 0.1% Triton X-100]. Recombinant GST-CaFAF1 proteins (500 ng) were mixed with crude extracts (50 μg of total protein) and incubated for 20 and 40 min with or without 50 µM MG132. Immunoblot analyses were conducted using anti-GST antibodies.
3 RESULTS
3.1 CaFIRF1 interacts with CaFAF1
In our previous study, CaFAF1 was reported to play a positive role in plant responses to high salinity (Lim et al., 2022). CaFAF1 protein degradation is delayed by salt stress; hence, we tried to seek out candidate proteins responsible for this modulation of CaFAF1 protein stability. First, we performed a Y2H screening assay using CaFAF1 as bait and the pepper RING E3 ligase cDNA library as prey. Of the putative CaFAF1-interacting partners, we selected the gene CA02g30250 and named it C. annuum FAF1 Interacting RING Finger protein 1 (CaFIRF1). The interaction between CaFAF1 and CaFIRF1 was validated by a one-by-one Y2H assay (Figure 1a). We also conducted a pull-down assay and found that glutathione S-transferase (GST)-CaFAF1 appeared to interact with maltose binding protein (MBP)-CaFIRF1 (Figure 1b). To further confirm this interaction in vivo, LCI (Figure 1c), Co-IP (Figure 1d) and BiFC assays (Figure 1e) were conducted. These assays consistently revealed that CaFAF1 can interact with CaFIRF1 in plant cells, especially in the cytoplasm and plasma membrane (Figures 1c–e and S1). Collectively, these findings indicate that CaFIRF1 physically interacts with CaFAF1 in vitro and in vivo.
3.2 Molecular characterization of CaFIRF1
Using the SGN (Fernandez-Pozo et al., 2015), a BLASTP search showed that CaFIRF1 is close to CaAIRE1, which plays a positive role in ABA signalling and drought stress responses (Baek et al., 2021). Since CaAIRE1 shares sequence homology with members of the Arabidopsis RGLG family, especially RGLG4, we focused on the functional association between CaFIRF1 and RGLG proteins. Multiple sequence alignments and phylogenetic tree analyses with five Arabidopsis RGLG proteins revealed that CaFIRF1 is highly close to Arabidopsis RGLG1 and RGLG2 (Figure 2a). RGLGs have been implicated in diverse abiotic stress responses and ABA signalling, and CaAIRE1 expression has been shown to be highly induced by ABA and drought stress (Baek et al., 2021; Belda-Palazon et al., 2019; Cheng et al., 2012; Wu et al., 2016; Yu et al., 2021; Zhang et al., 2012). Based on these findings, we investigated the expression patterns of CaFIRF1 in response to different abiotic stresses (Figure 2b). Following dehydration and mannitol treatments, the expression of CaFIRF1 exhibited a zigzag pattern, with the first peaks observed at 3 and 6 h after treatment, respectively. In contrast, NaCl and ABA treatments led to a gradual increase in CaFIRF1 expression, with the highest values observed at 12 and 6 h after treatment, respectively. We also investigated the organ-specific expression of CaFIRF1 in pepper plants. Compared to leaves, flowers and stems showed a high level of CaFIRF1 expression (Figure 2c). To determine the subcellular localization of CaFIRF1, we transiently expressed GFP-tagged CaFIRF1 in the leaf epidermal cells of N. benthamiana. Two days after agroinfiltration, most of the GFP signals were localized in the cytoplasm (Figure 2d, upper panels and Figure S4), but some weak signals were also detected in the nucleus (indicated by white arrows in Figure S4). This pattern became more evident in the plasmolyzed cells treated with mannitol, as the GFP signals appeared to be separated from the cell wall, indicating that GFP signals are limited in the cytoplasm (white arrows in Figure 2d, bottom panels). These results suggest that CaFIRF1 may be involved in responses to diverse abiotic stresses and potentially has functions unique from those of CaAIRE1.

3.3 CaFIRF1 has E3 ligase activity
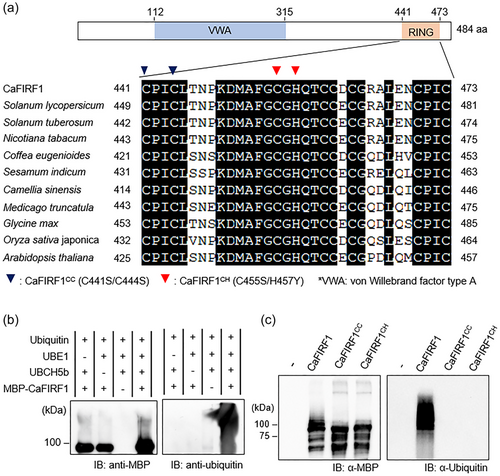
To further characterize CaFIRF1, we performed a domain analysis using the SMART webtool (Letunic & Bork, 2018). As shown in Figure 3a, CaFIRF1 has a von Willebrand factor type A (VWA) domain (amino acids 112−315) and a RING finger domain (amino acids 441−473), like RGLG proteins. In particular, RING finger domains are known to be essential for the ubiquitination of either their own or target proteins (De Bie & Ciechanover, 2011; Metzger et al., 2014; Stone et al., 2005). Through multiple sequence alignments of CaFIRF1 with its homologous proteins from other plant species, we found that CaFIRF1 has a highly conserved 3Cys-1His-4Cys (C3H1C4)-type RING finger domain (Figure 3a). Based on these results, we wondered if CaFIRF1 could function as an E3 ligase. To explore this possibility and examine the E3 ligase activity of CaFIRF1, we conducted in vitro ubiquitination assays (Figure 3b,c). In the presence of ubiquitin, E1 (UbE1) and E2 (UBCH5b), CaFIRF1 showed E3 ligase activity (Figure 3b, fourth lane in the left and right panels). In the RING finger domain, conserved cysteines and histidine residues are known to be key sites for E3 ligase activity (Chen & Hellmann, 2013; Garcia-Barcena et al., 2020; Jiménez-López et al., 2018). To analyse whether certain conserved residues are essential for E3 ligase activity, Cys441 and Cys444 were substituted with Ser (CaFIRF1CC, blue inverted triangle), and Cys455 and His457 were substituted with Ser and Tyr, respectively (CaFIRF1CH, red inverted triangle). These residue substitutions did not alter the subcellular localization of CaFIRF1 (Figure S5) but led to the loss of E3 ligase activity (Figure 3c). Taken together, these results indicate that CaFIRF1 functions as an active E3 ligase.
3.4 CaFIRF1 ubiquitinates CaFAF1
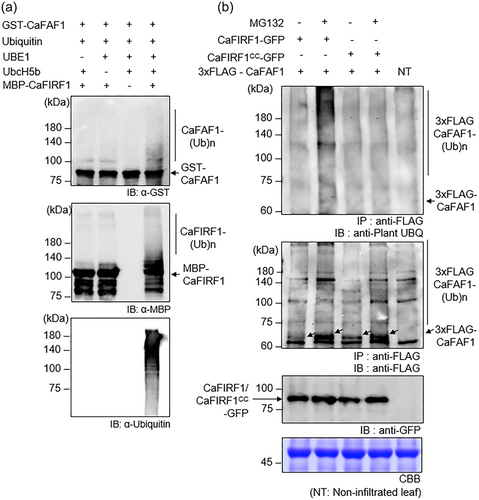
Given the interaction of CaFIRF1 with CaFAF1 (Figure 1), we wondered if CaFAF1 could be a substrate of CaFIRF1. To examine this possibility, we conducted an in vitro ubiquitination assay by adding glutathione S-transferase (GST)-tagged CaFAF1 proteins as a substrate. As shown in Figures 4a and S3, high-molecular-weight smear bands of CaFAF1 were detected only when samples were incubated with ubiquitin, UBE1, UbcH5b and MBP-CaFIRF1, indicating that CaFIRF1 poly-ubiquitinates CaFAF1. We also observed this CaFIRF1-mediated ubiquitination of CaFAF1 proteins in planta. For the in vivo ubiquitination assay, 3xFLAG-CaFAF1 was transiently coexpressed with CaFIRF1- or CaFIRF1CC-GFP in N. benthamiana leaves (Figure 4b). In the absence of MG132, ubiquitination of CaFAF1 did not occur. However, treatment with MG132 allowed for the accumulation of ubiquitinated CaFAF1 proteins, which was induced by CaFIRF1, but not by the CaFIRF1CC mutant. These results indicate that CaFIRF1 can ubiquitinate CaFAF1 as a substrate and that this process is associated with 26S proteasome-mediated degradation of the CaFAF1 protein.
3.5 CaFIRF1-silenced pepper plants show enhanced tolerance to high-salinity stress
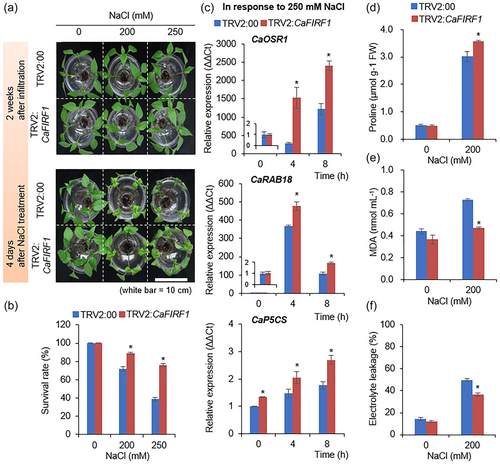
To investigate the biological role of CaFIRF1, we performed phenotypic analyses with CaFIRF1-silenced pepper plants generated through a VIGS system (Figure 5). Initially, we confirmed the efficiency of VIGS using a semiquantitative RT-PCR assay and found that CaFIRF1-silenced pepper plants (TRV2:CaFIRF1) showed significantly reduced levels of CaFIRF1 transcripts compared to the control (TRV2:00) (Figure S6). Using these pepper plants, we examined whether CaFIRF1 is functionally involved in responses to high-salinity stress. Two weeks after agroinfiltration, TRV2:CaFIRF1 and TRV2:00 plants were subjected to salt stress by soaking in an NaCl solution (Figure 5a). After 4 days, TRV2:CaFIRF1 plants were less wilted than TRV2:00 plants (Figure 5a, lower image). Consistently, the survival rates of TRV2:CaFIRF1 plants (200 mM, 88.75%; 250 mM, 75.00%) were higher than those of TRV2:00 plants (200 mM, 71.75%; 250 mM, 38.75%) (Figure 5b). To better understand this increased salt tolerance of TRV2:CaFIRF1 plants at molecular and biochemical levels, we first performed RT-qPCR analysis of salt-responsive genes, including CaOSR1, CaRAB18 and CaP5CS, as described in previous studies (Bae et al., 2022; Lim et al., 2022; Lim, Lim, et al., 2021) (Figure 5c). In response to salt stress, expression levels of these three genes were significantly higher in the leaves of TRV2:CaFIRF1 plants than in the leaves of TRV2:00 plants. In particular, P5CS, pyrroline-5-carboxylate synthetase, has been known to play a critical role in the biosynthesis of proline, an osmo-protectant material (Alvarez et al., 2022; Funck et al., 2020); thus, we investigated proline accumulation in the leaves of TRV2:CaFIRF1 and TRV2:00 plants treated with salt stress (Figure 5d). There were no significant differences between proline levels in the two plant lines under normal conditions; however, TRV2:CaFIRF1 plants showed significantly higher proline content than TRV2:00 plants after treatment with 200 mM NaCl. High-salinity stress induces the production of reactive oxygen species and plasma membrane damage, resulting in the accumulation of lipid peroxidation products and ion leakage (Ayala et al., 2014; Gharsallah et al., 2016; Hasanuzzaman et al., 2018). For this reason, we measured MDA content and electrolyte leakage in response to salt stress (Figure 5e,f). Under normal conditions, TRV2:CaFIRF1 and TRV2:00 plants showed no differences in terms of MDA content and electrolyte leakage. High salinity induced MDA accumulation and electrolyte leakage in both plant lines, but TRV2:CaFIRF1 showed low MDA and electrolyte leakage levels relative to TRV2:00 plants. Collectively, these results indicate that CaFIRF1 has a negative role in high-salinity stress responses.
3.6 CaFIRF1-mediated protein stability of CaFAF1 under high-salinity stress
Given the data showing that CaFIRF1 ubiquitinates CaFAF1 (Figure 4) and the contrasting effects of CaFIRF1 and CaFAF1 in response to high salinity (Figure 5), we hypothesized that CaFIRF1 may be involved in the regulation of CaFAF1 protein abundance or degradation in response to high-salinity stress. To validate this, we initially examined how the protein stability of CaFAF1 is regulated as NaCl concentration increases. GFP-tagged CaFAF1 was transiently expressed in the leaves of N. benthamiana plants by agroinfiltration and after 2 days, these plants were treated with various NaCl concentrations (0, 50, 100 or 200 mM). To block 26S proteasome-mediated protein degradation, MG132 was infiltrated in one half of the leaf, and the other half was used as the mock control (Figures 6a and S8a). As expected, in the absence of NaCl, MG132 treatment increased the stability of CaFAF1-GFP (lane 2) compared to that of the untreated control (lane 1). Consistent with our previous study (Lim et al., 2022), CaFAF1-GFP proteins also became significantly more abundant following NaCl treatment (lanes 3−8), and in particular, the protein levels after treatment with 100 mM NaCl were comparable to those observed in healthy leaves after MG132 treatment. To further analyse the functional involvement of CaFIRF1 in the degradation CaFAF1 proteins under salt stress conditions, we conducted a cell-free degradation assay with TRV2:CaFIRF1 and TRV2:00 plants treated with 250 mM NaCl (Figures 6b and S8b). When incubated with leaf crude extracts from both plant lines, GST-CaFAF1 proteins were gradually degraded at designated times, and their degradation was inhibited by MG132 treatment. However, the silencing of CaFIRF1 contributed to the delayed degradation of CaFAF1 proteins, as evidenced by the reduced degradation observed when samples were incubated with crude extracts from TRV2:CaFIRF1 rather than TRV2:00 plants (Figures 6b and S8b).
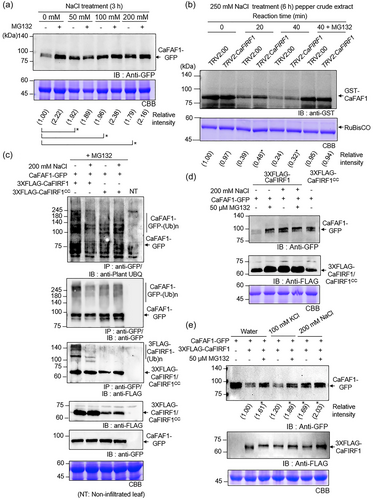
Next, we wondered how salt treatment affects CaFIRF1-mediated ubiquitination of CaFAF1 proteins. An in vivo ubiquitination assay was conducted with N. benthamiana leaves transiently coexpressing CaFAF1-GFP and 3XFLAG-CaFIRF1. The inactive form of CaFIRF1 (3XFLAG-CaFIRF1CC) was used as a negative control. All samples were treated with MG132 to block the degradation of ubiquitinated CaFAF1 and CaFIRF1 proteins. As shown in Figure 6c, treatment with 200 mM NaCl significantly inhibited the CaFIRF1-mediated ubiquitination of CaFAF1-GFP (lane 2) compared to control treatment (lane 1); this reduced level of ubiquitination was also observed by expressing 3XFLAG-CaFIRF1CC (lanes 3 and 4). We also analysed whether the stability of CaFAF1 proteins is enhanced when CaFIRF1-mediated ubiquitination is inhibited by salt. Consistent with the data presented in Figure 6c, co-expression of 3XFLAG-CaFIRF1 led to a decrease in the CaFAF1 protein level in the absence of MG132 (Figure 6d). However, the degradation of CaFAF1 proteins was inhibited by treatment with MG132 and/or NaCl, as well as by expression of 3XFLAG-CaFIRF1CC.
To further examine whether Na+ alone induces delayed degradation of CaFAF1, which is mediated by CaFIRF1, we co-expressed CaFAF1-GFP and 3XFLAG-CaFIRF1 in N. benthamiana leaves. Infiltrated leaves were either treated or not treated with MG132 before being floated into deionized distilled water (DDW), KCl or NaCl solutions (Figures 6e and S8c). Compared to that of the control (lane 1), the expression of 3XFLAG-CaFIRF1 negatively impacted the protein stability of CaFAF1-GFP in DDW (lane 2) and KCl solutions (lane 4). However, in the NaCl solution, 3XFLAG-CaFIRF1 failed to induce the degradation of CaFAF1-GFP (lane 6). Additionally, treatment with MG132 (lanes 3, 5 and 7) effectively inhibited CaFIRF1-mediated 26S proteasomal degradation of CaFAF1-GFP. These results suggest that CaFIRF1 may play a role in the ubiquitination and subsequent protein degradation of CaFAF1 via the 26S proteasome pathway. In addition, in response to high-salinity stress, especially in the presence of sodium ions, the CaFIRF1-mediated 26S proteasomal degradation of CaFAF1 appears to be repressed.
3.7 Decreased tolerance of CaFIRF1 and CaFAF1 double-silenced pepper plants to high-salinity stress
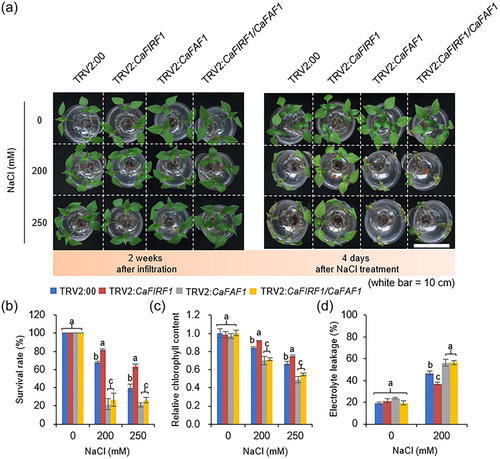
To determine the epistatic relationship between CaFIRF1 and CaFAF1 in responses to salt stress, we sought to generate double gene knockdown pepper plants using the VIGS technique, as described previously (Joo et al., 2019, 2020). Semiquantitative RT-PCR analysis revealed that the expression levels of both CaFIRF1 and CaFAF1 genes were significantly lower in CaFIRF1/CaFAF1-pepper plants (TRV2:CaFIRF1/CaFAF1) than in control plants (Figure S6). This double gene silencing did not lead to significant phenotypic differences compared to control plants under normal conditions. As mentioned above, TRV2:CaFIRF1/CaFAF1, TRV2:CaFIRF1, TRV2:CaFAF1 and TRV2:00 plants were subjected to various NaCl concentrations (0, 200 and 250 mM) (Figure 7a). Four days after treatment with the NaCl solution, TRV2:CaFIRF1 plants were less wilted than TRV2:00 plants. In contrast, TRV2:CaFAF1 plants were significantly more wilted compared to TRV2:00 plants, as was also shown in a previous study (Lim et al., 2022), and this salt-sensitive phenotype was also observed in TRV2:CaFIRF1/CaFAF1 plants (Figure 7a, right image). Consistently, the survival rates of the TRV2:CaFIRF1/CaFAF1 and TRV2:CaFAF1 plants were much lower than those of TRV2:00, and these gene knockdown mutants showed similar survival rates (Figure 7b). Since salt stress directly and indirectly affects plant chlorophyll content, we further measured the chlorophyll content in leaves from TRV2:CaFIRF1/CaFAF1, TRV2:CaFIRF1, TRV2:CaFAF1 and TRV2:00 (Figure 7c). As expected, salt stress led to a decrease in chlorophyll content in all plant lines. Although these gene knockdown mutants had statistically similar chlorophyll content to control plants under normal conditions, TRV2:CaFIRF1/CaFAF1 plants showed significantly lower chlorophyll content than TRV2:00 in response to salt stress, similarly to TRV2:CaFAF1 plants. Consistent with the salt-sensitive phenotype, salt stress caused relatively high electrolyte leakage in the leaves of TRV2:CaFIRF1/CaFAF1 and TRV2:CaFAF1 compared to those TRV2:00 plants (Figure 7d). These results indicate that CaFAF1 is epistatic to CaFIRF1 in response to high-salinity stress.
4 DISCUSSION
Numerous studies have suggested that the modulation of protein stability/degradation via the UPS is associated with plant responses to biotic and abiotic stresses. In Arabidopsis, several stress-related E3 ligases have been identified, including those of the RGLG family, members of which are known to function as E3 ligases in various stress responses (Belda-Palazon et al., 2019; Cheng et al., 2012; Wu et al., 2016; Zhang et al., 2012). In particular, RGLG1 and RGLG2 are known to negatively regulate MAPKKK18- and AtERF53-mediated drought responses by modulating protein stability (Cheng et al., 2012; Yu et al., 2021). In this study, phylogenetic analysis showed that CaFIRF1 is homologous to Arabidopsis RGLG1 and RGLG2 (Figure 2a), suggesting a potential negative regulatory role for CaFIRF1 in abiotic stress responses. However, patterns of increased CaFIRF1 expression were shown in response to several abiotic stresses such as dehydration, NaCl, mannitol and ABA treatment, compared to their respective initial points (Figure 2b). Several complex processes are involved in gene transcription; hence, transcripts of both negative and positive regulators could accumulate in response to the same stimulus (Kilian et al., 2007). Previously, expression levels of several RING E3 ligases were found to increase in response to abiotic stresses, even though these ligases had been identified as negative regulators (Cui et al., 2018; Fang et al., 2015; Hwang et al., 2016; Kim & Jang, 2021; Park et al., 2015). This paradoxical pattern may be explained by the existence of negative feedback loops. As observed in rice, where drought, salt and exogenous ABA up-regulated the expression of OsDIRP1, overexpression of OsDRIP1 resulted in reduced drought and salt tolerance. These findings imply the involvement of OsDIRP1 in ABA-mediated drought and salt stress responses via a negative feedback loop (Cui et al., 2018). In line with this, our phenotypic analyses revealed that CaFIRF1 negatively regulates the high-salinity stress response (Figure 5), suggesting its potential participation in ABA-mediated high-salinity stress responses through a negative feedback loop.
The negative involvement of CaFIRF1 expands our understanding of the intricate regulatory networks involved in plant stress responses. Previously, we reported that CaFAF1 has unique roles in responses to drought and high-salinity stresses that are dependent on its protein stability (Lim et al., 2022). Moreover, treatment of MG132, an inhibitor of the 26S proteasomal degradation pathway, relieved the degradation of CaFAF1 under both stresses, indicating that some E3 ligases could be associated with the degradation of CaFAF1. In the present study, we identified CaFIRF1 as an interacting partner of CaFAF1 and found that this interaction occurred in the cytoplasm (Figure 1), and this interaction appeared to be significantly enhanced as salt concentration increased (Figure S2). CaFIRF1 had a conserved C3H1C4-type RING domain and showed E3 ligase activity (Figure 3). In addition, CaFIRF1 ubiquitinated CaFAF1 in vitro and in vivo (Figures 4 and S3). We also confirmed the epistatic relationship between CaFAF1 and CaFIRF1 (Figure 7). Therefore, we demonstrated that the RING-type E3 ligase CaFIRF1 modulates CaFAF1 stability in the cytoplasm, indicating that CaFIRF1 acts as a potential upstream regulator of CaFAF1.
Moving beyond the molecular interactions between CaFAF1 and CaFIRF1, exploring the functional implication of their interactions, particularly under high-salinity stress, is crucial for understanding the complex signalling pathways activated by plants when they are subjected to salt stress. These pathways likely encompass a cascade of events, encompassing alterations in protein stability, ubiquitination and potentially other posttranslational modifications. In response to high-salinity stress, the stability of CaFAF1 proteins increased, resulting in a salt-tolerant phenotype (Lim et al., 2022). We hypothesized that this phenomenon might be caused by changes in the stability of CaFIRF1 under stress conditions, and we reassessed the stability of CaFAF1 and CaFIRF1 under high-salinity conditions. Contrary to our expectation, we found that there was no change in CaFIRF1 stability and an increase in CaFAF1 stability under high-salinity stress, indicating that the protein stability of the upstream regulator does not underlay the aforementioned phenomenon (Figures S7 and 6a). We then focused on the change in ubiquitination between these two proteins in response to high concentrations of salt. Our data showed that CaFIRF1-mediated ubiquitination of CaFAF1 decreased in response to salt, specifically sodium ions (Figure 6). Sodium ions affect cellular proteins through direct and indirect pathways (Maathuis, 2013; Mojtabavi et al., 2019; Pardo & Quintero, 2002; Persaud et al., 2022). In this context, sodium ions could directly or indirectly affect CaFIRF1 and/or CaFAF1. Excess sodium ions present under high salinity may activate various cellular proteins associated with salt signalling that may in turn affect the catalytic activity of CaFIRF1. Alternatively, excess sodium ions may directly affect the conformational structure of CaFIRF1 (or CaFAF1). In addition, unidentified protein processing could also be at work. For example, in Arabidopsis, under normal conditions, RGLG1 and RGLG2 are myristoylated and mostly localized to the plasma membrane. However, osmotic stress and ABA modulate the subcellular translocation of RGLG1 and RGLG2 by limiting their myristoylation, resulting in shuffling to the nucleus and leading to the regulation of PP2CA or AtERF53 protein stability (Belda-Palazon et al., 2019; Cheng et al., 2012). The translocation of RGLG1 and RGLG2 induced by osmotic stress and ABA also regulates the stability of MAPKKK18, suggesting that this mechanism deserves further investigation (Yu et al., 2021). Therefore, multiple processes, including CaFIRF1 modification and the actions of unidentified proteins induced by salt stress signalling, may be associated with CaFIRF1-mediated ubiquitination of CaFAF1, and these mechanisms could be elucidated in future studies.
Additionally, the association between CaFIRF1 and CaFAF1 in response to salt stress appears to be governed by a reciprocal regulation mechanism, balancing plant growth and stress response. When faced with stressful conditions, plants exhibit growth suppression as an adaptive strategy to prioritize stress response mechanisms and ensure overall survival (Wang et al., 2018). High salinity stress causes various physiological and molecular changes from the cellular to the whole plant level, resulting in the initiation of salt stress response and the repression of plant growth (Wang et al., 2018; Zhang et al., 2020). Considering the function of CaFAF1 in salt stress, it becomes evident that the stress response, positively mediated by CaFAF1, may exert a detrimental effect on plant growth. Therefore, the CaFIRF1-mediated ubiquitination of CaFAF1 is anticipated to finely coordinate the stress response and plant growth.
In conclusion, our results suggest a new pathway for fine-tuning responses to high salinity in pepper plants via CaFIRF1 and CaFAF1. We found that CaFIRF1 acts as a negative regulator in the high-salinity stress response. In addition, CaFIRF1, which functions as an E3 ligase, interacts with and ubiquitinates CaFAF1, modulating CaFAF1 stability via the ubiquitin-26S proteasome system. This modulation ultimately reduces pepper plants' tolerance to high salinity. However, the increased stability of CaFAF1 under high-salinity conditions leading to a salt-tolerant phenotype suggests that this protein may be a key regulator of stress tolerance. Investigating how CaFAF1 influences downstream targets or pathways could provide valuable information on the molecular basis of salt tolerance in plants. This knowledge could be applied in crop improvement strategies to develop salt-resistant varieties.
ACKNOWLEDGEMENTS
This work was supported by a grant from the Agriculture & Technology Development (Project No. RS-2024-00322140) and a National Research Foundation of Korea (NRF) grant funded by the Korean Government (MSIT; no. 2021R1A2C1007115, SRC; no. 2018R1A5A1023599), Republic of Korea.
CONFLICT OF INTEREST STATEMENT
The authors declare no conflict of interest.
Open Research
DATA AVAILABILITY STATEMENT
Data sharing is not applicable to this article as no new data were created or analysed in this study.


