Red and blue light treatments of ripening bilberry fruits reveal differences in signalling through abscisic acid-regulated anthocyanin biosynthesis
Funding information: New Zealand Ministry for Business, Innovation, and Employment (MBIE) Endeavour programme - ‘Filling the Void: boosting the nutritional content of NZ fruit, Grant/Award Number: C11X1704; Nord Plant - NordForsk, Grant/Award Number: 84597; UiT- BFE faculty's mobility grant- University of Tromsø
Abstract
The biosynthesis of anthocyanins has been shown to be influenced by light quality. However, the molecular mechanisms underlying the light-mediated regulation of fruit anthocyanin biosynthesis are not well understood. In this study, we analysed the effects of supplemental red and blue light on the anthocyanin biosynthesis in non-climacteric bilberry (Vaccinium myrtillus L.). After 6 days of continuous irradiation during ripening, both red and blue light elevated concentration of anthocyanins, up to 12- and 4-folds, respectively, compared to the control. Transcriptomic analysis of ripening berries showed that both light treatments up-regulated all the major anthocyanin structural genes, the key regulatory MYB transcription factors and abscisic acid (ABA) biosynthetic genes. However, higher induction of specific genes of anthocyanin and delphinidin biosynthesis alongside ABA signal perception and metabolism were found in red light. The difference in red and blue light signalling was found in 9-cis-epoxycarotenoid dioxygenase (NCED), ABA receptor pyrabactin resistance-like (PYL) and catabolic ABA-8'hydroxylase gene expression. Red light also up-regulated expression of soluble N-ethylmaleimide-sensitive factor attachment protein receptor (SNARE) domain transporters, which may indicate involvement of these proteins in vesicular trafficking of anthocyanins during fruit ripening. Our results suggest differential signal transduction and transport mechanisms between red and blue light in ABA-regulated anthocyanin and delphinidin biosynthesis during bilberry fruit ripening.
1 INTRODUCTION
Light is among the most important environmental factors modifying plant growth and development. Higher plants have evolved sophisticated mechanisms to perceive light signals through specialized photoreceptors that respond to various light properties, such as light intensity, light spectral quality and photoperiod (Briggs & Olney, 2001; Zoratti, Karppinen, Luengo Escobar, Häggman, & Jaakola, 2014). Different visible light photoreceptors and UV-B receptors can sense light signals from a broad range of solar spectrum between 280 and 750 nm (Möglich, Yang, Ayers, & Moffat, 2010). Most of the transducible wavelengths absorbed by plants fall within 400–700 nm (from blue to red), which is also commonly referred to as photosynthetically active radiation (PAR; Chen, Chory, & Fankhauser, 2004). Within this range, phytochrome B has a specialized function towards red light while cryptochromes sense blue light to promote photomorphogenesis (Li & Yang, 2007; Lu et al., 2015).
After light perception, phytochrome and cryptochrome interact with the E3 ubiquitin ligase constitutive photomorphogenesis protein 1 (COP1), which is the key light signalling regulator (Lau & Deng, 2012). In the dark, COP1 directly interacts and represses the action of elongated hypocotyl 5 (HY5) gene inhibiting light signal transmittance and circadian clock genes, also the flowering regulators, such as CONSTANS (CO) via the proteasomal degradation complex (Bhatnagar, Singh, Khurana, & Burman, 2020; Zoratti, Karppinen, et al., 2014). Under light, COP1 activity is repressed, allowing the expression of HY5 and positive transcriptional regulators in a number of developmental processes and metabolic pathways, including anthocyanin biosynthesis (Wu et al., 2019).
Light quality has a significant influence on plant secondary metabolism (Ouzounis, Rosenqvist, & Ottosen, 2015). For example, biosynthesis of polyphenols, anthocyanins, glucosinolates, terpenes, and carotenoids in plant tissues are responsive to light quality, and they have important roles, for example, in photoprotection (Ballaré, 2014; Holopainen, Kivimäenpää, & Julkunen-Tiitto, 2018). Light quality also influences the metabolite accumulation in fruits and berries, as shown by several pre- and postharvest light treatments in different fruit crops (Koyama, Ikeda, Poudel, & Goto-Yamamoto, 2012; Tao et al., 2018; Kokalj et al., 2019). High light intensity has generally been reported to increase anthocyanin accumulation in fruits, but it is also affected by light quality (Jaakola, 2013; Ma et al., 2019). For instance, red light has been reported to increase anthocyanin content in strawberry (Fragaria × ananassa), and blue light radiation increased anthocyanin levels after selective bagging treatment in pear (Pyrus communis L.) fruit (Miao et al., 2016; Tao et al., 2018). In bilberry, Zoratti et al. (2014) showed that short-term treatment with supplemental monochromatic light affected the anthocyanin profile during bilberry fruit development. However, the regulatory mechanisms behind the effect of red and blue light wavelengths on anthocyanin biosynthesis are not well understood.
Anthocyanins are prominent phenolic compounds in plants that are biosynthesized from the well-studied flavonoid pathway, which branches from phenylpropanoid biosynthesis (Tohge, de Souza, & Fernie, 2017). The major early biosynthetic enzymes involved in flavonoid biosynthesis are phenylalanine ammonia lyase (PAL), chalcone synthase (CHS) and chalcone isomerase (CHI). At the branchpoint of flavonoid biosynthesis, flavonoid 3′ hydroxylase (F3′H) and flavonoid 3′5′ hydroxylase (F3′5′H) direct biosynthesis to cyanidin and delphinidin compounds, respectively (Jaakola et al., 2002). The six major anthocyanin aglycone end-products, namely cyanidin, delphinidin, pelargonidin, petunidin, malvidin and peonidin, are biosynthesized by the late biosynthetic enzymes, dihydroflavonol 4-reductase (DFR) and anthocyanin synthase (ANS), and further glycosylated by UDP-glucose: flavonoid-O-glycosyltransferase (UFGT) as the last step in anthocyanin biosynthesis (Wu, Gong, Ni, Zhou, & Gao, 2017). Anthocyanins are transported to the vacuole after their biosynthesis. The mechanisms of anthocyanin transport are not fully understood, but common transporter proteins, such as ATP-binding cassettes (ABCs), multidrug and toxic extrusion (MATEs) and glutathione-S-transferases (GSTs), are commonly believed to be responsible for transportation to vacuolar membrane and lumen (Behrens, Smith, Iancu, Choe, & Dean, 2019). Another proposed model has been vesicular trafficking by phagosomes involving engulfment of anthocyanin bodies by endosomes before reaching the vacuole (Chanoca et al., 2015). The vesicular transportation is mediated by soluble N-ethylmaleimide-sensitive factor attachment protein receptor (SNARE) protein complexes, which are proposed to have a role in cellular transport in higher plants under stress responses (Pečenková, Marković, Sabol, Kulich, & Zárský, 2017).
The biosynthesis of flavonoids is directly controlled by the transcriptional regulatory MYB, bHLH,WD-40’ complex (MBW) complex, consisting of MYB and bHLH transcription factors (TFs) and WD-40 repeat proteins (Feller, MacHemer, Braun, & Grotewold, 2011; Xu, Dubos, & Lepiniec, 2015). R2R3 MYB TFs are known as the key regulators of anthocyanin biosynthesis and are responsive to shifts in light spectral quality (Zoratti, Karppinen, et al., 2014). In grapes, two R2R3 MYB TFs, VvMYBA1 and VvMYBA2, controlling anthocyanin biosynthesis specifically regulate UFGT (Walker et al., 2007). In apple and peach, R2R3 MYBA-type TFs activate anthocyanin biosynthesis by interacting with both the UFGT and DFR promoters during fruit ripening (Ravaglia et al., 2013; Takos et al., 2006).
Abscisic acid (ABA), which is synthesized by the key cleavage enzyme 9-cis-epoxycarotenoid dioxygenase (NCED) in apocarotenoid pathway, has been shown to be a major regulator of ripening in non-climacteric fruits, such as strawberry, grapes and bilberry (Ferrara et al., 2015; Jia et al., 2011; Karppinen, Tegelberg, Häggman, & Jaakola, 2018) and in climacteric fruits, such as apple (An et al., 2021). The ABA signal transduction is known to be mediated by pyrabactin resistance/like (PYR/PYL) receptors and ABA-responsive element-binding factors (ABFs) through SQUAMOSA-MADS box (TDR-type) TFs leading to regulation of the MBW complex proteins (Chung et al., 2019). Another model has been proposed, illustrating that ABA interacts directly with PYR by inhibiting type 2C protein phosphatases subsequently binding with ABFs and transduces the ABA signalling pathway (Park et al., 2009).
Bilberry (Vaccinium myrtillus L.), also known as European blueberry, is one of the most important wild perennial berry species of Vaccinium genus and predominantly found in Northern Europe (Chu, Cheung, Lau, & Benzie, 2011; Karppinen, Zoratti, Nguyenquynh, Häggman, & Jaakola, 2016; Zoratti, Klemettilä, & Jaakola, 2016). The species has gained global interest due to its abundant health-beneficial bioactive compounds, including phenolic compounds, carotenoids and vitamins but especially anthocyanins, which constitutes 90% of total phenolics in these berries and give distinct deep blue colour to both skin and flesh (Karppinen, Zoratti, Nguyenquynh, et al., 2016). Several studies have reported consumption of bilberries to reduce risk of metabolic syndrome and various microbial and degenerative diseases (Bujor, Le Bourvellec, Volf, Popa, & Dufour, 2016; Chu et al., 2011; Nile & Park, 2014). In bilberry, delphinidin and cyanidin glycosides are the major anthocyanins followed by malvidin and petunidin glycosides (Müller, Schantz, & Richling, 2012; Thornthwaite, Thibado, & Thornthwaite, 2020; Zoratti et al., 2016). In particular, delphinidins, which are abundant in northern clones alongside malvidins, have been recently linked to many biological and health-beneficial activities (Heysieattalab & Sadeghi, 2020; Nagaoka et al., 2019).
In the present study, we utilized the Illumina-based RNA-seq approach to produce transcriptome libraries from ripening bilberry fruit grown under supplemental red and blue light conditions. We specifically focused on the differences in red and blue light signal transduction in regulation of anthocyanin biosynthesis. The red and blue light-emitting diodes (LEDs) used in our study give an opportunity to provide high intensity spectral wavelengths to plants as source of light for studying the effect of light quality to biosynthesis of phytochemicals.
2 MATERIALS AND METHODS
2.1 Plant material and light treatments
Wild bilberry (V. myrtillus L.) ecotype from Tromsø, Norway (69° 75′N, 19° 01′E) was used for the experiments. The bilberry bushes were collected during early July after the fruit set at stage S2 when berries were small, unripe and green (Figure 1a). The plants were collected in boxes (50 × 70 cm) with their root system intact in forest soil and watered well. The plants were kept in the phytotron conditions at 16°C for few days to acclimatize until they reached berry developmental stage S3 when berries were large, unripe and green (Figure 1a).
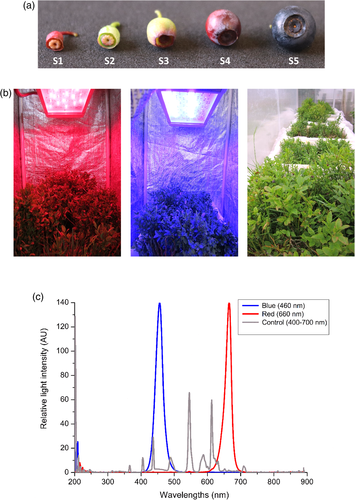
For light treatments, the plants were placed in chambers covered from sides with photo reflective sheets and irradiated from top with blue (460 nm) or red (660 nm) light wavelength provided by the Heliospectra RX30 lamps (Heliopspectra AB, Gothenburg, Sweden; Figure 1b). In addition to the specific spectral light wavelengths, the plants received continuous ambient white light (400–700 nm) from the top. The plants under the ambient white light (400–700 nm) served as control for the experiment. All plants were kept at 16°C, and the photon fluence rate (μmol m−2 s−1) and irradiation energy flux (μW cm−2) were measured using JAZ Spectrometer (Ocean Optics Inc., Orlando, FL, USA) and used to calculate the relative light intensity expressed as arbitrary units (AU; Figure 1c).
Berry samples were collected after 6 days from the beginning of the light treatments when berries had reached stage S4 and started to develop red colour on their skin (Figure 1a), and utilized for RNA sequencing and real-time qRT-PCR analyses. For metabolite analyses, light-treated S4 stage berries at 6 and 12 days and fully ripe berries after 4 weeks from the beginning of light treatments at stage S5 (Figure 1a) were collected. Approximately 20–25 berries were collected per treatment from three replicate bushes for RNA extraction and metabolite analyses. Immediately after collection, all the berry samples were frozen in liquid nitrogen and stored at −80°C until further used for analyses.
2.2 RNA extraction and sequencing
The frozen berries were ground to a fine powder under liquid nitrogen using mortar and pestle. Total RNA was isolated from approximately 120 mg tissue powder by using Spectrum Plant Total RNA kit (Sigma-Aldrich, St. Louis, MO, USA) following the manufacturer's instructions. Contaminating DNA was removed with on-column digestion using DNase I (Sigma-Aldrich).
For constructing RNA libraries, the RNA was qualified with both NanoDrop 2000c UV–vis spectrophotometer (NanoDrop Technologies, Wilmington, DE, USA) and Experion Bioanalyzer (Bio-Rad laboratories, Hercules, CA, USA). To segregate the mRNA from total RNA, poly-A was captured using oligo (dT) Dynabeads (Invitrogen, Carlsbad, CA, USA). Before library preparation, all the samples were qualified by an Agilent 2100 Bioanalyzer (Agilent Technologies, Santa Clara, CA, USA). The libraries were prepared with NEBNext Ultra II RNA Library Prep Kit (New England Biolabs Inc., Ipswich, MA, USA). Sequencing of RNA libraries was performed using an Illumina Hiseq2000 platform (Illumina, San Diego, CA, USA) with paired-end sequencing strategy (PE-150 bp) at the Novogene sequencing services facility (Cambridge Science Park, UK). Libraries were prepared with three biological replicates for each blue, red and white (control) light treatments.
2.3 Transcriptome assembly
The raw reads from Illumina were initially quality assessed using MultiQC software (Andrews, 2010; Ewels, Magnusson, Lundin, & Käller, 2016). The adapter contamination was removed using Trimmomatic tool specifically designed for Illumina Next generation sequencing data (Bolger, Lohse, & Usadel, 2014), followed by the removal of the residual rRNA reads by using sortMeRNA programme (Kopylova, Noé, & Touzet, 2012). The quality checking by MultiQC included assessment of sequence quality score (phred >30), adapter content and position, GC content and ambiguous bases (Ns). Only the clean filtered reads were used in our downstream analysis. A robust transcriptome was constructed with Trinity v2.9.0 software pipeline (Grabherr et al., 2011) by developing a combined redundant-over assembly from de novo and genome-guided assembly using a bilberry genome sequence of the same bilberry ecotype (Wu et al., 2021). The draft genome was indexed and align-mapped to the reads using STAR v2.6.1d software (Dobin et al., 2013). The genome-guided Trinity output was concatenated with de novo transcriptome to form a combined assembly. EvidentialGene tool (Gilbert, 2019) was used to remove the redundancy arising from assemblies. The reads were further mapped to the published highbush blueberry (V. corymbosum cv. Draper) v1.0 genome (Colle et al., 2019) using HISAT2 software to improve the annotation of assembly. The best possible coding regions were identified using TransDecoder tool (http://transdecoder.github.io), which identifies a minimal length of open reading frames (ORFs) within reconstructed Trinity transcripts. To assess the completeness of the transcriptome assemblies, BUSCO tool v3.0 (Simão, Waterhouse, Ioannidis, Kriventseva, & Zdobnov, 2015) was used to validate the single copy genes on an evolutionary perspective. Embryophyta orthologous database odb_v.10 (https://busco-archive.ezlab.org/v3/) was used to validate the assembled transcriptomes.
2.4 Functional annotation of transcriptome
Functional annotation was performed by using Trinotate pipeline v3.2.1 (http://trinotate.github.io), which utilizes the homology search based on Swissprot, Pfam and NCBI-BLAST-nr (non-redundant) databases from the Cluster database at high identity with tolerance clustered trinity transcript IDs and TransDecoder-derived peptide sequences. The cut-off E-value for the BLAST search was adjusted between 1.0−5 and 1.0−100, and the homology search was performed with default parameters. Additional tools, such as SignalP, tmHMM and RNAMMER (http://www.cbs.dtu.dk/services/), were integrated into the Trinotate pipeline to determine probable signal peptides, transmembrane helices and residual rRNA transcripts, respectively, in the assembled transcriptome. All the major TF families and transcriptional regulators were determined using the PlantTFcat tool (http://plantgrn.noble.org/PlantTFcat/).
2.5 Differential gene expression and pathway analysis
To quantify the gene expression levels from the transcriptomes, we utilized Salmon tool (Patro, Duggal, Love, Irizarry, & Kingsford, 2017), which was able to identify and quantify the known gene isoforms. Differentially expressed genes (DEGs) between the light treatments (red vs. control and blue vs. control) were identified using DESeq2 v3.10 software package (Love, Huber, & Anders, 2014) with false discovery rate (FDR) adjusted p-value set to 0.05. Log2 fold change ratio between ≥2 and ≤−2 was used to obtain the list of up- and down-regulated genes.
Gene Ontology (GO) terms for the transcripts were analysed using GOseq v3.11 software (https://bioconductor.org/packages/release/bioc/html/goseq.html) in R-package followed by enrichment analysis using Fisher's exact test. For validation and to improve the accuracy in GO determination, the top 500 DEGs from both the contrasts (red vs. control, blue vs. control) were extracted and annotated with Blast2GO suite (Gotz et al., 2008). Kyoto Encyclopedia of Genes and Genomes (KEGG) pathway enrichment analysis was performed in KOBAS v3.0 tool (Wu, Mao, Cai, Luo, & Wei, 2006) followed by interpreting the KEGG Orthology (KO) terms in KEGG Automated Annotation Server (KAAS) using Vitis vinifera as a reference organism for obtaining the KO identifiers. The original figures and pathway representations were created with www.biorender.com.
2.6 qRT-PCR analysis
Total RNA was isolated from the berry samples using the same method as described earlier. First-strand cDNA was synthesized using Superscript IV reverse transcriptase (Invitrogen) from 1-μg total RNA according to manufacturer's instructions. MJ MiniOpticon Real-Time PCR System (Bio-Rad) was used for qRT-PCR analysis with SsoFast™ EvaGreen Supermix (Bio-Rad) in 15-μl volume reaction. The PCR conditions were as follows: initial denaturation at 95°C for 30 s followed by 40 cycles at 95°C for 5 s, and 60°C for 10 s. Subsequent melting curve analysis, ranging from 65°C to 95°C with an increment of 0.5°C per cycle, was used to assure amplification of only one product. All analyses were performed with three biological replicates and two technical replicates. The results were analysed using CFX Connect software (Bio-Rad) using 2(−ΔΔCt) method, and the relative expression levels were normalized with glyceraldehyde-3-phosphate dehydrogenase (GAPDH) or Actin. Primer sequences of the genes are listed in Table S1.
2.7 Analysis of anthocyanins
Bilberry (S4 stage) samples collected after 6 days of light treatment (equal time-point with transcriptomics samples) were ground and freeze-dried in a lyophilizer (Virtis benchtop-K; SP Scientific, Gardiner, NY, USA). Approximately 43-mg dry weight (DW) of freeze-dried bilberry powder from each sample was used in extraction. The samples were extracted twice with 500-μl MeOH:IPA:acetic acid (20:79:1) for anthocyanin analysis. The extracts were evaporated to dryness and resuspended in 100-μl MeOH. The extracts were analysed with ultra high performance liquid chromatography coupled to photodiode array (UPLC-PDA)-Synapt G2 Quadrupole time of flight/High-definition mass spectrometry (Waters, Milford, MA, USA) in positive (ESI+) resolution ion mode. Samples were analysed with capillary voltage at 3.0 kV. The source temperature was 120°C, and desolvation temperature was set to 360°C; cone gas flow rate was 20 L/h, and desolvation gas flow rate was 800 L/h. The compounds were separated on an Acquity UPLC-BEH C18 column (1.7 μm, 50 × 2.1 mm, Waters) in 40°C. The mobile phase consisted of (a) H2O and (b) acetonitrile (Chromasolv grade, Sigma-Aldrich, Steinheim, Germany) both containing 0.1% HCOOH (Sigma-Aldrich). A gradient of eluents was used as follows: linear gradient of 95% of A to 5% in 10 min, and then back to 95% at 10.1 min and left to equilibrate for 1 min. The injection volume was 2 μl, and flow-rate of the mobile phase was 0.6 ml/min. Tray temperature was set to 10°C. Mass range was set from 100 to 1,500. Peak picking and integration of the peaks were executed with MassLynx V4.2 (Waters), and identification was performed by comparing the exact mass/chemical formula, retention time, UV-spectra, and/or previously published data of bilberry secondary metabolites. The relative content of the anthocyanins in AU was calculated by normalizing the analyte peaks area with the DW of the samples (AU/mg DW). Total anthocyanins from S4 stage berries after 12 days from light treatment were measured according to Karppinen et al. (2018).
To determine the anthocyanins from S5 stage fully ripe berries, 100 mg of samples were ground to a fine powder under liquid nitrogen using mortar and pestle and freeze-dried overnight to remove water content. The samples were further extracted with methanol acidified with 0.1% HCl (v/v) for 2 h at room temperature before being centrifuged and the supernatant vacuum spin dried. The pellet was resuspended in 500 μl 20% methanol and filtered using 0.45-μM PVDF syringe filter (Phenomenex, Torrance, CA, USA). The samples were diluted to 1:10 with 20% methanol before a 5-μl aliquot was injected into a C18 Acclaim Polar Advantage II column (150 × 2.1 mm i.d., 3-μm particle size; Dionex, Sunnyvale, CA, USA) in an high performance liquid chromatography (HPLC) system (Ultimate 3000; Thermo Fisher Dionex) coupled with a diode array detector (DAD). The column oven temperature was set to 35°C, and the flow rate was adjusted to 0.350 ml/min. The mobile phases consisted of 10% formic acid (A) and a mixture of 45% methanol, 45% acetonitrile and 10% formic acid (B). The gradient was as follows: 100% A followed by 9% B in A for 0–12 min, 35% B in A for 12–25 min, 50% B in A for 25 min and 9% B in A for 30–35 min. The identified anthocyanin peaks were compared with that of known authentic standards and monitored at 254, 280, 320 and 520 nm. The samples were quantified using a calibration curve and expressed as cyanidin 3-O-galactoside equivalents. All analyses were performed with three biological replicates.
2.8 Statistical analysis
The statistical analysis of LC–MS profiling data was performed with MetaboAnalyst 5.0 tool (Chong, Wishart, & Xia, 2019). Differences in anthocyanin levels among the light treatments were analysed by one-way analysis of variance (ANOVA) followed by Tukey's post-hoc test. Statistically significant differences between the light treatments analysed by qRT-PCR were determined by independent samples t-test in SPSS Statistics programme v26 (IBM corporation, New York, NY, USA). Pearson's correlation matrices were used to visualize the statistical relationship from correlation coefficients between selected gene expression levels and dominant anthocyanin concentrations (delphinidin 3-galactoside and delphinidin 3-arabinoside) with p-value set to <0.05. ANOVA and Pearson's correlation analysis were performed using OriginPro software v2020b (OriginLab Corporation, Northampton, MA, USA).
3 RESULTS
3.1 Elevated anthocyanin content under red and blue supplemental light
Metabolite profiling with UPLC-HDMS was performed from light-treated berry samples after 6 days (same time-point for transcriptome libraries). The red, blue and control samples from the metabolite analysis were separated in the first component in the principal component analysis (PCA), explaining 32.3% of the variation (Figure S1). The heat-map analysis of metabolite profiling data shows large number of significantly different metabolites (407 metabolites of total 700, ANOVA, p < 0.05); anthocyanins localized in the middle part of the clusters (Figure S2). The results showed consistent and significant increase in all the anthocyanin compounds under both the red and blue light treatments when compared with control (Figure 2a). Delphinidin galactosides/glucosides were detected 12-fold higher in red light when compared to other light treatments followed by significant increase in all the cyanidin, petunidin and malvidin glycosides (Figure 2a). In addition, the total anthocyanins quantified in ripening berries (S4 stage) after 12 days of light treatment showed higher amounts of anthocyanin accumulation in red light followed by blue light treatments compared with ambient white light control (Figure 2b).
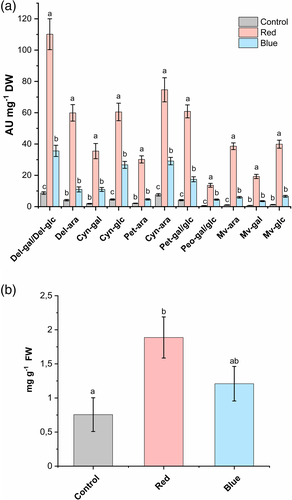
Similar trend was also observed in S5 stage fully ripe berries although the difference was not as apparent (Table S2). Quantitative analysis with HPLC confirmed that the two major delphinidin glycosides, delphinidin-3-galactoside and delphinidin 3-arabinoside, were found at significantly higher amounts in red light treatment, contributing to the increase in total anthocyanin content (4,760 mg 100 g−1 DW) compared to that of blue light and the control samples. The trend is followed by the increase in levels of cyanidin and petunidin glycosides in red light treated berries. A very low amount of peonidin-3-glucoside was detected in all the samples, which was not generally influenced by different light treatments (Table S2).
3.2 Bilberry transcriptome sequencing and functional annotation
The raw sequencing reads of the bilberry transcriptomes yielded approximately 56 GB of data and reached approximately 8 GB per sample data. The read number for control samples was 70,627,656 bases, whereas it was 82,253,205 bases for the red light-treated samples and 78,192,227 bases for the blue light-treated samples (Table S3). MultiQC analysis proved that the processed reads were of good quality with Phred score >36 (Table S2). Read-mapping to a recently published V. corymbosum genome (Colle et al., 2019) resulted in 75–77% of total reads mapped including ~50% uniquely mapped to the genome. Using a draft genome of bilberry (Wu et al., 2021), representing the same bilberry ecotype as our samples, enabled unique mapping of 83.5% of the filtered reads. A total of 671,952 transcripts and 472,876 unigenes were generated from the combined transcriptome assembly with mean contig lengths of 911 and 720 bp, respectively (Table 1). BUSCO analysis revealed that the combined assembly had 97.4% complete sequences when searched within 1,375 orthologous groups of embryophyta_odb9 lineage (Table S4). The scores were slightly improved compared to genome-guided assembly, indicating that the combined transcriptome in our analysis is a robust assembly and was subsequently used in this study.
| Assembly | Transcripts | Unigenes | |
|---|---|---|---|
| Total counts | 671,952 | 472,876 | |
| Contig N50 (bp) | 1,567 | 1,122 | |
| Contig N30 (bp) | 2,431 | 2035 | |
| Average contig length (bp) | 910.78 | 720.23 | |
| Median contig length (bp) | 508 | 408 | |
| Total assembled bases | 611,998,789 | 340,578,754 | |
| Average read length | 150 bp | ||
| Percent GC | 41.71% |
In total, around 25,316 (61%) of putative protein IDs of bilberry transcripts showed significant hits in Swissprot and 25,280 (61%) in Pfam databases (Figure 3a). Around 60% of the sequences had hits with eggNOG (clusters of orthologous groups) and relatively high number of hits (65%) obtained from the KEGG database (Figure 3a). BLAST hits distribution among the top-25 species showed the highest homology in Rhododendron williamsianum (33%) followed by Camelia sinensis var. (25%) and Actinidia chinensis var. (16%). The top-hit species with some considerable matches obtained from the top DEGs (0.2–2.6%) showed sequence similarities with V. myrtillus, V. macrocarpon and V. corymbosum (Figure S3).
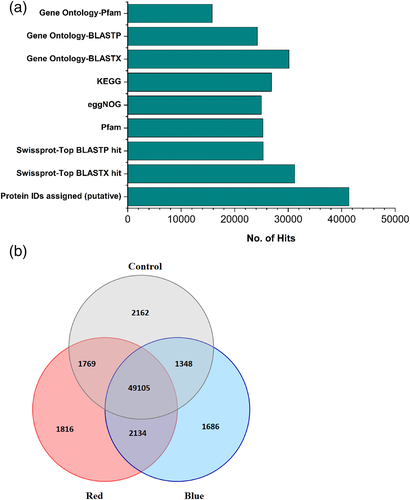
There were 49,105 commonly co-expressed genes detected among the transcriptomes of the three different light treatments (Figure 3b). The distribution between the different light treatments is visualized in a venn diagram showing that 1,816 and 1,686 genes were uniquely expressed among the red and blue light treatments, respectively (Figure 3b). The BLAST sequence similarity distribution within the query sequences (E-value cut-off 1.0−5) showed high number of positives to that of aligned reads length in the range of 70–90% suggesting a strong match between query and assembled known sequences from databases (Figure S4).
3.3 Differential expression analysis between light treatments and enrichment (GO, KEGG) analysis
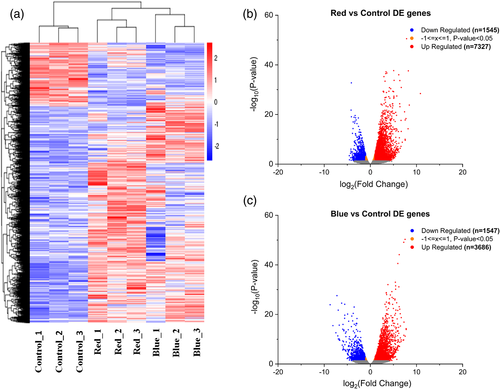
The gene expression levels quantified from the read counts generated from the transcriptomes showed 14,105 DEGs. The fragments per kilobase of transcript per million mapped reads (FPKM) counts (fragments per kilobase of transcript per million mapped reads) were aggregated from three replicates of each light treatment (Figures S5 and S6). Hierarchical clustering analysis showed clear differences in the expression patterns between the light treatments (Figure 4a). In red light-treated berries, high number of DEGs corresponding to 7,327 up-regulated genes and 1,545 down-regulated genes (Figure 4b) were detected when compared with blue light treatment yielding 3,686 up-regulated and 1,547 down-regulated genes (Figure 4c) as visualized using volcano plots.
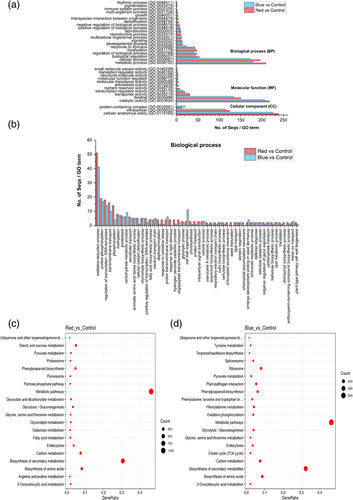
GO enrichment analysis classified the DEGs according to their functions and properties into three major categories: biological process (BP), molecular function (MF) and cellular component (CC) (Figure 5a). An average of 60–65% of unigenes was assigned GO terms either through one of the homology searches from Pfam, BLASTx and BLASTp databases. The top significantly enriched GO terms across these three categories from our two comparison subsets showed that in CC, ‘intracellular’ and ‘cellular anatomical entity’ were the top sub-categories (Figure 5a). In the MF category ‘catalytic activity’, ‘binding’ and ‘transporter’ activities were found to be abundant (Figure 5a). Both these categories have similar number of GO terms assigned from the sequences but with two contrasting results. In the BP category, the sequences assigned to ‘metabolic’ and ‘cellular’ process were relatively higher in red light than blue light treatment. The GO terms assigned to ‘localization’, ‘signalling’ and ‘response to stimulus’ sub-categories were contrasting between the light treatments (Figure 5a). Some of the unigenes were also classified in ‘rhythmic processes’ and ‘pigmentation’ in the BP category. Hence, we further investigated the BP category by direct count of sequence distribution among the top DEGs. GO terms, such as ‘oxidation–reduction process’, ‘protein phosphorylation’ and ‘regulation of transcription’, were the top ones with relatively higher number of assigned sequences found in red light-treated samples than blue light treatment. Some annotated sequences related to sugar metabolism, shikimate, chorismate, lignin, cutin and sterol biosynthetic process were also determined with additional GO terms assigned to anthocyanin-containing compounds, and flavonoid biosynthetic process was obtained from red light treatment (Figure 5b). The KEGG pathways significantly enriched by adjusting FDR corrected/p-value to <.05 using the Benjamini–Hochberg method showed that a high number of gene ratio fell in both light treatments on metabolic pathways and secondary metabolite biosynthesis, followed by phenylpropanoid biosynthesis, and few primary metabolic pathways, such as amino acid biosynthesis, carbon metabolism and ribosome (blue vs. control) with considerable number of gene counts (Figure 5c,d). In addition, the red light treatment also positively enriched the fatty acid, galactose, starch and sucrose metabolism related pathways (Tables S5–S8). All the DEGs and corresponding unigene IDs analysed throughout this study are provided in Table S9.
3.4 Identification of TF families
Blast2GO suite identified GO terms and protein domain signatures from top 500 DEGs utilizing InterproScan (IPS) database. The analysis indicated that the top category was a protein kinase domain followed by MYB/SANT domain, AP2/ERF, NB-ARC and bHLH domains (Figure S7). A total of 976 unigenes were identified as putative TFs and regulators from the transcriptome categorized into 72 TF families, which are likely to have a role in red and blue light-mediated transcriptional regulation in various metabolic pathways. Among them, C2H2 was the most prominent TF family category with 117 unigenes followed by CCHC(Zn) (99 unigenes), RR-A type (42 unigenes), MYB-HB like (62 unigenes), bHLH (44 unigenes) and WD-40 like TFs (40 unigenes) (Figure S8). Some of the earlier identified TFs known to be involved in bilberry ripening (Nguyen et al., 2018), such as NAM (NAC family TFs) with 13 unigenes, WRKY TFs with 17 unigenes and MADS-like TFs with 13 unigenes, were identified as differentially expressed in response towards red and blue light treatment. Another class of TFs called AP2-EREBP (APETALA2/EF), belonging to ethylene hormone responsive TF family, was also significantly expressed among the DEGs (38 unigenes).
3.5 DEGs involved in red and blue light signalling
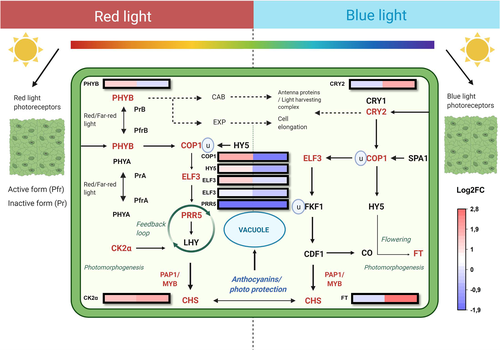
The unigenes corresponding to phytochrome B (PHYB) were found to be highly up-regulated in red light treatment, whereas cryptochrome (CRY2) transcripts were found in high levels under blue light (Figure 6). COP1 expression level was found to be higher in red light treatment with blue light down-regulating its expression. The light treatments also showed similar trends on HY5 expression, with red light increasing the expression and blue light having the opposite effect. CK2α and PRR5, which are key regulators in plant circadian rhythms, did not vary markedly in their expression levels between the red and blue light treatments. Flowering locus gene-T (FT) involved in photoperiodism was highly up-regulated (2,8 log2 FC) upon blue light treatment (Figure 6).
3.6 DEGs from anthocyanin biosynthesis and its associated regulatory complex
All the major identified unigenes involved in the phenylpropanoid pathway, such as PAL, cinnamate 4-hydroxylase (C4H) and 4-coumarate CoA ligase (4CL), were up-regulated upon both red and blue light treatments (Figure 7). Caffeoyl CoA O-methyltransferase (cCoAoMT) expression was found to be at a relatively high level in blue light compared to red light treatment also with similar expression levels identified in peroxidases and cationic peroxidases (Prx, cPrx) genes leading to lignin biosynthesis via the p-coumaryl alcohol branch pathways (Figure 7).
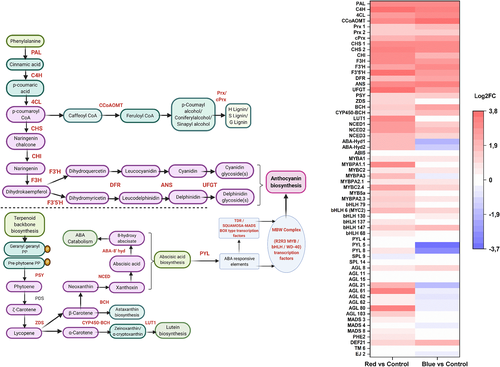
All the anthocyanin biosynthetic pathway structural genes were up-regulated both in red and blue light (Figure 7). The key biosynthetic enzyme gene CHS was found with a log2 fold increase of 3.3 and 3 between red and blue treatment, respectively. Expression of CHI and F3H was found to be at a higher level in red light treatment when compared with the blue light treatment. The changes in expression levels of F3′H, DFR and ANS genes were found to be slightly higher in blue light treatment. The key gene involved in the delphinidin branch pathway, F3′5′H, and the specific gene for anthocyanin biosynthesis, UFGT, were found to be highly up-regulated in the response towards red light (Figure 7).
R2R3 MYBs (eight unigenes) and bHLHs (six unigenes) were found among the top 500 DEGs. All the identified TFs of MBW complex from top DEGs and corresponding gene ID with IPS domains are provided in Table S9. SQUAMOSA-MADS box (TDR-type) TFs, such as AGAMOUS (AGL 15, 21, 61, 62, 80) and MADS (3,4,8), were significantly up-regulated in red light treatment and down-regulated under blue light treatment (Figure 7). In contrast, blue light up-regulated DEF2 and PHE2 type MADS box TFs and red light down-regulated SPL4 type TFs (Figure 7), which are all linked to regulating circadian rhythm and flowering. The expression level of MYBA1, the key regulatory gene of anthocyanin biosynthesis, was up-regulated by both red and blue light treatments, whereas MYBPA1.1 was found comparatively higher level in red light treatment. Among the eight R2R3 MYB genes categorized as DEGs, three genes were up-regulated in similar levels under both the light treatments (Figure 7). Instead, MYBPA1.1, MYBPA3, MYBC2.4, MYB5a and MYBPA2.3 were found to be expressed in higher levels in red light treatment compared to blue light treatment (Figure 7). All the bHLH TFs categorized under DEGs (bHLH6 [MYC2], bHLH130, bHLH137, bHLH147, bHLH68 and bHLH79) were found up-regulated in both light treatments and expressed in similar levels.
3.7 DEGs from carotenoid and ABA metabolism
The carotenoid pathway genes, such as phytoene synthase (PSY), β-carotene hydroxylase (BCH) and carotenoid β-ring hydroxylase of cytochrome P450 family (CYP450-BCH), were up-regulated in both red and blue light treatments with the exception of ζ-carotene desaturase (ZDS) and lutein deficient 1-like (Lut1) with lower expression levels in blue light treatment (Figure 7). In addition, the important carotenoid cleavage gene NCED, the key cleavage gene in ABA biosynthesis, was up-regulated in both the light treatments but higher in red light treatment (Figure 7). On the other hand, ABA-8′ hydroxylase, which is the first step in the ABA catabolism route, was highly up-regulated only under red light treatment but down-regulated (to −1.88-fold change) in blue light treatment. There were three unigenes identified as ABA-receptors pyrabactin resistance-like gene (PYL-4,5,8) of which two of them (PYL 5,8) were down-regulated to two- to three-folds lower in response to blue light (Figure 7). ABA insensitive (ABI5) TF was found in similar levels in both the light treatments.
The relative gene expression for all the key anthocyanin and ABA biosynthetic genes discussed earlier (CHS, F3'H, F3'5'H, DFR, ANS, UFGT, MYBA1, and NCED) obtained from qRT-PCR analyses (Figure S9a) and identified unigenes from RNA-seq dataset were correlated, showing the higher correlation R2 values of 0.9 with red versus control and 0.8 with blue versus control contrasts (Figure S9b).
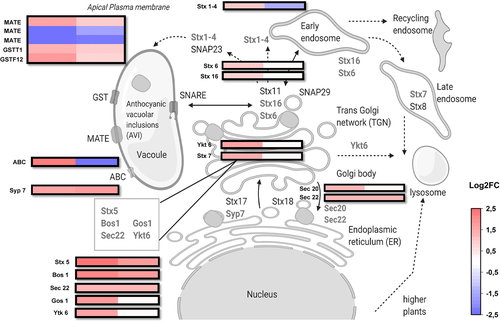
3.8 DEGs involved in vesicular trafficking
DEGs identified and annotated as group of genes related to SNARE-domain family of transporter proteins, such as Stx 5,6,7 (syntaxin), Sec 20,22 and Ykt6, were highly up-regulated in response towards the red light treatment (Figure 8). The syntaxin genes (Stx1-4), usually found in apical plasma membrane, were up-regulated in red light and down-regulated in blue light treatment. We also identified two unigenes from DEGs annotated as ABC family of transporter proteins (ATP-binding cassette sub-family B), which showed the same expression trend to syntaxin genes suggesting the involvement of ABCs in vesicular transport, possibly together with SNAREs (Figure 8). GSTs F12 and T1-like transporter genes were up-regulated by both the light treatments, whereas a single unigene out of three annotated among the top DEGs corresponding to MATE efflux transporter protein family was found up-regulated by both treatments (Figure 8).
3.9 Gene-metabolite interaction
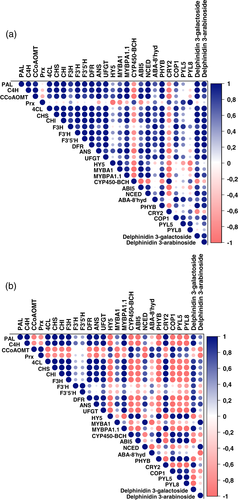
Pearson's correlation matrices between the dominantly found anthocyanins quantified using HPLC (delphinidin 3-galactoside and delphinidin 3-arabinoside) and the transcript levels related to the flavonoid, carotenoid and ABA pathway genes, and ABA-receptors from both light treatments indicated strong links between ABA and anthocyanin biosynthesis, especially under red light (Figure 9). We also found statistically significant positive correlations among gene-metabolite interactions for red light compared to blue light treatment.
4 DISCUSSION
It has been shown in many fruits that specific light spectral wavelengths from PAR spectrum can influence the biosynthesis of anthocyanins and other polyphenolic compounds (Jeong, Goto-Yamamoto, Kobayashi, & Esaka, 2004; Koyama et al., 2012; Tao et al., 2018; Kokalj et al., 2019). Beyond the PAR range spectral wavelengths, UV light can also positively regulate anthocyanin biosynthesis. Recent studies have shown that UV-B irradiation in pre-harvest and UV-A irradiation in post-harvest conditions promoted anthocyanin biosynthesis in blueberries (Li, Yamane, & Tao, 2021; Yang et al., 2018). However, the molecular mechanisms underlying the light quality-regulated fruit anthocyanin biosynthesis are not well understood. In this study, we used a comparative transcriptomics approach to analyse the effect of light quality on anthocyanin biosynthesis in ripening fruit of bilberry producing anthocyanins from both cyanidin and delphinidin branches. The light treatments were given to unripe green (S3 stage) bilberry fruits, as this stage has been shown earlier to be reactive towards changes in spectral light wavelengths affecting anthocyanin biosynthesis (Zoratti et al., 2014). Here, we showed that the anthocyanin concentration and profile in ripening berries was affected especially by red light but also blue light treatment, and our results indicate differences in light signalling pathways between red and blue light in regulation of anthocyanin biosynthesis.
4.1 Light quality modulates light signal perception and transduction
In natural conditions, plants encounter varying light spectral conditions. For example, in the latitudes close to Arctic circle, the radiation flux from a distinct solar spectrum (UV-A/B ratio, blue and red/far-red wavelengths) changes compared to southern latitudes, and this has been shown to favour higher accumulation of flavonoids in northern vegetation, including wild bilberries (Jaakola & Hohtola, 2010; Zoratti, Karppinen, et al., 2014). Delphinidins are the major class of constituting anthocyanins found abundant in northern clones compared with higher cyanidin proportions found in southern clones (Zoratti et al., 2016). In addition, in forests, the top canopy absorbs most of the essential red and blue wavelengths, and only the green and far-red wavelengths are reflected by foliage to lower parts of the plant (Holopainen et al., 2018). In bilberry, populations grown under direct sunlight have demonstrated increased bioactive compounds and bioavailability compared with plants growing under forest canopy (Eckerter, Buse, Förschler, & Pufal, 2019). However, the even distribution through the foliage can be achieved by modern energy efficient LEDs, because the irradiation maxima from these supplemental lightings are often higher than plant's absorption peaks. Our study showed that during the red light LED treatment, PHYB expression was up-regulated together with COP1 and HY5, the key genes involved in photomorphogenesis, alongside photoperiodism-related early flowering (ELF3) and CK2α genes (Figure 6). On the other hand, the blue light up-regulated cryptochrome (CRY2) but down-regulated COP1 and HY5 in tandem as its photoreactive mechanism, which might reveal that an early photomorphogenesis occurred upon light treatment as a spontaneous response but was found in low levels of expression at the time of our observation. It is also to be noted that bHLH6 (MYC2), which is a negative regulator of blue light induced photomorphogenesis (Yadav, Mallappa, Gangappa, Bhatia, & Chattopadhyay, 2005) and was positively expressed in our study, might have played a crucial role in blue light signalling mechanism.
4.2 Supplemental red and blue light irradiation positively affects anthocyanin biosynthesis and accumulation
Red and blue wavelengths have optimal chlorophyll absorption and photosynthetic efficiency (Massa, Kim, Wheeler, & Mitchell, 2008), and both appear to be effective in promoting anthocyanin biosynthesis in various horticultural crops (Bian, Yang, & Liu, 2014; Zhang et al., 2018). Our results showed that both the light treatments up-regulated all the anthocyanin biosynthetic genes in bilberry fruit, including all the bottleneck flavonoid biosynthetic genes CHS, F3H and ANS described inVaccinium fruits (Günther et al., 2020; Primetta, Karppinen, Riihinen, & Jaakola, 2015; Zorenc et al., 2017). This led to the higher accumulation of anthocyanins under both red and blue light treatments compared to control fruits. Furthermore, the expression level of UFGT, the last gene in the anthocyanin pathway, and F3'5'H, the gene directing dihydroflavonol precursors to delphinidin biosynthesis, was found to be highly up-regulated under the red light treatment. Generally, blue light has been shown as a strong positive influencer of anthocyanin accumulation in many fruit crops, for example, in sweet cherries (Kokalj et al., 2019) and pear (Tao et al., 2018). However, red light can also promote in similar ways. A recent study in strawberry showed that both red and blue light were able to increase gene expression levels of flavonoid biosynthetic pathway with red light found to be slightly more effective in inducing anthocyanin accumulation (Zhang et al., 2018). For instance, also in a previous study in apple, red light has been shown to promote anthocyanin biosynthesis (Lekkham, Srilaong, Pongprasert, & Kondo, 2016), and red-shaded nets improved phytochemical contents in few vegetables (Ilić & Fallik, 2017). Our results suggest that UFGT and F3'5'H are separately regulated and highly responsive to red light in ripening bilberry fruit. This changed the anthocyanin profile towards delphinidin glycosides in fully ripe berries under red light.
Anthocyanin biosynthesis is directly regulated by the MBW complex and R2R3 MYB expression and to some extent bHLH expression. A high number of DEGs representing MYB and bHLH genes was found from our RNA-seq libraries, indicating that their regulation is strongly influenced by the light spectral quality. MYBA-type TFs have been identified as the key regulators activating anthocyanin biosynthesis in fruits including Vaccinium berries (Die, Jones, Ogde, Ehlenfeldt, & Rowland, 2020; Plunkett et al., 2018). In addition, MYBPA1 has been suggested to have a regulatory role in anthocyanin biosynthesis based on our previous studies (Primetta et al., 2015; Günther et al., 2020; Karppinen et al., 2021). In this study, both MYBA1 and MYBPA1.1 were up-regulated by red and blue light. Especially, MYBPA1.1 was induced by red light, which has been recently suggested as one of the key genes in regulating delphinidin branch during bilberry ripening (Karppinen et al., 2021). Other bilberry MYB sequences homologous to related MYBPA2, MYB5 and MYBC2 genes were also found among top 500 DEGs, which are likely to be involved in regulatory mechanisms during ripening and flavonoid biosynthesis. Some of the bHLH sequences, which were up-regulated in both red and blue light treatments, such as bHLH79, have been previously reported in grapes towards light-induced anthocyanin biosynthesis (Ma et al., 2019). In addition, bHLH6 (MYC2) TF is reported to be commonly involved in light and ABA signalling pathways (Yadav et al., 2005).
4.3 Differences in carotenoid biosynthesis and ABA metabolism suggest red light regulation through ABA
A significant increase in the expression of the carotenoid early biosynthetic genes and late cleavage gene, including NCED, has earlier been found in bilberry fruit ripening under red light (Karppinen et al., 2016). Our results are in agreement with this study but also showed that not only the red light but also blue light treatment up-regulated expression levels of many of the carotenoid biosynthetic genes. However, the expression of ZDS and CYP450-BCH genes branching towards α-carotene and further to lutein biosynthesis (LUT1) varied between the red and blue light treatments (Figure 7). It has also been shown in the previous study that the up-regulated expression levels of carotenoid biosynthetic genes in red light conditions led to low levels of carotenoids indicating elevated carotenoid cleavage reactions (Karppinen, Zoratti, Sarala, et al., 2016) that lead to production of plant hormone ABA.
The increase in ABA levels and the carotenoid cleavage reaction through action of the key enzyme NCED was found increased at the onset of bilberry ripening (Karppinen et al., 2013). Many studies have demonstrated the exogenous application of ABA increasing the anthocyanin levels of fruits when applied at the time of fruit ripening (Ferrero et al., 2018; Wheeler, Loveys, Ford, & Davies, 2009). The effect of exogenous application of ABA on inducing bilberry fruit anthocyanin biosynthesis has been demonstrated earlier (Karppinen et al., 2018). In Fragaria × ananassa, the positive effect of ABA as well as light has been reported to act independently through the activation of FvMYB10, the key gene in strawberry anthocyanin biosynthesis (Kadomura-Ishikawa, Miyawaki, Takahashi, Masuda, & Noji, 2015). In our study, the red light treatment induced higher expression of NCED compared to control and blue light treatment. In addition, we showed that expression levels of ABA-8′ hydroxylase gene, responsible for degradation of ABA, increased two-fold higher in red light treatment and were down-regulated in blue light treatment. It has been shown that the endogenous levels of ABA in plant cells are maintained only by the inhibition of this enzyme (Kondo et al., 2012). A similar trend of increase in expression of NCED and ABA-8′ hydroxylase genes alongside higher anthocyanin accumulation in response to red light irradiation was observed earlier in grapevine (Kondo et al., 2014). Rodyoung et al. (2016) have shown that in grapes, the expression of both of these genes was higher at veraison in response to red and blue light irradiation. In many fruits, the ABA catabolism might not directly coincide with anthocyanin biosynthesis but the upstream ABA biosynthesis and endogenous levels of ABA may be directly involved in interaction with the flavonoid pathway. Here, we show that in ripening bilberry fruit, the red light activates both the biosynthetic and catabolic ABA pathways and correlates with anthocyanin accumulation. Furthermore, the changes in delphinidin levels showing a strong correlation with anthocyanin biosynthesis and direct regulatory genes, ABA signalling and metabolism genes (Figure 9) suggest a well-orchestrated regulatory network of ABA-regulated anthocyanin biosynthesis occurring under supplemental red light.
The signal transduction from ABA to the regulation of anthocyanin biosynthesis has been reported earlier in other fruit species, such as Lycium fruits, where ABA was found to interact directly with the MBW complex and other key flavonoid genes (Li et al., 2019). In our study, we showed that light treatments during ripening process activated signal transduction cascade via ABA signalling leading to anthocyanin accumulation. It has been shown in one of the recent studies that red light increased the expression level of AGAMOUS-like (AGL) regulators in tomato (Solanum lycopersicum L.) during fruit ripening (Zhang et al., 2020). These AGL-like MADS box TFs are also orthologs to VmTDR4 in bilberry, a key player in bilberry anthocyanin accumulation (Jaakola et al., 2010). This provides us with an understanding that red light might mediate ABA-regulated anthocyanin biosynthesis through SQUAMOSA-MADS box type TFs, ABA binding receptors such as pyrabactin resistance like (PYR/PYL), ABA insensitive (ABI5) gene, which all act as upstream regulators towards activating the MBW complex. A similar ABA signal transduction mechanism occurs via MADS box TFs was previously demonstrated in blueberry anthocyanin biosynthesis (Chung et al., 2019). It should also be noted that the SPL type TFs (SQUAMOSA promoter binding like) that were up-regulated in response to blue light in our study can be associated with the increase in expression of Flowering Locus-T (FT) gene involved in flowering and circadian clock-related mechanisms as the TF acts downstream to FT expression (Wang, Czech, & Weigel, 2009).
4.4 Supplemental light triggers vesicular trafficking in ripening berry accumulating anthocyanins
The transportation of anthocyanins into vacuoles is usually trafficked intra-cellularly by different classes of transporter proteins, such as MATEs, ABCs and GSTs (Petrussa et al., 2013). The transporters involved in fruit anthocyanin transport in relation to light quality response have not been studied. However, our results demonstrated that a set of genes, including Stx, Bos1, Gos1, Ykt6, Sec20, Sec 22 and Syp7, were highly up-regulated in response to red light treatment. These genes belonged to the SNARE-domain protein family, which includes the common syntaxin-like (Stx, Syp) genes. Interestingly, the unigenes annotated as Stx-like (1,4) type along with an ABC transporter were up-regulated in response to red light treatment and reacted in the opposite manner to that of blue light treatment. Hence, SNARE domain transporters are candidates to be involved in vesicular trafficking of anthocyanins or trans-membrane transport from endoplasmic reticulum (ER) to golgi and endosomes. It also indicates the potential role of syntaxin genes differentially responding to light-induced anthocyanin transport mechanisms. These different types of SNAREs, barring the ER-localized Syp and Sec, are usually localized in endosomes and in trans-golgi network (Kim & Brandizzi, 2012). Our results may indicate a new route for anthocyanin sequestration and transportation in fruit tissues. The proposed vesicular trafficking model of anthocyanins in fruits might be also co-regulated by other GSTs, MATE efflux transporters and ABC transporters, in addition to the SNARE-domain type proteins before depositing as anthocyanic vacuolar inclusions (AVI) in the vacuole (Zhao, 2015). This mechanism could also relate to the plant tissues that accumulate higher anthocyanin levels under high intensity light and needs to be investigated further.
5 CONCLUSION
Our RNA-seq analyses from the time of fruit ripening show that both red and blue wavelengths are capable of inducing a high number of up-regulated genes and metabolic pathways, including flavonoid, phenylpropanoid, carotenoid biosynthetic pathways and sugar metabolism. Blue and especially red light were effective in inducing anthocyanin and delphinidin accumulation but through different signal transduction routes. The blue light triggered early photomorphogenesis via CRY2/COP1 interaction that potentially combined with positive regulators, such as MYBA and HY5, to induce the expression of anthocyanin biosynthetic genes during onset of ripening. Red light treatment instead positively up-regulated PHYB and all the major flavonoid genes, including the anthocyanin (UFGT) and delphinidin (F3'5'H) routes, key ABA biosynthetic gene (NCED) and ABA degrading ABA-8'hydroxylase genes. Our results provide an insight into the role of endogenous ABA accumulation and degradation as positive signalling factors leading to increased levels of anthocyanin accumulation via the ABA-signal transduction mechanism during the ripening process under red light. We also found the expression of SNARE complex-related vesicle trafficking genes to be highly expressed in red light treated berries, which might provide clues into the possible sequestration and transport mechanisms via endosomes in tissues with higher anthocyanin accumulation, but need further investigation. Our high-quality transcriptome dataset will be a useful genomics resource in future bilberry research and Vaccinium breeding programmes.
ACKNOWLEDGMENTS
The authors would like to thank Leidulf Lund for the help in setting up light experiments at the Phytotron facility at UiT The Arctic University of Norway. We are grateful for the UiT-BFE faculty's mobility grant to AS allowing the visit to Plant and Food Research, New Zealand. The research mobility was supported by the New Zealand Ministry for Business, Innovation and Employment (MBIE) Endeavour programme ‘Filling the Void: boosting the nutritional content of NZ fruit’ (contract C11X1704). The work was also financially supported by NordPlant (NordForsk grant no. 84597).
CONFLICT OF INTEREST
The authors declare that they have no conflict of interest.
AUTHOR CONTRIBUTIONS
L.J. conceptualized the project and along with K.K., I.M. and A.S. designed the experiment. A.S. performed the experiments, analysed the data and wrote the manuscript. D.J. contributed in RNA-seq bioinformatics pipeline and analysis. A.P.D. contributed with the HPLC analysis of anthocyanins. N.S. performed metabolic profiling with LC–MS. L.J., K.K., I.M. and R.V.E. contributed in the editing and proofreading of the manuscript draft. All authors have read and approved the manuscript.
Open Research
DATA AVAILABILITY STATEMENT
The data that support the findings of this study are openly available in NCBI-SRA database at http://www.ncbi.nlm.nih.gov/bioproject/747684, reference number [PRJNA747684].


