Different response modes and cooperation modulations of blue-light receptors in photomorphogenesis
Funding information: 111 Project, Grant/Award Number: B16029; China Postdoctoral Science Foundation, Grant/Award Number: 2016M602071; National Natural Science Foundation of China, Grant/Award Numbers: 11704318, 11874310, 12090052
Abstract
Cryptochromes photoreceptors, CRY1 and CRY2 in Arabidopsis, mediate blue light responses in plants and metazoa. The signalling interactions underlying photomorphogenesis of cryptochromes action have been extensively studied in experiment, expecting a systematical analysis of the dynamic mechanisms of photosensory signalling network from a global view. In this study, we developed a signalling network model to quantitatively investigate the different response modes and cooperation modulations on photomorphogenesis for CRY1 and CRY2 under blue light. The model shows that the different modes of time-dependent and fluence-rate-dependent phosphorylations for CRY1 and CRY2 are originated from their different phosphorylation rates and degradation rates. Our study indicates that, due to the strong association between blue-light inhibitor of cryptochromes (BIC) and CRY2, BIC negatively modulates CRY2 phosphorylation, which was confirmed by our experiment. The experiment also validated the model prediction that the time-dependent BIC-CRY1 and the fluence-rate-dependent BIC-CRY2 are both bell-shaped under blue light. Importantly, the model proposes that the COP1-SPA abundance can strongly inhibit the phosphorylation response of CRY2, resulting in the positive regulation of CRY2 phosphorylation by CRY1 through COP1-SPA. The model also predicts that the CRY1-HY5 axis, rather than CRY2-HY5 pathway, plays a dominant role in blue-light-dependent photomorphogenesis.
1 INTRODUCTION
Light, as a source of energy and deliverer of information, is an important factor for plant life. Different durations, intensities (fluence rates) and qualities (wavelengths) of light are monitored by multiple photoreceptors (Ahmad & Cashmore, 1993; Cashmore, 1997; Mathews & Sharrock, 1997; Wu et al., 2012). Two cryptochromes, CRY1 and CRY2, act as major blue-light photoreceptors in Arabidopsis thaliana to mediate significant light responses, such as seedling photomorphogenesis (Ahmad & Cashmore, 1993), light entrainment of circadian clock (Somers, Devlin, & Kay, 1998), flowering time (Bagnall, King, & Hangarter, 1996; Guo, Yang, Mockler, & Lin, 1998) and so on (Liu, Liu, Zhao, Pepper, & Lin, 2011).
CRY1 primarily regulates de-etiolation response and photomorphogenesis, while CRY2 predominantly controls photoperiodic initiation of flowering response (Bagnall et al., 1996; Guo et al., 1998; Mockler et al., 2003) and also mediates hypocotyl and cotyledon responses under the low blue light (Lin et al., 1998). Therefore, as two types of blue light receptors, CRY1 and CRY2 have distinct but partially overlapping functions in the regulation of photomorphogenesis with respect to hypocotyl growth inhibition and cotyledon expansion (Liu et al., 2016).
Different functions modulated by CRY1 and CRY2 are caused by their different responses (Lin, Ahmad, & Cashmore, 1996; Lin, Ahmad, Gordon, & Cashmore, 1995; Lin et al., 1998), although CRY1 and CRY2 have similar signalling pathways to respond to the blue light irradiation. Especially, the blue-light-dependent phosphorylation of CRYs is a common light response, which is necessary for different functions of CRYs (Shalitin et al., 2002; Shalitin, Yu, Maymon, Mockler, & Lin, 2003). For example, the phosphorylated CRY1 level is positively correlated with the inhibition of hypocotyl elongation (Koornneef, Rolff, & Spruit, 1980; Shalitin et al., 2003), while the phosphorylation of CRY2 may affect the function of phytochromes-cryptochromes coaction, regulation of the circadian clock and histone modification (Su et al., 2017; Wang et al., 2015; Wang et al., 2018).
The different modulation functions of CRY1 and CRY2 are specifically related to their different photoequilibriums between phosphorylation and unphosphorylation. In detail, the relative level of phosphorylated CRY1, which is defined as the ratio of the CRY1 phosphorylation level to the CRY1 unphosphorylation level, increases in response to either the increased exposure time or the increased fluence rate of blue light (Shalitin et al., 2003). However, such monotonically increasing features for CRY1 are in contrast to the bell-shaped responses for CRY2, for which the relative phosphorylation level increases first in response to the initial exposed time or to the low fluence rate, but then decreases at prolonged time or at high fluence rate (Shalitin et al., 2002; Wang et al., 2016). The special blue-light-dependent degradation of phosphorylated CRY2 was suggested as an explanation for the bell-shaped response curves of phosphorylated CRY2 (Shalitin et al., 2002, 2003). Yet, the detailed mechanisms for the bell-shaped curves for CRY2 are still unclear.
Besides the similar signalling pathways in response to blue light, experiments also indicated that CRY1- and CRY2-mediated signalling pathways are both coupled by two proteins, the blue-light inhibitor cryptochromes (BIC) and the constitutively photomorphogenic 1-suppressor of PHYA (COP1-SPA). Known as an on–off switch, BIC blocks all the light-regulated subsequent signalling events, such as homo-oligomerization, phosphorylation and degradation by associating with CRYs (Fankhauser & Ulm, 2016; Wang et al., 2016). But different to the UVB-induced UVR8-RUPs system (Heijde & Ulm, 2013; Ouyang et al., 2014), BIC cannot facilitate the return to ground state of CRY. Differently, COP1/SPA, linked in proteasomal degradation of key photomorphogenesis-promoting factors HY5 (Chen et al., 2006), can associate with CRY1 and CRY2 to inactivate COP1-SPA complex (Liu, Zuo, Liu, Liu, & Lin, 2011; Zuo, Liu, Liu, Liu, & Lin, 2011), inducing the expression of BIC protein (Wang et al., 2017). Thus, it is important to understand how BIC and COP1-SPA regulate CRY1 and CRY2 signalling pathways differently to achieve different responses to blue light.
Mathematical modelling has been widely used in the research of cellular signalling network to dissect the complex dynamics for new insights on the underlying mechanisms (Hennig, Buche, & Schafer, 2000; Li, Zhong, Wu, et al., 2020; Li, Zhong, Yin, et al., 2021; Li, Wu, Gao, Cai, & Shuai, 2018; Ouyang et al., 2014; Qi et al., 2018; Rausenberger et al., 2011). In order to quantitatively discuss the detailed modulation mechanisms of CRY signalling pathways, taking into account the various biochemical experiments in a systematical way, we developed a signalling network model, for the first time, to describe the cooperation mechanisms of CRY1 and CRY2 which are both coupled with BIC and COP1-SPA. With the model, we discussed systematically the mechanisms of different time-dependent and fluence-rate-dependent bell-shaped response modes of phosphorylated CRY1/2, the cooperation modulations of CRY1 and CRY2 by the various proteins in the signalling networks, and the different regulations of HY5 by CRY1 and CRY2.
2 METHODS
2.1 Experimental methods
Seven-day-old GFP-BIC1 overexpression plants were grown in the dark, and then were exposed to 30 μmol/m2/s blue light for indicated time (0.17–30 min) or different fluence-rates of blue light (1–200 μmol/m2/s) for 1 min. Tissues were collected and GFP-trap beads were used for immunoprecipitation. The detail procedures and western blot analysis were performed as previously described (Liu et al., 2020).
For CRY2 phosphorylation analysis in human embryo kidney cells (HEK293), the detailed transfection of HEK293 cells was described previously (Liu et al., 2017). Briefly, Myc-CRY2, HA-PPK1 and different dosages of GFP-BIC1 plasmids were co-transfected into HEK293 cells. About 40 hrs after transfection, cells were exposed to blue light of 100 μmol/m2/s for 2 hrs. Then the cells were killed by lysis buffer, and the supernatants were used for western blot analysis.
2.2 Simulation methods
Based on experiments, a blue-light-induced signalling network model was proposed, in which CRY1 and CRY2 mediate similar photochemical transduction pathways, as shown in Figure 1.
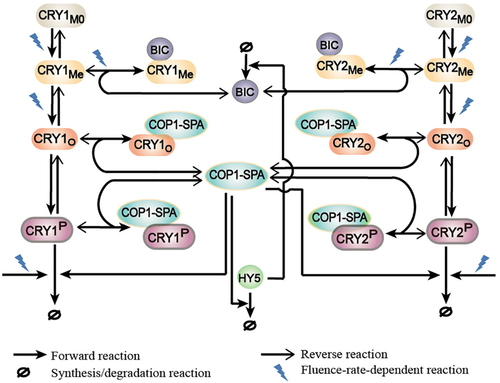
According to experiments, we took into account two configuration states of CRYs: the unphosphorylated states CRY (including the ground state CRYM0 the primary photoexcited state CRYMe and the unphosphorylated homo-oligomeric state CRYO) and the phosphorylated states CRYP. Thus, the four photochemical signalling modules were considered in the network: the primary photoexcitation of ground state by photocycle (from CRYM0 to CRYMe) (Gao et al., 2015; Li et al., 2011; Liu, Liu, Zhong, & Lin, 2010), the homo-oligomerization of photoexcited CRYMe (from CRYMe to CRYO) (Rosenfeldt, Viana, Mootz, von Arnim, & Batschauer, 2008; Sang et al., 2005; Wang et al., 2016), the phosphorylation of homo-oligomeric CRYO (from CRYO to CRYP) and the degradation of phosphorylated CRY (Liu et al., 2016; Shalitin et al., 2002, 2003). For simplicity, the homo-oligomerization of CRY is represented by homo-dimerization in our model. It has been verified that the primary photoexcitation, homo-dimerization and the degradation of photoreceptors are all light-intensity-dependent processes.
In addition to the photochemical transduction, CRYs also associate with diverse proteins, including BIC and COP1-SPA. BIC1 and BIC2 proteins associate with the activated CRY monomer CRYMe to prevent the homo-oligomerization of CRY (Wang et al., 2016). Because BIC1 and BIC2 share similar regulatory function, these two proteins are represented together by a single protein BIC to keep the model simple.
In dark, COP1-SPA complex, as an E3 ubiquitin ligase complex, targets for the degradation of the photomorphogenesis-promoting transcription factor HY5 and thus inhibits the photomorphogenic responses (Osterlund, Hardtke, Wei, & Deng, 2000). In response to blue light irradiation, CRY homo-dimer weakens the activation of COP1-SPA complex through interacting with either COP1 or SPA protein to form COP1-CRY or SPA-CRY complex (Lian et al., 2011; Liu, Zuo, et al., 2011; Zuo et al., 2011). Besides, it was reported that CUL4-based COP1-SPA E3 ligase acts as a promoter of CRY2 degradation (Liu, Wang, et al., 2016). For simplicity, COP1-SPA complex is considered in the model to represent the functions of SPA, COP1 and COP1-SPA and it is treated as an active complex to degrade CRYs. Therefore, in the model the degradation of phosphorylated CRYs are regulated not only by the blue light but also by the COP1-SPA complex. Besides, the transcriptional regulation is included with the accumulation of HY5. The binding of abundant HY5 protein to BIC-gene promoter activates the transcription and expression of the negative regulator BIC in response to blue light (Wang et al., 2017).
As a result, all reaction processes of the model and the dynamics of concentrations of proteins are described in Table S1 and Eq. (S1-17) (Supporting information: 1. Model equations), respectively.
3 RESULTS
3.1 Parameter estimation based on experimental data
All model parameters were determined by a global fitting to experimental data (Shalitin et al., 2002, 2003; Wang et al., 2016; Yu et al., 2007) (see Supporting information: 2. Fitting of the model parameters for detail, in which Tables S2-3 contains the optimal rate constants of the model, and the curves of the fluence-rate-dependent parameters in the model are shown in Figure S1). The time-dependent and fluence-rate-dependent curves of the relative levels of the phosphorylated CRY1 and CRY2 are plotted in Figure 2a (with the experimental data extracted from Figure 3a,b in (Wang et al., 2016)) and Figure 2b (with the experimental data extracted from Figure 2c in (Shalitin et al., 2002) and Figure 1b in (Shalitin et al., 2003)), respectively. Figure 2c shows the relative levels of the phosphorylated CRY1 and CRY2 with respect to irradiation time and with varying fluence rates from 0 to 100 μmol/m2/s of blue light. Fitting well with the experimental data, the model shows that the time-dependent and fluence-rate-dependent relative levels of phosphorylated CRY1 are monotonically increasing curves; while they appear as the bell-shaped curves for CRY2 (Figure 2a,b).
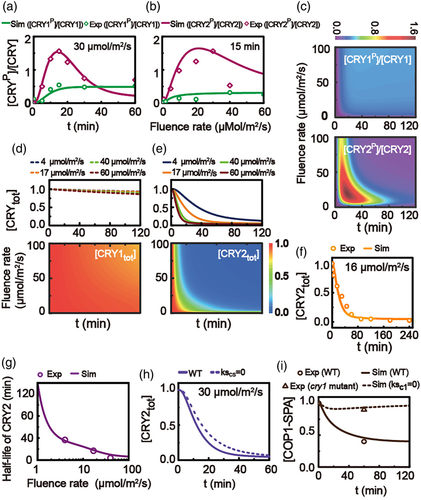
Experimental results also showed that CRY1 is light-stable and CRY2 is light-labile (Shalitin et al., 2003; Yu et al., 2007). Similarly, the model indicates that CRY1 level barely decreases with the continuous blue light treatment no matter how strong the light is (Figure 2d), while a strong blue light leads to a strengthened degradation for CRY2 (Figure 2e). The degradation kinetics of CRY2 under a constant blue light of 16 μmol/m2/s observed in experiment are also fitted well by the simulation (Figure 2f, with the experimental data extracted from Figure 3a in [Yu et al., 2007]). Similar as observed in experiment, the model also shows that the half-life of CRY2 is reduced with the increased fluence rate of blue light (Figure 2g, with the experimental data extracted from Figure 3b in [Yu et al., 2007]).
Furthermore, simulation results with the knock-out of COP1-SPA (i.e., ksCS = 0 as cop1-spa mutant) (Figure 2h) consistent with the experimental observation that there are decrease of CRY2 degradation in cop1 or spa mutant (Liu, Wang, et al., 2016; Shalitin et al., 2002). However, the simple consideration in our model that the various reactions of COP1, SPA and COP1-SPA complex are simply represented by the reactions of COP1-SPA complex leads to an imperfect result, which is maybe a major factor to produce a small difference in measure of CRY2 total between WT and cop1-spa mutant in Figure 2h. Besides, the COP1-SPA interaction was decreased to ~40% in wild-type strain in experiment and only to ~90% in the cry1 mutant seedlings, respectively, at 60 min of blue-light irradiation of 50 μmol/m2/s (Liu, Zuo, et al., 2011). We use the level of the active COP1-SPA complex in our model to represent the COP1-SPA interaction in experiment. As a fitting result under the same condition, our model shows that the level of COP1-SPA is inhibited to ~45% in wild-type model and only to ~90% in the mutant model with the knock-out of CRY1 (i.e., ksc1 = 0 as cry1 mutant), respectively (Figure 2i, with the experimental data extracted from Figure 4c in (Liu, Zuo, et al., 2011)).
3.2 The five different reactions between CRY1 and CRY2 pathways
Considering that CRY1 and CRY2 have similar signalling pathways to respond to the blue light, we tried in our fitting process to keep more reaction rates the same for the similar reactions in CRY1 and CRY2 pathways. As a result, our model suggests that there are five different reaction processes between CRY1 and CRY2 pathways (Table S3), including that the light-dependent association process between CRY1 and BIC is slower than that between CRY2 and BIC (Figure S1c); the dissociation process of BIC-CRY1 is faster than that of BIC-CRY2; the phosphorylation process of CRY1 is slower than that of CRY2; the fluence-rate-dependent degradation of the phosphorylated CRY1 is slower than that of the phosphorylated CRY2 (Figure S1d), and the COP1-SPA-dependent degradation of the phosphorylated CRY1 is slower than that of the phosphorylated CRY2 (Figure S1e). Except the above parameters, all the other reaction rates in CRY1 signalling pathway in the model equal correspondingly to those in CRY2 signalling pathway. As a result, our model indicates that the different dynamics of CRY1 and CRY2 responding to blue light are fundamentally caused by above five different processes.
3.3 A stronger association for BIC with CRY2 than with CRY1
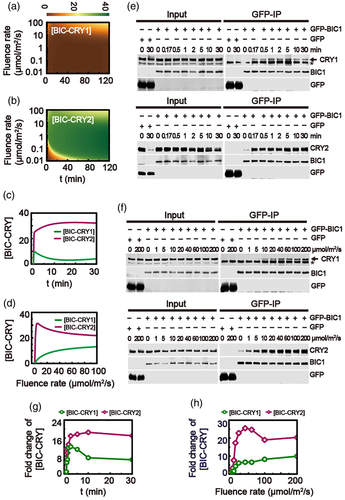
Experiments showed that the CRY-BIC association plays a key role in CRY phosphorylation. The previous study has shown that BIC1/2 interacts with CRY2 to inhibit CRY2 oligomerization/activation (Wang et al., 2016). Based on Table S3, the association rate of BIC with CRY1 enhanced with the increasing fluence rate, while the association of BIC with CRY2 is almost fluence-rate-independent in blue light (>5 μmol/m2/s) (Figure S1c). Furthermore, the association of BIC with CRY2 is always stronger than that of BIC with CRY1 at any fluence rate. As a result, the amount of BIC-CRY1 is always smaller than that of BIC-CRY2 no matter how strong the fluence rate of blue light is (Figure 3a–d). The weak association of BIC and CRY1 causes that more CRY1 dimer is formed to associate with COP1-SPA (Figure S2).
Interestingly, the model predicts that the amount of BIC-CRY1 with time presents a bell-shaped pattern, while the amount of BIC-CRY2 monotonically increases (Figure 3c). On the contrary, the amount of BIC-CRY1 monotonically increases with the fluence rate of blue light, while the fluence-rate-dependent BIC-CRY2 shows a bell-shaped response (Figure 3d).
In order to confirm the modelling study of the association kinetics of BIC-CRY in response to blue light, the transgenic plants grew in darkness with the overexpressing GFP-BIC1 and GFP-BIC2 were either treated with different period (0 to 30 min) of 30 μmol/m2/s blue light (Figure 3e) or different fluence of blue light (0 to 200 μmol/m2/s) for 1 min (Figure 3f), and then tissues were collected and coimmunoprecipitation was performed to analyse BIC-CRY association (Figure 3e,f). Consistent with our model prediction, less association of BIC with CRY1 was always observed under blue light. Furthermore, as suggested by the model, the time-dependent BIC-CRY1 and the fluence-rate-dependent BIC-CRY2 are both bell-shaped response (Figure 3g,h).
3.4 Strong inhibition of CRY2 phosphorylation by BIC
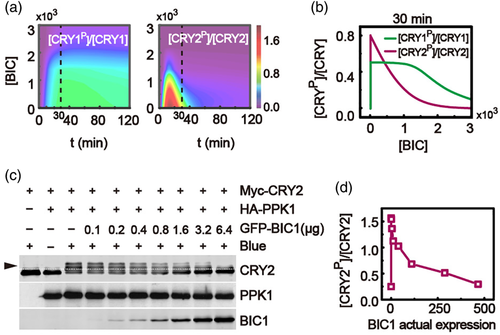
The effects of BIC abundance on the relative levels of phosphorylated CRY1 and CRY2 were simulated with the model. Figure 4a shows that the increasing dose of BIC expression can inhibit both the CRY1 and CRY2 phosphorylation. Note that the relative levels of phosphorylated CRY1 and CRY2 are closed to 0 when BIC is knocked out (i.e., [BIC] = 0) at dark condition. However, the relative levels of phosphorylated CRY1 and CRY2 are abruptly increased when the condition is transferred from dark to blue light (Figure 4b). Compared to the response of the phosphorylated CRY1 (Figure 4b, green line), the relative level of phosphorylated CRY2 is markedly inhibited with the increased expression of BIC (Figure 4b, purple line). Therefore, the model predicts that BIC mainly inhibits CRY2 phosphorylation due to the strong association of BIC with CRY2.
In order to test such a prediction, the BIC inhibition of CRY2 phosphorylation was studied in HEK293T cells (Figure 4c). Myc-CRY2, HA-PPK1 and different dosages of GFP-BIC1 plasmids were co-transfected into HEK293 cells. And then the cells were treated with 100 μmol/m2/s of blue light for 2 hrs. Proteins were extracted and evaluated by western blots. The relative level of phosphorylated CRY2 in the absence of BIC was about 3.5-fold of that in the dark and the phosphorylation of CRY2 was rapidly repressed while BIC increased (Figure 4d).
3.5 Time-dependent bell-shaped response of CRY2 phosphorylation caused by fast phosphorylation and strong degradation of CRY2
The bell-shaped curves of the relative level of phosphorylated CRY2 have been suggested to associate with the strong CRY2 instability under blue light (Shalitin et al., 2002; Yu et al., 2007). Considering the five different processes between signalling pathways of CRY1 and CRY2 (Table S3), we analysed the responding curves of the relative level of phosphorylated CRY2 with the mutant strain models by replacing the five processes of CRY2 with the corresponding processes of CRY1, respectively. In detail, we discussed the following mutant conditions individually (Figure 5a): condition A with  =
=  for the association process between BIC and CRY2, condition B with B1C2 = B1C1 for the disassociation process between BIC and CRY2, condition C with KpC2 = KpC1 for the phosphorylation rate of CRY2, condition D with kdrcp2 = kdrcp1 for the COP1-SPA-dependent degradation of phosphorylated CRY2, and condition E with Fdrcp2 = Fdrcp1 for the fluence-rate-dependent degradation of phosphorylated CRY2.
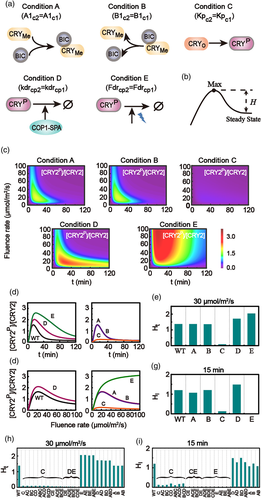
As a result, we discuss how these mutant conditions modulate the bell-shaped response of phosphorylated CRY2 with time or fluence rate. In the paper we defined the surge height H, the difference between the peak value and the final steady state of the relative level of phosphorylated CRY (Figure 5b), to describe the responding strength of the bell-shaped curve, including the height Ht for time-dependent curve and the height HI for influence-rate-dependent curve. Thus, a monotonically increasing response is with H = 0; while a bell-shaped curve gives H > 0.
The relative levels of the phosphorylated CRY2 were calculated with respect to irradiation time and with varying fluence rate of blue light under these five conditions, respectively (Figure 5c). In detail, the time-dependent curves of the relative level of phosphorylated CRY2 and the corresponding surge heights Ht are plotted for condition A, B, C, D and E in Figure 5d,e, respectively. CRY2 typically presents a time-dependent bell-shaped curve when the association or disassociation process between BIC and CRY2 (condition A or B), or the degradations of phosphorylated CRY2 (condition D or E) becomes the same as that of CRY1, respectively. However, with condition C that the phosphorylation rate of CRY2 is the same as that of CRY1, the time-dependent bell-shaped response becomes barely observed for CRY2.
The surge heights Ht for time-dependent response under different combinational conditions of A, B, C, D and E were calculated, as shown in Figure 5H. Besides with condition C, one could not observe the time-dependent bell-shaped response for CRY2 with combined condition D & E, as well as those combinational processes combined with condition C or condition D & E. As a result, the major factors to generate the time-dependent bell-shaped response for CRY2 are the fast phosphorylation process of CRY2 (condition C) and the strong degradation process of CRY2 (the combinational condition D & E, including both the COP1-SPA-dependent degradation and the fluence-rate-dependent degradation).
3.6 Fluence-rate-dependent bell-shaped response of CRY2 phosphorylation caused by fast phosphorylation and strong fluence-rate-increased degradation of CRY2
The fluence-rate-dependent curves of the relative level of phosphorylated CRY2 and the corresponding surge heights HI are shown for condition A, B, C, D and E in Figure 5f,g, respectively. Either replacing the phosphorylation rate of CRY2 by that of CRY1 (condition C), or replacing the fluence-rate-dependent degradation progress of CRY2 by that of CRY1 (condition E), the relative level of the phosphorylated CRY2 becomes monotonically accumulated with the increase of fluence rate of blue light at fixed irradiation time.
The surge heights HI for fluence-rate-dependent response of CRY2 under different combinational conditions of A, B, C, D and E are plotted in Figure 5i. One can see that, besides with condition C or E, all those combinational processes combined with condition C or E can cause the disappear of the bell-shaped curve for fluence-rate-dependent response of CRY2. As a result, the major factors to generate the fluence-rate-dependent bell-shaped response for CRY2 are the fast phosphorylation process of CRY2 (condition C) and the strong fluence-rate-increased degradation process of CRY2 (condition E).
3.7 Monotonical response of surge heights for both time-dependent and fluence-rate-dependent curve of CRY2 with varying phosphorylation rate of CRY2
Furthermore, we investigated in detail how the phosphorylation process of CRY2 (with phosphorylation rate Kpc2) affects the phosphorylation response of CRY2. The time-dependent relative levels of the phosphorylated CRY2 with different phosphorylation rate (Kpc2) of CRY2 are given in Figure 6a,b, as well as the corresponding surge heights Ht with varying phosphorylation rate of CRY2 in Figure 6c.
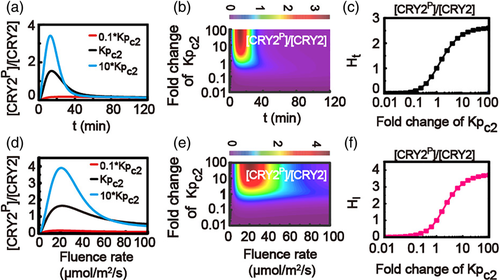
Similarly, the fluence-rate-dependent relative levels of phosphorylated CRY2 with different phosphorylation rates are plotted in Figure 6d,e, as well as the corresponding surge heights HI with varying phosphorylation rate of CRY2 in Figure 6f. These results indicate that a fast phosphorylation rate of CRY2 simply causes an increased surge height Ht for time-dependent response and an increased surge height HI for fluence-rate-dependent response of phosphorylated CRY2.
3.8 Biphasic response of surge height for fluence-rate-dependent curve of CRY2 with varying fluence-rate-dependent degradation rate of CRY2
Similar investigations were carried out to discuss the effects of the fluence-rate-dependent degradation process of CRY2 on the phosphorylation response of CRY2 (Figure 7a–f). The time-dependent relative levels of phosphorylated CRY2 at different degradation rate (Fdrcp2) of CRY2 are given in Figure 7a,b, as well as the corresponding surge heights Ht with varying degradation rate of CRY2 in Figure 7c. Clearly, a high fluence-rate-dependent degradation rate of CRY2 directly leads to a low surge height Ht for time-dependent relative level of phosphorylated CRY2 (Figure 7c).
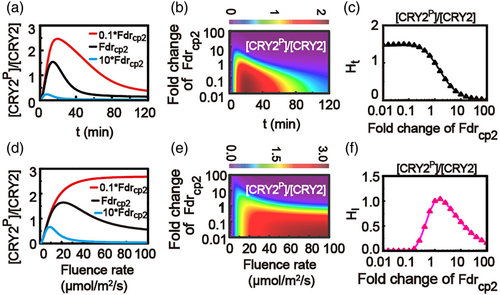
Interestingly, with varying fluence-rate-dependent degradation rate of CRY2, a biphasic behaviour of surge height HI for fluence-rate-dependent curve of CRY2 is observed in the model (Figure 7d–f). With a weak fluence-rate-dependent degradation rate of CRY2, the relative level of the phosphorylated CRY2 monotonically increases, saturating at a high level of the final steady state, resulting in the surge height HI = 0 (red line in Figure 7d). With an increasing fluence-rate-dependent degradation rate of CRY2, the relative level increases with a high peak and a decreasing level of the final steady state, generating an increased surge height HI (black line in Figure 7d). While, with a strong fluence-rate-dependent degradation rate of CRY2, the relative level gives a decreased peak with an almost fixed final steady state, causing a decreased surge height HI (blue line in Figure 7d). As a result, the model predicts an interesting behaviour that a nonlinear biphasic response will occur for the surge height of the fluence-rate-dependent relative level of phosphorylated CRY2, as shown in Figure 7f.
3.9 Negative modulation of COP1-SPA on CRY2 phosphorylation
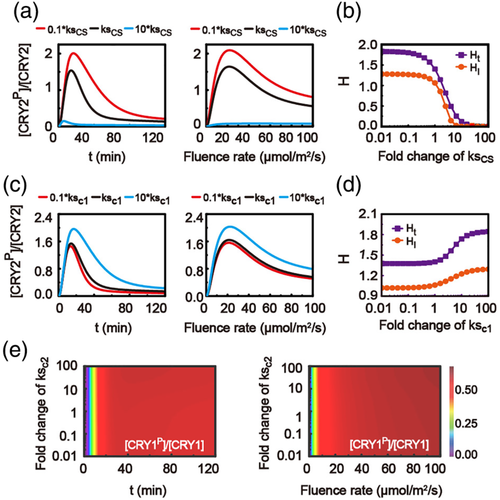
In our model, the CRY1 and CRY2 signalling pathways are similar and cooperatively coupled to each other through COP1-SPA complex. The effects of synthesis process of COP1-SPA on CRY1/2 phosphorylation were discussed with the model. Figures 8a,b and S3 show the time-dependent and fluence-rate-dependent relative levels of the phosphorylated CRY2, as well as the corresponding surge heights, with different synthesizing rate of COP1-SPA. A small synthesizing rate of COP1-SPA causes an increased surge height for both time-dependent and fluence-rate-dependent relative levels of phosphorylated CRY2 (Figure 8b), revealing a negative modulation of COP1-SPA on the relative level of phosphorylated CRY2. The fast synthesis process of COP1-SPA can induce the time-dependent surge of the relative level of phosphorylated CRY1, while it could not generate fluence-rate-dependent surge of the relative level of phosphorylated CRY1 (Figure S3b).
3.10 Positive modulation of CRY1 on CRY2 phosphorylation through COP1-SPA complex
Furthermore, we discussed the effects of synthesis processes of CRY2 and CRY1 on the relative levels of phosphorylated CRY1 and CRY2, respectively. The model predicts that varying the synthesis rate of CRY1 (ksc1) influences strongly the CRY2 phosphorylation (Figures S3c and 8c,d). However, different synthesis rates of CRY2 (ksc2) typically generate almost the same time-dependent or fluence-rate-dependent responses of the relative levels of phosphorylated CRY1 (Figure 8e). As a result, the CRY2 phosphorylation process is positively mediated by CRY1 through COP1-SPA complex.
3.11 Sensitivity of HY5 to CRY1, rather than CRY2
The cooperation modulations of HY5 by CRY proteins were also studied with the model. The dynamics of HY5 with the increasing fluence rate for WT, cry2 mutant (CRY2-knockout, ksc2 = 0) and cry1 mutant (CRY1-knockout, ksc1 = 0) models are given in Figures 9a–c, respectively. Specifically, the time-dependent HY5 level at fluence rate of 30 μmol/m2/s (Figure 9d) and the fluence-rate-dependent HY5 level at 8 hrs (Figure 9e) presents a negligible difference between the cry2 mutant and WT model (Figure 9a,b,d,e). Differently, the HY5 level in the cry1 mutant typically remains at small value with irradiation time and with varying fluence rate of blue light (Figure 9a,c,d,e). As a result, HY5 is sensitive to CRY1, rather than CRY2.
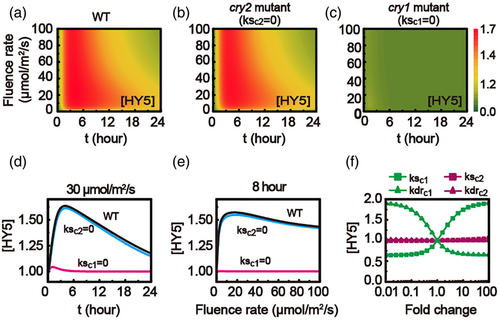
The significant difference for HY5 mediation by CRY1 and CRY2 was also discussed with varying synthesis rates or degradation rates of CRY1 (ksc1 or kdrc1) or CRY2 (ksc2 or kdrc2), respectively. Figure 9f indicates that the activation of HY5 is mainly mediated by CRY1 (with green symbols in Figure 9f), rather than CRY2 (with purple symbols in Figure 9f). Furthermore, the CRY1-mediated processes show a sensitive modulation effect on HY5 level, as shown in Figure S4a,b. However, HY5 level is insensitive to all the CRY2-mediated processes (Figure S4c,d). Therefore, the CRY1 processes are predicted as the major modulation factor for HY5 level.
Besides, the model also predicts that BIC has a negative correlation with HY5 protein (Figure S5). Therefore, BIC plays a negative mediation on the plant photomorphogenesis.
4 DISCUSSION
The blue light receptor cryptochromes (CRY1 and CRY2) system of Arabidopsis thaliana has been intensively investigated in experiment during the last decade (Ahmad, Jarillo, & Cashmore, 1998; Bagnall et al., 1996; Cashmore, Jarillo, Wu, & Liu, 1999; Guo et al., 1998; Lin et al., 1996; Lin & Shalitin, 2003; Rosenfeldt et al., 2008). Despite the significant developments for the identification of various proteins in CRY signalling pathways and for the exploration of their interactions by molecular biology approaches, a systematical understanding of the global dynamics of the blue-light-regulated signalling pathways is still lacking. Here, by combining the signalling network model prediction with experiment confirmation, for the first time, we systematically analysed the different response modes and cooperative modulations caused by the specific interaction dynamics of CRY1 and CRY2 with BIC and COP1-SPA under blue light.
4.1 The bell-shaped response of CRY2 phosphorylation caused by fast phosphorylation and degradation of CRY2
Although the CRY1 and CRY2 pathways are similar, the model proposes that CRY1 and CRY2 pathways necessarily have five different processes in signalling networks. In detail, compared to CRY1, CRY2 has a fast phosphorylation process, a strong association process with BIC, a slow dissociation process of BIC-CRY2, a strong COP1-SPA-dependent degradation progress, and a strong fluence-rate-enhanced degradation process. The fast degradation of CRY2 was suggested as the main factor to generate the bell-shaped response of CRY2 phosphorylation in previous experimental studies (Shalitin et al., 2002). However, the model shows that the time-dependent bell-shaped response of CRY2 is involved not only with its fast degradation (including both the fluence-rate-enhanced and the COP1-SPA-dependent degradation processes), but also with its fast phosphorylation process; while the fluence-rate-dependent bell-shaped response of CRY2 is mainly determined by its strong fluence-rate-enhanced degradation and fast phosphorylation processes.
Furthermore, our model predicts that there is a monotonical increase of the surge height for both time-dependent and fluence-rate-dependent curves of CRY2 with the increase of the phosphorylation rate of CRY2, and a monotonical decrease of the surge height for time-dependent curve of CRY2 with the increase of the fluence-rate-dependent degradation rate of CRY2, which are obvious results. Interestingly, the model predicts a biphasic change of surge height for fluence-rate-dependent relative level of CRY2 phosphorylation with the increase of the fluence-rate-dependent degradation rate of CRY2.
4.2 Effects of BIC on CRY phosphorylation
The model suggests that CRY2 has a stronger association with BIC than CRY1 does, which is confirmed by our experiment. The model also indicates that the association strength of BIC and CRY1 increases with the enhanced fluence-rate, while the association strength of BIC and CRY2 is barely dependent of the fluence rate (higher than 5 μmol/m2/s) in blue light. The modeling prediction that the time-dependent BIC-CRY1 and the fluence-rate-dependent BIC-CRY2 are both bell-shaped response were also observed in the experiment. Furthermore, the model prediction that the abundance of BIC negatively regulates CRY2 phosphorylation was also confirmed by our experiment.
4.3 Association between CRY1 and CRY2 through COP1-SPA
The model shows that COP1-SPA is prominently inhibited by CRY1. Meanwhile, the COP1-SPA abundance can strongly inhibit the phosphorylation response of CRY2. As a result, although CRY1 and CRY2 are coupled through COP1-SPA, the CRY2 abundance has little effect on the relative level of phosphorylated CRY1, while the CRY1 abundance can promote the relative level of phosphorylated CRY2 through COP1-SPA complex. Furthermore, the model predicts that more CRY1 dimers are formed to associate with COP1-SPA than CRY2 because of the weak association of BIC and CRY1.
4.4 Modulation of CRY on HY5
The model reveals that HY5 is more strongly modulated by CRY1 than CRY2. This is partly because the association for BIC with CRY1 is weaker than with CRY2, leading to more CRY1 homo-dimer than CRY2 homo-dimer. As a result, CRY1 has a strong effect on COP1-SPA complex by association process, resulting in a strong modulation of CRY1 on HY5 protein for photomorphogenesis.
4.5 Limitation of the model
Although our model has been able to discuss many responding dynamics of CRYs to blue light, a limitation of the model is that the distributions of various proteins were simply considered without taking nucleus-cytoplasm spaces into account. It is unlikely for the model to predict the dynamics of nucleus-cytoplasm distribution and migration of each protein in blue light. Besides, only CRY blue-light-dependent homo-oligomerization was considered to explore the mutual regulation of CRY1 and CRY2 in the model. Considering more detailed experimental observations about CRY1-CRY2 hetero-oligomerization (Liu et al., 2020), a better model will be expected to discuss the light-dependent homo-oligomerization and hetero-oligomerization of CRYs to explore the cross-talk of CRY1 and CRY2 in the future. The defect in our model caused by the simplified processes, such as the ignorance of various reactions of COP1, SPA and COP1-SPA, also prompts us to improve the model in the future.
ACKNOWLEDGEMENTS
We thank Zhiyong Yin and Fei Xu for stimulating discussions during the course of this work. We acknowledge supports from the National Natural Science Foundation of China (Grant Nos. 12090052 and 11874310 to J.S. and 11704318 to X.L.), the 111 Project (Grant No. B16029) and the China Postdoctoral Science Foundation (Grant No. 2016M602071).
CONFLICT OF INTEREST
The authors declare that they have no competing interests.
AUTHOR CONTRIBUTIONS
Yuning Wu and Jianwei Shuai designed and developed the model; Qin Wang and Chentao Lin designed the experiments and collected experimental data; Yuning Wu wrote and ran simulation programs; Yuning Wu, Jing Qu, Wen Liu, Xuejuan Gao and Xiang Li analysed research data; Yuning Wu and Jianwei Shuai wrote original draft preparation; and Yuning Wu, Jianwei Shuai, Qin Wang, Xinhao Ouyang and Chentao Lin reviewed and edited manuscript.
Open Research
DATA AVAILABILITY STATEMENT
The data that support the findings of this study are available from the corresponding author upon reasonable request.


