Genome Resources for Identifying SNPs Associated With Eight Horticultural Traits in Commercial Korean Elite Radish (Raphanus sativus) Lines
Han Yong Park and Myunghee Jung are contributed equally to this work.
Funding: This work was supported by the Korea Institute of Planning and Evaluation for Technology in Food, Agriculture, and Forestry (IPET) through the Digital Breeding Transformation Technology Development Program funded by the Ministry of Agriculture, Food, and Rural Affairs (MAFRA) (RS-2022-IP322069).
ABSTRACT
Radish (Raphanus sativus), which belongs to the family Brassicaceae, has relatively limited genomic resources, especially for elite lines used in commercial breeding and other agricultural applications. Thus, this study aimed to provide a comprehensive catalogue of genome sequences for 100 elite radish lines used in the Korean industry for commercial breeding purposes. These lines were sequenced and mapped to the elite Bakdal genome. A total of 33,919 high-quality single nucleotide polymorphisms (SNPs) were identified and were found to be associated with eight distinct phenotypic traits. Five diverse machine learning (ML) models revealed that a subset of 198 SNPs had high predictive potential for the eight horticultural traits. Furthermore, the 100 elite lines were grouped into four clusters based on the eight traits, and their predictive potential was evaluated using the ML models trained using both individual and pooled SNPs. The accuracy ranged from 0.83 to 0.96 for the individually trained models and from 0.84 to 0.95 for the pooled models. This study provides a substantial basis for the advancement of digital/precision radish breeding.
1 Introduction
Radish (Raphanus sativus) is a valuable horticultural crop because of its nutritional content, multiple culinary uses and ability to thrive under various environmental conditions (Park et al. 2024; Al-Hamadany, Al-Jubouri, and Al-Shakarchy 2023; Raman 2022). Radish domestication is believed to have occurred in Asia prior to the Roman era, and its cultivation and consumption have since become widespread worldwide (Lewis-Jones, Thorpe, and Wallis 1982). The popularity of radish has further increased owing to the widespread consumption of kimchi, a taste- and health-promoting fermented food (Park et al. 2024). Radishes offer a wide range of flavours, textures and biochemical properties, making them versatile ingredients in various culinary traditions (Gamba et al. 2021; Cai et al. 2024). Given the significance of radishes in global vegetable production, understanding their genetic diversity is important. This information is essential for various aspects of plant breeding because radishes account for approximately 2% of the global vegetable production (Huh et al. 2024). Additionally, radish breeding programs face several challenges with the development of horticultural traits such as those associated with reasonable root shape, root length, root weight, flowering time, drought tolerance and soil adaptability (Huh et al. 2024; Kumar and Kaushik 2021). Furthermore, the primary challenges associated with radish breeding, particularly in the context of root and tuber crops, arise from the fact that these crops exhibit belowground traits that make observation and measurement difficult (Lebot 2018). In addition, the complex ploidy and irregular flowering patterns of these crops pose significant obstacles for genotype-based breeding. Considering these challenges, the development of innovative strategies for radish breeding that incorporate genome-wide molecular markers is urgently needed to improve radish crop development (Yang et al. 2020).
Challenges associated with radish breeding have prompted ongoing efforts to establish a superior reference genome for R. sativus. Over the past decade, these efforts have included the sequencing of wild radish and different cultivated radish genomes using short-read sequencing techniques, which has resulted in highly fragmented data compared with more recent genomes constructed using long-read sequencing technologies (Kitashiba et al. 2014; Moghe et al. 2014; Xu et al. 2023). Consequently, a pan-genome for radishes of various wild types was constructed. The size of the radish genome ranged from 418 to 515 Mb, with nine chromosomes and a completeness score of approximately 95% (Zhang et al. 2021). Furthermore, quantitative trait loci (QTLs) with different agronomic traits can be identified using different variant capture methods, such as Random Amplicon Sequencing-Direct (Ezeah et al. 2023), Kompetitive Allele-Specific PCR (Xing et al. 2024) and genotyping-by-sequencing (Kobayashi et al. 2020), which are deployed to address the reduced representation of the radish genome. To increase the coverage of genome-wide markers, a few more studies have also deployed 100 agronomically important radish traits and root colour horticulture traits worldwide (Huh et al. 2024; Xu et al. 2023; Kim et al. 2024). With these detailed reviews, the genetic resources of elite radish lines have been overlooked, except for the genome of the Korean Bakdal elite line thus far (Park et al. 2024). Elite lines are valuable assets in commercial plant breeding programs and represent the culmination of selective breeding efforts to enhance crop performance. However, it is important to balance the use of elite lines with strategies to conserve genetic diversity and ensure the resilience and adaptability of agricultural systems (Sanchez et al. 2023). Furthermore, identifying unique genomic loci in elite lines, such as genes associated with desirable agronomic traits, is crucial for mapping QTLs that are significantly associated with phenotypes (Lv et al. 2017). In addition, understanding genetic gains in breeding programs typically focuses on polygenic traits, which are influenced by multiple genes, rather than on oligogenic traits, which are primarily controlled by a small number of genes (Epstein et al. 2023). Additionally, breeders must obtain detailed genetic insights into radish diversity and genomic loci associated with oligogenic or polygenic traits (Epstein et al. 2023).
The emergence of cost-effective genotypic technologies made possible by massive advancements in next-generation sequencing technologies has created a big data environment for plant breeding (van Dijk, Shiu, and de Ridder 2022). Concurrently, advancements in machine learning have opened new avenues for improving breeding programs by associating polygenic markers with multiple agronomic attributes and enabling phenotypic predictions from genotypes (van Dijk, Shiu, and de Ridder 2022). These advancements have shifted the use of scientific community from time-consuming and resource-intensive breeding methods to advanced genomic marker-assisted breeding methods, paving the way for precision/digital farming and the use of empirical genome-wide genetic markers for a wide array of traits. The research community on radish has obtained genetic insights mostly in a linear form using regression methods, which are highly effective for oligogenic traits but not for polygenic traits, which have a nonlinear nature (Kumar and Kaushik 2021). Machine learning models such as regression and classification models and deep learning approaches, along with statistical methods such as genomic best linear unbiased prediction (GBLUP) and ridge regression best linear unbiased predictor (rrBLUP), are increasingly used in determining the association of genotypes and phenotypes for crop/plant breeding (Tong and Nikoloski 2021). These machine learning models are used to predict complex polygenic traits and show promise in improving the prediction accuracy of polygenic trait determination (Luo and Gu 2020; Danilevicz et al. 2022; Sandhu et al. 2021; Niazian and Niedbała 2020; Yang et al. 2013). Interestingly, although GBLUP has been effectively used (Tong and Nikoloski 2021), it might not capture nonlinear relationships as effectively as machine learning algorithms for complex relationships (Tong and Nikoloski 2021; Danilevicz et al. 2022). Machine learning/deep learning methods have demonstrated promise in improving the prediction accuracy for complex traits, whereas statistical methods such as rrBLUP and GBLUP are used to predict quantitative traits in various crop/plant breeding programs (Tong and Nikoloski 2021). These models offer improved prediction accuracy when associating wide-array SNPs from long genomic distances and can handle the complexity of polygenic traits, which is essential for the development of improved radish varieties (Luo and Gu 2020; Danilevicz et al. 2022; Sandhu et al. 2021). For instance, the application of machine learning algorithms in genome-wide association studies (GWAS) may improve the efficiency of genomics-assisted breeding programs through the identification of QTLs and marker-trait associations that are important for various agronomic traits (Tong and Nikoloski 2021; Yoosefzadeh-Najafabadi et al. 2022).
As described above, machine learning methods can be effectively applied in GWAS to improve radish breeding programs. In this study, we sequenced 100 elite lines commonly used in Korean industries for backcrossing, with the ultimate goal of creating a desired radish variety for a wide range of applications. The sequenced genomes were genotyped using the reference Bakdal, an elite line, and the genotypes were mapped to eight traits and assessed for their predictive potential for phenotypes using five machine-learning models.
2 Materials and Methods
2.1 Plant Sampling
A total of 100 elite lines sourced from Dasan Bio (South Korea base seed company), were used. These lines were obtained directly from breeding procedures. DNA samples were collected on 27 August 2023 and sown in an open field with a green plastic mulch that had holes spaced 25 cm apart in a grid-like pattern. Three seeds were planted into each hole. Fifteen days later, only one healthy plant was left in each hole and the remaining plants were thinned out. Ten days after thinning, young leaves 1.5 cm in size were carefully harvested for DNA extraction using the cetyltrimethylammonium bromide method.
2.2 DNA Sequencing and Variant Calling
Total DNA was isolated from the samples individually according to standard sequencing protocols. DNA was prepared using a TruSeq Nano DNA Prep Kit for Illumina sequencing. Each isolated DNA sample was sequenced using the short-read Novaseq6000 platform (Illumina, CA, USA). The experiment was conducted using DNALink, an authorised service provider in South Korea. Illumina paired-end sequences were subjected to quality and adapter trimming using BBDuk (v28.26). The processed reads were mapped to the recently sequenced Radish Elite Parental line as a reference genome (Park et al. 2024) using Bowtie2 (v.2.2.5) (Langmead and Salzberg 2012). Variant calling was performed with the Haplotype caller in the Genome Analysis Toolkit (GATK; v4.2.0.0) (McKenna et al. 2010), and the SNPs were annotated using SnpEff (v.4.2) (Cingolani et al. 2012).
2.3 Selection of Trait-Associated SNPs
SNPs were selected using parametric selection: Initially, GATK variant call parameters, specifically a normalised quality score ≥ 2 and mapping quality ≥ 40, were used. Subsequently, high-quality SNPs were selected using the following criteria: (1) bi-allelic sites, (2) genotyping rate of the samples at each variable site ≥ 90%, (3) minor allele frequency (MAF) > 5%, and (4) Hardy–Weinberg equilibrium (HWE) < 0.001 using PLINK v1.9 (Purcell et al. 2007). The selected high-quality SNPs were subjected to population stratification using the STRUCTURE algorithm, with a K range of 1–7 and 10,000 iterations (Pritchard, Stephens, and Donnelly 2000). Furthermore, the 100 elites were divided into two distinct categories (high and low) based on their individual phenotypic trait values. The top 30% were classified as the high group (case) and the bottom 30% as the low group (control) and subjected to the association test of PLINK as a case–control model. Significantly associated SNPs were selected based on a P-value < 0.01. This process was repeated independently for all eight traits. Finally, the subset of individual and pooled high-quality SNPs was used for machine learning as features to assess their predictive potential.
2.4 Construction and Validation of Machine Learning Models
Five supervised machine learning algorithm models were used to determine the efficacy of the selected SNP: support vector machine (SVM), k-nearest neighbour (k-NN), random forest (RF), C5.0 decision tree (C5.0) and partial least squares (PLS). Each dataset was divided into training and validation datasets in a 7:3 ratio for the prediction models. The accuracy of five distinct models was evaluated using the ‘Caret’ package, which evaluates to select the optimal model (Kuhn 2008). To evaluate the prediction methods, sensitivity, specificity and accuracy were calculated using the following equations: sensitivity = true positives/(true positives + false negatives); specificity = true negatives/(true negatives + false positives); and accuracy = (true positives + true negatives)/(true positives + false negatives + true negatives + false positives). The performance of the prediction models was assessed using receiver operating characteristic (ROC) curves, which plot sensitivity as a function of (1-specificity) for different decision thresholds. To further compare the ROC curves quantitatively, the area under the curve (AUC) was computed, and significant differences between the two ROCs were assessed using a two-tailed Student's t-test. Evaluation metrics were calculated as described by Kang et al. (Kang et al. 2019). The ‘plotROC’ package (Sachs 2017) was used to calculate the ROC and AUC.
3 Results
3.1 Genome Sequencing and High-Quality SNPs
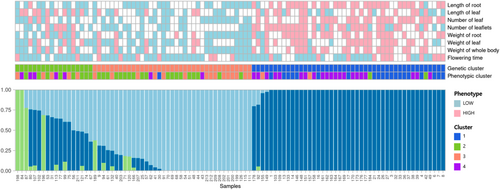
The sequencing-to-variant selection process is shown in Figure S1 and Table S1. The total number of short read sequences obtained for each of the 100 elite lines of radish was approximately 40 times coverage, resulting in approximately 17.4 Gb of sequencing data (Figure S2A). Of these, 98.8% were processed for sequencing artefacts as outlined in the Methods section, and 93% of the processed sequences were mapped to the reference genome. The mapped sequences covered 90% of the genomic region, and on average, 97.2% of the genes were also covered. Among these, 63% of the genic loci passed the variant call protocol with mapped bases (Figures S2B and S2C). A total of 337 Mb regions were identified during the initial genotyping, with only 1 Mb comprising high-quality SNP regions that successfully passed the quality filter. Subsequently, 33,919 high-quality SNPs were selected for downstream analysis, as illustrated in the workflow (Figure S1). Additionally, the STRUCTURE methodology was employed to evaluate the genetic population stratification of 100 Korean elite lines, resulting in the identification of three sub-populations, which exhibited phenotypic patterns corresponding to high and low horticultural trait values (Figure 1).
3.2 Selected SNPs and Their Trait Associations
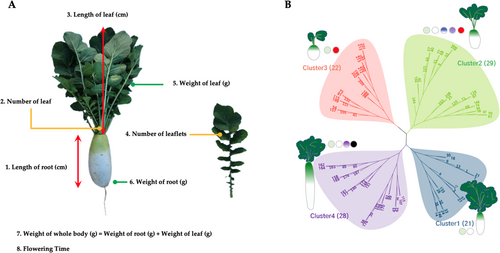
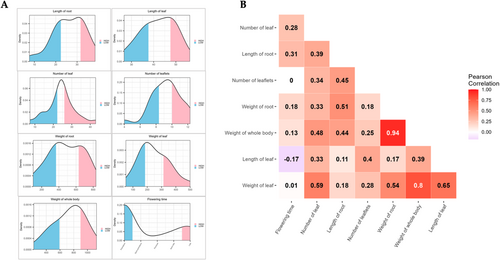
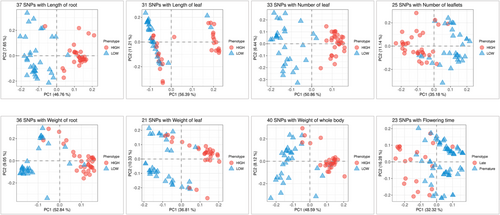
As illustrated in Figure 2A,B, eight characteristics were categorized into four distinct groups (i.e., clusters 1 to 4). The observed and calculated phenotype values (Table S1) subjected to neighbour joining method and subsequently the dendrogram tree plotted with iTOL visualisation method. Clusters 1 and 2 primarily comprised oval-shaped roots of two to three different colours, whereas clusters 3 and 4 comprised longer barrel-shaped roots with an increased number of leaflets. These clusters were established based on a phylogenetic tree constructed using the phenotypic values derived from all samples. Similarly, each phenotypic value was classified as high or low based on the trait values (Figure 3A). The weight and length of the root were highly correlated. Whole body weight was derived from the weights of the roots and leaves, which were also highly correlated (Figure 3B). To identify the SNP set, a subset of high-quality SNPs that were strongly associated with eight horticultural crops was selected from the GWAS and principal component analysis (PCA) assessments. Manhattan plot p-values (Figure S3) were used to identify SNPs that demonstrated a high correlation with each trait. PCA was performed to better describe the overall diversity of the samples (Figure S4A). A total of 198 SNPs were chosen from all eight traits: root length (37 SNPs), leaf length (31 SNPs), leaf number (33 SNPs), leaflet number (25 SNPs), root weight (36 SNPs), leaf weight (21 SNPs), whole body weight (40 SNPs) and flowering time (23 SNPs). Interestingly, the PCA results showed a distinct separation between the high and low categories for all 198 SNPs (Figure S4B). The combinations of SNPs are depicted in a heatmap, which revealed that 163 of the 198 SNPs were associated with a single trait, 25 were associated with two traits, nine were associated with three traits, and the RASAT00001:9289382 SNP was associated with six traits (Figure S5 and Table S2). Subsequently, the selected SNP sets were subjected to machine learning-based feature selection and evaluation of their predictive capacity as individual trait SNP sets, which were then combined and assessed collectively using five separate machines for classification tasks.
3.3 Machine Learning-Based Classification of SNPs for the Eight Traits
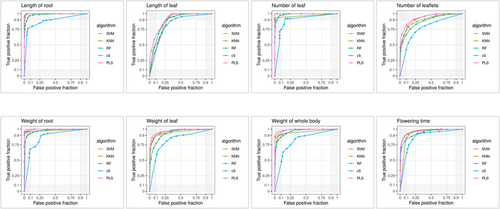
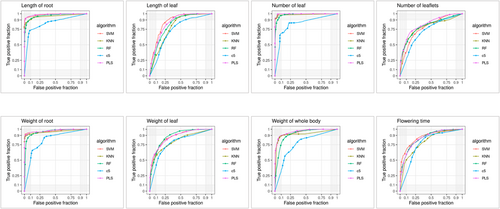
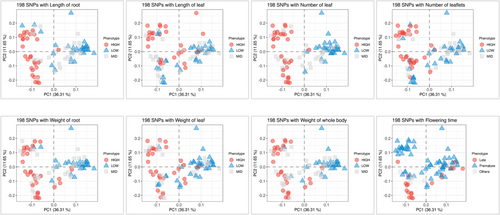
The eight traits depicted in Figures 2A and 3A were used to classify the data into training and validation datasets (Table 1), which consisted of 42–58 genomes for training and testing purposes. Additionally, a separate external validation dataset consisting of 18–25 genomes were used (Table 1). Five distinct machine learning models, namely, SVM, k-NN, RF, C5.0 and PLS, were used to assess the SNP sets, both individually and collectively, to evaluate their predictive potential for traits. The results are presented in Table 1. Among the five machine learning models, SVM demonstrated successful performance for six traits across the individual and pooled groups. Additionally, the pooled SNPs exhibited a stronger predictive capability for the traits (Figure 4) than individual SNPs (Figure 5). This is evidenced by the PCA plot, which clearly shows the classification potential of both the pooled (Figure 6) and individual SNPs (Figure 7) for the eight traits. The following biological processes identified various markers that have been linked to crop development:DNA replication and methylation (factor of DNA methylation 4, replication protein A 70 kDa DNA-binding subunit, centromere protein C, regulator of telomere elongation helicase 1, and ATP-dependent DNA helicase Q-like 4A), RNA degradation (CCR4-NOT transcription complex subunit and IAA-amino acid hydrolase ILR1-like 2), plant hormone signal transduction (abscisic acid receptor, ETHYLENE INSENSITIVE 3-like 4 protein and DELLA protein RGL1), plant-pathogen interaction (receptor-like protein EIX2, patellin-3 and defensin-like protein 1), carbon fixation in photosynthesis (NADP-dependent malic enzyme 2), inositol phosphate metabolism (phosphoinositide phospholipase C7 and phosphatidylinositol 4-phosphate 5-kinase 7), and biosynthesis of secondary metabolites (caffeoylshikimate esterase, isopentenyl phosphate kinase, amyloplastic, regulator of telomere elongation helicase 1 homologue and transcription factor TFIIIB component B′) and organelle genes (pentatricopeptide repeat-containing protein). These markers are essential for understanding crucial factors that contribute to crop growth and development (Table S2).
| S. no. | Trait | Individual SNPs | Pooled SNPs | Dataset | |||||||
|---|---|---|---|---|---|---|---|---|---|---|---|
| ML model | Accuracy | Sp | Sn | ML model | Accuracy | Sp | Sn | Training | Validation | ||
| (High/low) | |||||||||||
| 1 | Length of root | KNN | 0.89 | 0.9 | 0.88 | C5 | 0.89 | 0.9 | 0.88 | 43 (22/21) | 19 |
| 2 | Length of leaf | SVM | 0.84 | 0.8 | 0.89 | C5 | 0.79 | 0.6 | 1 | 42 (21/21) | 19 |
| 3 | Number of leaf | C5 | 0.89 | 0.83 | 1 | KNN | 0.95 | 0.92 | 1 | 42 (24/18) | 19 |
| 4 | Number of leaflets | SVM | 0.89 | 1 | 0.78 | RF | 0.95 | 1 | 0.89 | 44 (23/21) | 19 |
| 5 | Weight of root | RF | 0.84 | 0.9 | 0.78 | SVM | 0.84 | 0.9 | 0.78 | 43 (23/20) | 19 |
| 6 | Weight of leaf | SVM | 0.9 | 0.92 | 0.88 | C5 | 0.9 | 1 | 0.75 | 44 (22/22) | 20 |
| 7 | Weight of whole body | RF | 0.83 | 0.78 | 0.89 | SVM | 0.94 | 0.89 | 1 | 42 (21/21) | 18 |
| 8 | Flowering time | KNN | 0.96 | 1 | 0.67 | SVM | 0.92 | 0.67 | 0.95 | 58 (18/40) | 25 |
- Abbreviations: Sn, sensitivity; Sp, specificity.
4 Discussion
Genome sequencing is a critical resource for plant breeding because it provides a comprehensive understanding of the genetic makeup of plants, which is essential for identifying desirable traits and accelerating breeding (Henry 2022). The availability of genome sequences allows breeders to connect phenotypic traits with their underlying genotypes, thereby facilitating the selection of improved cultivars (Poland and Rife 2012). Radish (R. sativus L.) is a member of the Brassicaceae family that includes Arabidopsis thaliana and Brassica species, which have undergone advanced genetic and genomic studies. Similarly, various efforts have been made to develop genetic resources for radishes, which involve the construction of meta-genomes and high-density genetic maps and the identification of trait-associated molecular markers such as glucosinolate (GL) content and root colour (Huh et al. 2024; Xing et al. 2024; Yi et al. 2016; Kim et al. 2021; Masukawa et al. 2019; Shirasawa and Kitashiba 2017). Moreover, germplasm resources for radishes have been widely sequenced, such as the 100 radish varieties that are currently being cultivated (Huh et al. 2024). Although these advancements have facilitated the identification of genes for important agronomic traits and are expected to improve radish breeding programs, radish remains a less-studied crop. The underground growth of roots/tubers, such as radishes, onions, carrots, potatoes, sweet potatoes and yams, complicates the phenotyping of desirable traits, presenting a significant obstacle in plant breeding (Paez-Garcia et al. 2015; Divya, Thangaraj, and Krishna Radhika 2024). An alternative method for accelerating the breeding process in such scenarios is marker-assisted breeding, which can be achieved using genome sequencing. For cereals, genomic resources have been extensively developed and the application of GAB techniques such as marker-assisted selection and genomic selection are being applied to traits such as drought tolerance and disease resistance (Thudi et al. 2014; Singh et al. 2017). These approaches are also being applied to other crops such as tomato (Tiwari et al. 2022) and millets (Satyavathi et al. 2019), indicating a broader trend towards the integration of genomic information into breeding practises. However, the genomic resources available for root and tuber crops are currently limited. Therefore, the genomic resources we developed for the elite lines and the markers associated with the eight traits (Figures 6 and 4) could serve as important resources for radish and other root crops and could aid in uncovering various challenging genetic factors associated with root/tuber crops (Mun et al. 2015; Kumar et al. 2012).
Large-scale phenotypic and genotypic datasets have been increasingly integrated with machine learning models, facilitating predictive breeding and crop development with improved yield, resilience and quality (Bose et al. 2024; Yu et al. 2021). Similarly, we used five unique machine learning algorithms that are often used in predicting the functions of biomolecules to forecast the association of the identified SNPs with the eight traits (Figures 4 and 5) (Yu et al. 2021; Noh et al. 2023; Malik et al. 2022). This methodology is advantageous for discerning linkages between polygenic traits and genetic improvement during backcrossing. The results of the present study are consistent with those of several studies conducted on other crops. For example, the identification of meiotic crossover genes is crucial for various genetic gains (Epstein et al. 2023). Additionally, this study found that similar genes are involved in DNA replication and methylation, including DNA methylation 4, replication protein A 70 kDa DNA-binding subunit, centromere protein C, regulator of telomere elongation helicase 1 and ATP-dependent DNA helicase Q-like 4A. Furthermore, other biological functions, such as plant hormone signal transduction and plant-pathogen interactions, could serve as valuable genetic markers for the development of disease resistance in radish breeding programs. This study generated valuable genetic resources and identified significant SNP markers that may serve as a foundation for various genome-assisted breeding applications. To supplement conventional phenotypic methods, we incorporated genome-wide SNPs and identified their associations with corresponding traits by selecting specific SNP subsets using machine learning techniques. The carefully selected set of SNPs, which could be effective variables in machine learning methods, were highly capable of classifying the genotypic patterns with phenotype and were also similar in the genotype subpopulation assessment, guaranteeing the extensive applicability of the machine learning methodology to radish research and other breeding applications (Figure 1).
Although machine learning models have shown efficiency in GWAS for crop breeding by identifying relevant genetic markers associated with important traits and show promise in handling complex, high-dimensional data and capturing nonlinear relationships, they also face challenges such as the need for large, high-quality datasets and the interpretation of model outputs (Danilevicz et al. 2022). The high dimensionality of data can impede the scalability and generalisation of machine learning algorithms. For instance, the genomic BLUP method performs well in the presence of a population structure, suggesting that machine learning methods require refinement to incorporate such information (Danilevicz et al. 2022; Sandhu et al. 2021; Yang et al. 2013; Grinberg, Orhobor, and King 2020). With these cautions, we utilised GWAS to enhance radish genetic resources.
Author Contributions
Myunghee Jung, Yu-Jin Lim, Sunghyun Cho, and Younhee Shin performed genome mapping, variant analysis and machine learning modelling. Younhee Shin, Sathiyamoorthy Subramaniyam and Han Yong Park drafted the manuscript. Han Yong Park and Byeong Jun Park performed the sampling and sequencing. Han Yong Park, Byeong Jun Park and Younhee Shin funded and modelled the study.
Conflicts of Interest
The authors declare no conflicts of interest.
Open Research
Data Availability Statement
The complete sequences generated in this study have been deposited in the Sequence Read Archive repository under the accession number PRJNA1173361.


