Expectations of treatment outcome in complex cases of patients with chronic pain: A study on the DATAPAIN cohort
Abstract
Background
A better insight in how the biopsychosocial factors influence patient outcome(s) may provide information that helps selecting the optimal pain management for a specific group.
Methods
Categorization was made in the prospective DATAPAIN registry, in which patients with pain severity (Numeric Rating Scale [NRS]: 7–10), depression or anxiety (Hospital Anxiety and Depression Scale: > 10), and pain catastrophizing (Pain Catastrophizing Scale: > 31) were identified as complex cases. Patient outcomes; treatment satisfaction on the Patient Global Impression of Change (PGIC), pain relief (NRS), pain interference on the Brief Pain Inventory (BPI) and quality of life indicator General Perceived Health (GPH) were evaluated. Logistic regression analyzed if belonging to the complex cases showed modification in the outcome of the PGIC and GPH. Linear regression was observed if complex cases differed in average reduction in pain relief and interference compared to non-complex cases.
Results
1637 patients were included, of which 345 (21.08%) were considered complex cases. The changes in scores of pain relief and BPI active subscale were not significantly different between groups. The BPI affective subscale had a different change in score (−0.509; p: 0.002). The complex cases had an odds ratio (OR) of 0.59 (95% confidence interval [CI]: 0.36–0.77) on treatment satisfaction compared to non-complex cases, and an OR of 0.28 (95% CI: 0.11–0.56) on the GPH.
Conclusion
When treating patients with complex cases, desired treatment outcome(s) should be recognized by specialists and patients, as these may be less likely to occur.
INTRODUCTION
Chronic pain affects about 20% of the general population and available treatment strategies do not always provide satisfactory results for the patient.1 Standardized treatment of all patients with chronic pain cannot be implied because of the heterogeneity in disease presentation and causes. Chronic pain is recognized as a biopsychosocial phenomenon in which biological, psychological, and social factors dynamically interact.1-3 Cognitive and affective factors, such as pain catastrophizing, anxiety, and depression, contribute to the pain response and are, among other factors, associated with sex.4 In cross-sectional analyses, the presence of these cognitive and affective factors has been associated with high pain severity, and with low quality of life and functional status.4-8 A better insight into how the biopsychosocial factors influence patient outcome(s) may provide information that helps to select the optimal pain management for a specific group. A reliable option to observe the aforementioned interaction is clustering. Consequently, a categorization of patients with chronic pain that experienced high pain severity, presence of depression or anxiety and pain catastrophizing, were identified and clustered as complex cases and compared to non-complex counterparts.7, 8 The documentation of a large number of patients, attending tertiary pain clinics, and clustered as complex cases can help assess the impact on treatment outcomes and the deterioration of health status and quality of life.7, 9, 10
The hypothesis of this study was that complex cases of chronic pain have a lower likelihood for treatment successes, when compared to patients with chronic pain regarded as non-complex cases. The primary treatment outcomes were pain relief on the Numeric Rating Scale (NRS) and treatment satisfaction on the Patient Global Impression of Change (PGIC).11 The secondary treatment outcomes selected were the General Perceived Health (GPH) of the patient and pain interference analyzed on active and affective subscales of the Brief Pain Inventory (BPI).
METHODS
Study design
This study employed data of a large prospective registry cohort called DATAPAIN, which contains patient reported outcome measures (PROMs), socio-demographic factors and chronic pain-related data.7 The cohort entails patients with chronic pain referred to a Pain Centre since 2003 and are requested to complete the DATAPAIN questionnaire before their first consultation. As of March 2016, treatment outcomes of the patients with chronic pain were also gathered. For this article, data collected between March 2016 and June 2020 were used in the longitudinal analysis, with data before consultation (baseline) and 6 months later (follow-up). Ethical clearance was obtained from the medical ethical committee (METC 2020-1568).
Study population
Patients suffering from chronic pain who are referred to the Pain Centre are requested to complete a pain questionnaire before their first consultation. Collecting information conforms the biopsychosocial model on pain characteristics, quality of life, and psychological aspects. Additionally, demographic characteristics, such as sex, age, level of education, marital status and employment, were gathered. At 6 months follow-up, patients are asked to fill out a second pain questionnaire, with questions concerning the received pain care.12 For this study, 1637 patients gave additional informed consent to be contacted at 6 months follow-up, had an age above 18 years and had pain at baseline for more than 3 months. This population was subdivided into complex and non-complex cases based on criteria discussed in Complex versus non-complex cases section.
DATAPAIN
The DATAPAIN registry cohort is part of a quality registration, and the results of the questionnaires are used in the intake (screening and diagnosis) of patients suffering from chronic pain. The set of questionnaires collected at baseline in the DATAPAIN registry is compiled in accordance with the biopsychosocial model. These are all validated questionnaires for the chronic pain population and suggested by the IMMPACT recommendations.11 To allow proper quality improvement, the registry was expanded with outcome measurements and quality indicators from a patient's perspective. This registry is followed nationally, and since 2020 collecting patient-reported outcome measurements (before consultation and 6 months after treatment) is mandatory for all Dutch registered pain centers (Quality Registry Pain Medicine).13
We currently use this set in both research and clinical settings: diagnostic (screening) phase, multidisciplinary consultation, experience, and outcome of treatment. In our practice, patients with chronic pain are treated within a multidisciplinary team with a biopsychosocial approach, providing tailored personalized care. To be precise, at intake, the pain specialist evaluates the results of the baseline questionnaire together with the patient. The results are considered in the anamnesis and treatment protocol that is elaborated in a shared decision with the patient.
Measurements
Primary outcomes
The NRS reflects pain intensity on an 11-point scale, ranging from zero (no pain) to ten (the most pain imaginable).14 In the DATAPAIN cohort, pain intensity was collected as the average NRS of the past week at both, baseline and follow-up.
At follow-up, the PGIC was collected on a 7-point scale varying from ‘excellent’ to ‘very bad’. The scale was categorized into two categories, in which ‘excellent’ and ‘good’ specified a successful treatment outcome and ‘average’ to ‘very bad’ a non-successful outcome.
Secondary outcomes
The quality of life indicator GPH was evaluated at follow-up on a 5-point scale, varying from ‘excellent’ to ‘very poor’. Two categories were created, in which ‘excellent’ and ‘above average’ reassembled positive general health and ‘average’ to ‘very poor’ indicated negative general health.
The BPI measured pain interference in daily activities. The activities were categorized into an affective subscale called REM, consisting of the activities; relations with others, enjoyment of life, mood and sleep and the active subscale named WAW consisting of walking, general activity and work. This questionnaire was measured at baseline and follow-up.15
Complex versus non-complex cases
Based on clinical expertise the complex cases were defined, as those who presented an average pain intensity score of 7–10 (≥ 7) on the NRS, in combination with a depression or anxiety score above 10 (> 10) on the Hospital Anxiety and Depression Scale (HADS), and in combination with pain catastrophizing of above 31 (> 31) on the Pain Catastrophizing Scale (PCS). These cut-off scores are based on the recommendations of Boonstra et al., Stern at al., and Sullivan et al.16-19
Statistical analysis
The data were tested on normal distribution for the statistical analysis, by histograms, scatterplots, and QQ-plots. The above-mentioned variables were described with mean and standard deviations, count, and proportion for the continuous and binary variables, respectively. Subsequently, analyses of differences between the complex and non-complex cases were performed with the independent sample t-test or chi-square test depending on whether the variables were continuous or binary of kind.
Logistic regression was applied to determine the likelihood of success for both complex and non-complex cases, by calculating odds ratios (OR) with confidence intervals (CI) for the PGIC and the GPH. Moreover, the change scores between baseline and follow-up of the NRS and BPI were calculated and applied as the dependent variables of the linear regression. To observe, if both complex and non-complex cases have the same possibility of the specified difference score.
In both logistic and linear regression analyses, a backward stepwise elimination was conducted to select potential confounding variables. The confounders considered were those presented in Table 1: the demographic variables and pain characteristics. These factors are associated with (the maintenance of) chronic pain.20 The results of the statistical analyses were evaluated on clinical relevance and preciseness of measurement, recommended by the American Statistical Association.21 The statistical analyses were executed in R, a language for statistical computing, through R version 3.6.1 with R Studio1.4.
| Baseline | Baseline characteristics cohort DATAPAIN III | ||||
|---|---|---|---|---|---|
| Variables baseline | Total = no (%) | Non-complex cases no (%) | Complex cases no (%) | p-Values | |
| Demographic variables | 1637 (100) | 1292 (78.92) | 345 (21.08) | ||
| Sex | |||||
| Male | 706 (43.13) | 533 (41.25) | 173 (50.14) | 0.004 | |
| Female | 931 (56.87) | 759 (58.75) | 172 (49.86) | ||
| Age (mean [SD]) | 60.38 (13.46) | 60.24 (13.22) | 60.88 (14.32) | 0.451 | |
| Marital status | |||||
| No relationship | 372 (23.08) | 274 (21.54) | 98 (28.82) | 0.006 | |
| Relationship | 1240 (76.92) | 998 (78.46) | 242 (71.18) | ||
| Educational level | |||||
| Low | 1253 (76.54) | 947 (73.30) | 306 (88.70) | < 0.001 | |
| High | 384 (23.46) | 345 (26.70) | 39 (11.30) | ||
| Employment | |||||
| No paid job | 1128 (68.91) | 862 (66.72) | 266 (77.10) | < 0.001 | |
| Paid job | 509 (31.09) | 430 (33.28) | 79 (22.90) | ||
| Pain characteristics | Pain duration | ||||
| < 1 year | 562 (34.33) | 451 (34.91) | 111 (32.17) | 0.376 | |
| > 1 year | 1075 (66.67) | 841 (65.09) | 234 (67.83) | ||
| Pain location | |||||
| Head (mean [SD]) | 215 (13.15) | 149 (11.54) | 66 (19.19) | < 0.001 | |
| Neck (mean [SD]) | 493 (30.15) | 374 (28.97) | 119 (34.59) | 0.051 | |
| Lower back (mean [SD]) | 883 (54.01) | 687 (53.26) | 196 (56.81) | 0.264 | |
| Arm (mean [SD]) | 292 (17.86) | 203 (15.72) | 89 (25.87) | < 0.001 | |
| Upper leg (mean [SD]) | 608 (37.16) | 465 (36.02) | 143 (41.45) | 0.073 | |
| Lower leg (mean [SD]) | 476 (29.11) | 345 (26.72) | 131 (38.08) | < 0.001 | |
| Chest/abdomen (mean [SD]) | 195 (11.93) | 136 (10.53) | 59 (17.15) | 0.001 | |
| Outcomes | PGIC (mean [SD]) | ||||
| Non successful | 1274 (77.83) | 978 (90.33) | 296 (96.23) | < 0.001 | |
| Successful | 363 (22.17) | 314 (9.67) | 49 (3.77) | ||
| GPH (mean [SD]) | |||||
| Negative health | 1499 (91.57) | 1167 (75.69) | 332 (85.79) | < 0.001 | |
| Positive health | 138 (8.43) | 125 (24.30) | 13 (14.20) | ||
| BPI REM (mean [SD]) | |||||
| Baseline | 4.32 (2.53) | 3.69 (2.27) | 6.72 (1.97) | < 0.001 | |
| Follow up | 3.79 (2.68) | 3.26 (2.54) | 5.77 (2.35) | < 0.001 | |
| Change | −0.54 (2.4) | −0.43 (2.38) | −0.98 (2.44) | < 0.001 | |
| BPI WAW (mean [SD]) | |||||
| Baseline | 6.09 (2.39) | 5.69 (2.38) | 7.58 (1.76) | < 0.001 | |
| Follow up | 5.26 (2.71) | 4.93 (2.72) | 6.66 (2.19) | < 0.001 | |
| Change | −0.81 (2.45) | −0.77 (2.54) | −0.93 (2.1) | 0.231 | |
| NRS (mean [SD]) | |||||
| Baseline | 7.21 (1.65) | 6.91 (1.68) | 8.37 (0.93) | < 0.001 | |
| Follow up | 5.91 (2.41) | 5.61 (2.43) | 7.1 (1.94) | < 0.001 | |
| Change | −1.30 (2.35) | −1.3 (2.43) | −1.32 (2.01) | 0.854 | |
- Abbreviations: BPI REM, Brief Pain Inventory- relations with others, enjoyment of life, mood and sleep; BPI- WAW, walking, general activity and work; GPH, General Perceived Health; NRS, Numeric Pain Rating Scale; PGIC, Patient Global Impression of Change; SD, standard deviation.
RESULTS
Description of the population
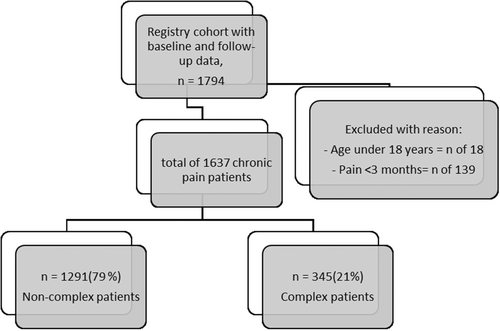
The summary table (Table 1) displays the socio-demographics, pain characteristics and measurements of the study population, consisting of 1637 patients with chronic pain who had completed both pre- and post-treatment questionnaires. Figure 1 shows a flowchart of the chronic pain patients included in both complex and non-complex cases. The complex cases were represented by 345 patients (21%), with an average age of 61 years and consisted of 50% of men. Twenty-nine percent of the complex cases had no relationship, 89% had a low level of education and 77% had no paid job. The non-complex cases consisted of 1291 patients (79%), with an average age of 60 years and of which 41% were male. The sociocultural variables statistically differed with the complex cases; 22% had no relationship status, 73% had a low level of education7 and 67% had no paid job at intake. Pain characteristics of both groups are shown in Table 1.
Primary outcomes: pain relief on the NRS and treatment success on the PGIC
Differences and similarities of the NRS for the complex and non-complex group
Baseline NRS scores differed between groups, a mean NRS of 6.91 (SD: 1.68) was found for the non-complex cases, a mean of 8.37 (SD: 0.63) for the complex cases (p < 0.001). Yet, the change in scores between baseline and follow-up were similar for both groups. A mean change of −1.3 (SD: 2.43) on the NRS for non-complex cases compared to and a mean change of −1.32 (SD: 2.01) for the complex cases, p: 0.9. This was confirmed by linear regression, indicating that both groups had a similar amount of pain relief, β = −0.07 (Standard Error [SE]: 0.14); p: 0.617 (Table 2).
| NRS difference scoring baseline—follow up | B (SE) | p-Value |
|---|---|---|
|
Crude model Complex cases |
−0.034 (0.14) | 0.869 |
|
Adjusted model Complex cases |
−0.070 (0.14) | 0.617 |
- Note: Results of the linear regression of NRS for a crude and adjusted model. The latter was adjusted for the variables that were statistically significant in the backward stepwise elimination, the variables were: age*, pain duration > 1 year***, pain location chest**. *p-value < 0.05, **p-value < 0.01, ***p-value < 0.001.
- Abbreviations: B, beta coefficient; NRS, numeric rating scale; SE, standard error.
Differences in outcome of the PGIC for complex and non-complex group
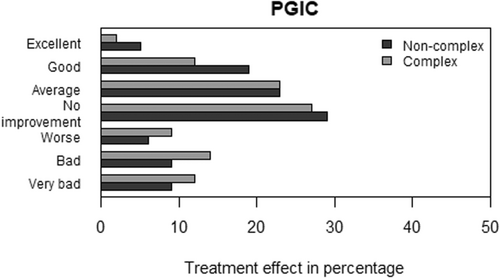
At follow up, the general success rates of the PGIC were significantly lower for the complex cases (p < 0.001). Figure 2 is a visual presentation of the outcome of this patient-rated measure, in which can be observed that the complex cases were distributed more among the ineffective categories of the PGIC. This observation was confirmed by the odds ratio, resulting in an adjusted OR on the PGIC of β = 0.52 (95% Confidence Interval [CI]: 0.37–0.78) for the complex cases (Table 3).
| PGIC | B (SE) | p-Value | 95% CI for odds ratio (OR) | ||
|---|---|---|---|---|---|
| Lower bound | OR | Upper bound | |||
|
Crude model Complex cases |
−0.655 (0.19) | < 0.001 | 0.37 | 0.52 | 0.74 |
|
Adjusted model Complex cases |
−0.646 (0.18) | < 0.001 | 0.37 | 0.52 | 0.78 |
- Note: Results of the logistic regression of PGIC for a crude and adjusted model. The latter was adjusted for the variables that were statistically significant in the backward stepwise elimination, the variables were as follows: sex(women)*, pain duration > 1 year***. *p-value < 0.05, **p-value < 0.01, and ***p-value < 0.001.
- Abbreviations: B, beta coefficient; OR, odds ratio; PGIC, patient global impression to change; SE, standard error.
Secondary outcomes: general health on the GPH and pain interference in daily life on the BPI
Differences in outcome of the GPH for complex and non-complex group
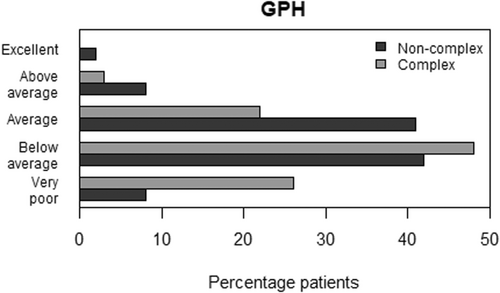
The positive general health of the GPH was significantly lower for the complex cases (p < 0.001). Figure 3 visualizes that the complex cases are distributed more among the ineffective categories of the GPH. Confirmed by the adjusted OR on the GPH of β = 0.32 (95% CI: 0.15–0.61) (Table 4).
| GPH | B (SE) | p-Value | 95% CI for odds ratio (OR) | ||
|---|---|---|---|---|---|
| Crude model | Lower bound | OR | Upper bound | ||
|
Crude model Complex CP |
−1.275 (0.37) | < 0.001 | 0.12 | 0.28 | 0.55 |
|
Adjusted model Complex CP |
−1.134 (0.35) | 0.001 | 0.15 | 0.32 | 0.61 |
- Note: Results of the logistic regression of GPH for a crude and adjusted model. The latter was adjusted for the variables that were statistically significant in the backward stepwise elimination, the variables were: work(having paid work)*, pain duration > 1 year***. *p-value < 0.05, **p-value < 0.01, and ***p-value < 0.001.
- Abbreviations: B, beta coefficient; GPH, general perceived health; OR, odds ratio; SE, standard error.
Differences and similarities of the BPI for the complex and non-complex group
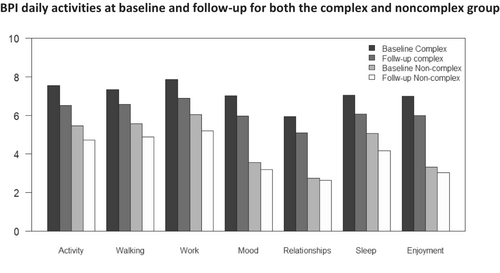
At baseline, the BPI-WAW showed an average difference between groups of almost two points with a mean of 5.69 (SD: 2.38) for the non-complex cases and 7.58 (SD: 1.76) for the complex cases (p < 0.001; Table 1). This difference remained at follow-up, as the change in score between baseline and follow-up on the BPI-WAW was similar (non-complex: −0.77 [SD: 2.54] and complex: −0.93 [SD: 2.1] with a p-value of 0.231). Furthermore, the linear regression of the BPI-WAW indicated no statistically significant association with an adjusted coefficient of −0.21 (SE: 0.15); p: 0.153, (Table 5).
| BPI difference scoring | Baseline – follow up | B (SE) | p-Value |
|---|---|---|---|
| BPI WAW change |
Crude model Complex cases |
−0.162 (0.15) | 0.281 |
|
Adjusted model Complex cases |
−0.213 (0.15) | 0.153 | |
| BPI REM change |
Crude model Complex cases |
−0.556 (0.163) | < 0.001 |
|
Adjusted model Complex cases |
−0.570 (0.145) | 0.002 |
- Note: Results of the linear regression of BPI subscales for a crude and adjusted model. The latter was adjusted for the variables that were statistically significant in the backward stepwise elimination, the variables included in the BPI WAW were: pain duration > 1 year***, pain location chest**. For the BPI REM the variables adjusted for were: pain duration > 1 year***. *p-value < 0.05, **p-value < 0.01, and ***p-value < 0.001.
- Abbreviations: B, Beta coefficient; BPI, Brief pain inventory; REM, relations with others, enjoyment of life, mood and sleep; SE, Standard error; WAW, walk, general activity, work.
The mean BPI-REM score at baseline was 3.69 (SD: 2.27) for the non-complex cases and 6.72 (SD: 1.97) for the complex cases (Table 1). The difference score of the complex cases (−0.98 [SD: 2.44]) was twice as large as for the non-complex cases (−0.43 [SD: 2.38]) (p: 0.004). But the difference between groups remained existent at follow-up (Figure 4). Linear regression confirmed the findings of the BPI difference scores: the adjusted regression coefficient for the complex cases was −0.57 (SE: 0.15); p: 0.002 on the BPI-REM.
DISCUSSION
This study has provided, upon baseline profiles, a prospect of plausible successes on clinically relevant patient outcomes. For outcomes such as treatment satisfaction and general perceived health, the complex cases of patient with chronic pain have a reduced likelihood of successes. On the outcomes pain relief and physical interference no differences were stated between the complex and non-complex cases, while a larger improvement on the affective interference scale was found for the complex cases.
Primary outcomes
Pain relief on the NRS
The findings show that the complex and non-complex group have a similar change score in pain relief, even though cognitive and affective values were existent parallel to pain severity. Our findings relate to the ones found by Farin,22 in which 262 chronic pain patients, undergoing inpatient rehabilitation, were surveyed and found that pain intensity and negative affectivity at baseline are no risk factors for a reduced pain relief. Moreover, Poulsen et al.23 indicated that pain catastrophizing does not have a predictive role in the outcome of pain relief in spinal cord stimulation for chronic neuropathic pain. Yet, most studies do indicate pain catastrophizing as a predictor of pain outcomes such as pain intensity,24-29 just like the presence of depression and anxiety at baseline are seen as predictors of worse pain outcome.9, 26-30 The results of this study suggest that although high pain severity and psychological values were present, complex cases do not respond differently in pain intensity. However, in our recent study on drug and interventional RCT's and the DATAPAIN registry cohort, greater pain relief at follow-up was found at follow-up in patients with severe pain (≥ 7 on the NRS)31, 32 The finding of a similar pain relief in both groups may suggest that the cluster of cognitive-affective, psychological factors and pain severity reduces the pain relief because a greater reduction in pain intensity could theoretically be obtained in patients with a high pain score at baseline.
Treatment success on the PGIC
Treatment satisfactions is an important outcome in pain studies and the practicality of the PGIC for patient and doctor is an appealing quality. The straightforwardness and quickness allow the evaluation of an important aspect of treatment. However, when the transition time is long the patients may have difficulty taking their baseline status into account, while the influence of the current health status increases, named availability bias.33 In the literature, a negative association is found between pain catastrophizing at baseline and treatment satisfaction and satisfaction with the received care when affective factors such as depression or anxiety are present.22 We see that treatment satisfaction in complex cases is lower. What is not clear yet, is if cognitive and affective factors have an accumulative negative effect on treatment satisfaction or if modification takes place.
Secondary outcomes
General health on the GPH
The article of Lamé et al. shows that pain intensity has a significant negative association with each of the quality of life domains, including general perceived health. Besides, patients with high catastrophizing scores had a lower general perceived health, than patients with low catastrophizing scores.34 Another body of evidence discusses the decline of the general perceived health observed when patients have a combination of pain severity with cognitive or affective factors. In our study, we notice a remarkable drop in the likelihood of positive health when both cognitive and affective factors are present.35, 36
Pain interference in daily life on the BPI
The complex cases show at baseline a high pain interference on psychical and emotional activities of daily life. Mittienen et al. found that when both subscales of the BPI are affected, patients had higher prevalence of pain catastrophizing and anxiety compared to when pain interfered highly in only one of the two dimensions. When both subscales of the BPI were affected, almost every other person with pain was unable to participate in any type of exercise.37 The distinct negative cognitive-emotional reaction to pain in complex patients is high, and catastrophic thoughts about activity or feelings of helplessness may overwhelm them. Adding to this the comorbid anxious or depressive factors may bring further emotional load. Besides the negative interaction of the cognitive and affective factors with pain, the complex cases in our study are vulnerable in the sense that the majority of them have a lower socio-economic status in society, exemplified as higher rates of low educational level, not having a paid job, and/or no relationship status.
Limitations
The most challenging limitation of this study is the fact that other important factors were not routinely collected, due to the limitations of a registry cohort. The analyses could have profited from confounders such as the classification of disease (ICD), intervention and current medication intake. Besides, we can assume that the complex cases did receive more psychological and psychiatric care, that may lead to longer time before results are visible. However, we have adjusted our findings for many potential confounding variables and baseline differences in the multivariable analyses. The study is a large academic prospective cohort with a heterogeneous population in which multiple PROMs cover many aspects of chronic pain, making cross-sectional and longitudinal analyses possible.
Future perspective
There is need for further clinical research to observe if similar findings exist in the likelihood of treatment outcomes for this group. This information may contribute to the search for relevant predictors and/or treatments of which the (complex) patients with chronic pain may benefit as for example in improving treatment satisfaction and quality of life. The similarities in reduction of pain relief and physical interference between the complex and non-complex cases may imply that the multidisciplinary care provided is adequate. However, the care provided may not be sufficient for improving treatment satisfaction and quality of life. The focus of multidisciplinary tertiary pain clinics is on pain relief, physical, psychological improvement, yet topics that may improve quality of life like societal participation are lacking. A suggestion would be to combine the personalized multidisciplinary approach together with a rehabilitation and societal approach. Social workers may provide help on topics such as education and work. Even more reason to do so is because, besides the cognitive-affective risk factors and pain severity, a high number of patients with low levels of education and absence of employment are present in the complex cases. This may hinder the usage of the health care system and full understanding of the information provided.38-41 Hence, interventions, such as pain education, self-management, and specific information for family and caregiver(s), may improve patient outcomes.
In conclusion, this study indicates that psychological health status in combination with pain severity, reduces the likelihood on treatment satisfaction, general perceived health, and pain interference of emotional activities at six months follow up. Yet, belonging to the complex cases does not interfere with the change in score of pain relief nor of pain interference of the physical activities. When treating complex patients, the desired treatment outcome(s) should be recognized by the specialist and patient before initiating treatment, as these may be less likely to occur depending on the outcome and may improve the quality of pain management, such as in monitoring pain processes and reassessing pain management plans to the needs of the patients.
ACKNOWLEDGMENTS
No acknowledgements to declare nor conflicts of interest.
CONFLICT OF INTEREST STATEMENT
None declared.
Open Research
DATA AVAILABILITY STATEMENT
The data that support the findings of this study are available on request from the corresponding author. The data are not publicly available due to privacy or ethical restrictions.


