The effect of intraoperative cerebral oxygen desaturations on postoperative cerebral oxygen metabolism in neonates and infants a pilot study
Section Editor: Dean Kurth
Abstract
Introduction
Cerebral oxygen desaturation during pediatric surgery has been associated with adverse perioperative outcomes. The aim of this pilot study was to analyze the frequency and severity of intraoperative cerebral oxygen desaturations and their impact on postoperative cerebral oxygen metabolism in neonates and infants undergoing pediatric surgery.
Methods
In a prospective pilot study, intra- and postoperative regional cerebral oxygen saturation and blood flow were measured noninvasively using a device combining laser Doppler flowmetry and white-light-spectrometry. Thirty-seven consecutive neonates and infants undergoing noncardiac surgery under general anesthesia for more than 30 min and necessity for invasive arterial blood pressure monitoring were included. Patients with pre-known congenital structural heart disease or cerebral disease were excluded. Continuously brain monitor recording was started in sedated patients before induction of anesthesia (preoperative baseline) and was completed 1 h postoperatively in the PICU in sedated, intubated, and mechanically ventilated states at the PICU (postoperative state). Baseline and postoperative state for cerebral fractional tissue oxygen extraction and approximated cerebral metabolic rate of oxygen were calculated.
Results
Seventeen (46%) of the 37 studied neonates and infants suffered from intraoperative periods of regional cerebral oxygen desaturation below 20% of the baseline (event group). Severity of cerebral desaturations was median 4.0%min/h [range 0.1–58.7; interquartile range [IQR] 0.99–21.29]. In the event group, the duration of surgery was significantly longer (median 135 min [range 11–260; IQR 113.5–167.0] vs median 46.5 min [range 11–180; IQR 30.5–159.3]; difference of −62.94; 95% confidence interval [CI] −105.17 to −20.71; p = .021). In the event group, cerebral fractional tissue oxygen extraction (median 0.41 [range 0.20–0.55; IQR 0.26–0.44] vs. median 0.27 [range 0.11–0.41; IQR 0.20–0.31]; difference of −0.11; 95% CI −0.17 to −0.05; p = .001) and approximated cerebral metabolic rate of oxygen (median 6.15 arbitrary unit [range 2.69–12.07; IQR 5.12–7.21] vs. median 4.14 arbitrary unit [range 1.78–7.86; IQR 3.82–6.31]; difference of −1.76; 95% CI −3.03 to −0.49; p = .009) were significantly higher and the cerebral regional oxygen saturation (median 58.99% [range 44.87–79.1; IQR 54.26–72.61] vs median 70.94% [range 57.9–86.13; IQR 67.07–76.59]; difference of 10.01; 95% CI 4.13–15.90; p = .002) significantly lower after surgery compared to the nonevent group.
Discussion
The increase of approximated cerebral metabolic rate of oxygen could indicate an elevated oxidative energy metabolism in the “stressed” brain, due to repair processes. The increased cerebral fractional tissue oxygen extraction fits with the decreased NIRS cerebral oxygenation. Our data suggest that an increase in cerebral oxygen metabolism was the cause.
Conclusion
Cerebral oxygen desaturation during major surgery in neonates and infants is associated with early postoperative increased cerebral oxygen extraction and possibly increased cerebral oxygen metabolism.
1 INTRODUCTION
Neonates and children undergoing major surgical procedures are at risk for critical events during general anesthesia and adverse neurological outcomes.1-3 An international, multicenter, observational study on cerebral oxygenation measurements during infant and neonatal anesthesia reported incidences of mild, moderate, and severe intraoperative cerebral deoxygenation of 43%, 11%, and 2%, respectively.4 To our knowledge, there are no studies describing the effect of intraoperative cerebral oxygen desaturations on postoperative cerebral oxygen metabolism in noncardiac pediatric surgical patients.
Postoperative cerebral oxygen metabolism can be observed by cerebral fractional tissue oxygen extraction (cFTOE) and cerebral metabolic rate of oxygen (aCMRO2). The aCMRO2 reflects the rate at which O2 is consumed by the brain through metabolic processes and thereby represents a key indicator of normal brain function. An increase in aCMRO2 might be related to an increased neuronal activity and metabolism as reported in the acute phase of an evolving brain injury.
The cFTOE reflects the relation between oxygen delivery and consumption in the brain. A study on a newborn intensive care unit showed that a cFTOE value above 0.4 is associated with an increased risk of early poor outcome in very preterm infants.5
The aim of this pilot study was to analyze the frequency and severity of intraoperative cerebral oxygen desaturations and their impact on postoperative cFTOE and aCMRO2 as possible indicators for poor neurological outcome in neonates and infants undergoing pediatric surgery.
2 MATERIALS AND METHODS
Thirty-seven consecutive neonates and infants undergoing noncardiac pediatric surgery were prospectively enrolled in this study over a period of 2 years. Inclusion criteria were as follows: age younger than one-year and general anesthesia for more than 30 min and necessity for invasive arterial blood pressure monitoring. Institutional review board approval (No. 572/2012BO1) and informed written consent of all parents were obtained for this study. Demographic data included age at surgery, preoperative weight and height, gender, primary diagnosis, and specification of surgical procedure. Monitoring during surgery included an electrocardiogram, invasive arterial blood pressure, arterial oxygen saturation, arterial and end tidal CO2, and body temperature. Patients with pre-known congenital structural heart disease or cerebral disease were excluded. Continuously brain monitor recording was started before induction of anesthesia (preoperative baseline) and was continued up to 1 h postoperatively. All patients were intubated and mechanically ventilated during the operation. Baseline values were recorded in sedated patients before intubation (preoperative baseline), the postoperative data were recorded and calculated in the postprocedural processing in sedated, intubated, and mechanically ventilated states at the PICU (postoperative state). The arterial blood gases were checked before operation, half-hourly during surgery and postoperatively. Parameters of cerebral oxygen saturation and cerebral perfusion were recorded continuously during surgery with a device combining laser Doppler flowmetry and white light spectrometry called “Oxygen-to-See” (O2C). The technology of this device has been described in detail in previous studies.6-10 Measurements were performed with a flat probe (LF-3-023 O2C, type LF-3; probe head: width 15 mm, height 5.5 mm, length 44.5 mm; probe length 300 cm Oxygen-to-See; LEA Medizintechnik, Giessen, Germany) which was placed over the right forehead offering a sampling depth of 15 mm.11 The probe transmits white light (500–800 nm, 1 nm resolution, <30 mW) into the tissue and recollects the reflected light. Based on the analysis of the spectral components of the reflected light in comparison with prerecorded deoxygenated and oxygenated hemoglobin, the device calculates oxygen saturation representing regional cerebral oxygen saturation (rcSO2) (%).12 The continuous wave laser Doppler of the device (wavelength 830 nm, <30 mW) allows calculation of microperfusion (rcFlow, arbitrary units [AU]) based on Doppler shift of laser light, which correlates with blood flow velocitiy and the number of moving erythrocytes in the tissue.6, 7 O2C uses and registers alterations of wavelength of the entire spectrum of white light (500–850 nm), including the wavelength of near infrared light (700–850 nm). A wavelength of 820 nm (30 mW) is used in the laser Doppler part of the instrument. We used probes with a distance of 15 mm of the detection fiber to the source fiber, offering a sampling depth of up to 15 mm.11 Therefore, changes in scattering properties of the tissue that influences spectra at specific wave lengths can be determined in each measurement and introduced in each calculation.
In this equation, an empiric quotient of 5 is used to transfer the measured rcFlow values to a comparable range to absolute cerebral blood flow (CBF) data, obtained by Doppler flow measurements.
rcSO2, rcFlow, MABP, and aSO2 were recorded continuously. The O2C device records the data at 1 Hz. To determine baseline values and postoperative values (see Table 1), an average of these measurements over 30 s was taken at the two specific time points when the patient was stable. Based on these values, the cFTOE and the aCMRO2 were calculated.
| Nonevent group | Event group | ||
|---|---|---|---|
| n | 20 | n | 17 |
| Age (d) | 54 (1–172) | Age (d) | 7.5 (1–128) |
| Weight (g) | 4400 (1600–7600) | Weight (g) | 3350 (1600–6100) |
| Sex (m:w) | 14:6 | Sex (m:w) | 7:10 |
| Surgery thoracal:abdominal | 6:14 | Surgery thoracal:abdominal | 10:7 |
| Duration of surgery (min) | 46.5 (11–180) | Duration of surgery (min) | 135* (11–180) |
| Magnitude of cerebral desaturations (%min/h) | 0.0 (0.0–0.0) | Magnitude of cerebral desaturations (%min/h) | 4.0* (0.1–58.7) |
| Preoperative | Postoperative | p | Preoperative | Postoperative | p | ||
|---|---|---|---|---|---|---|---|
| cFTOE | 0.33 (0.12–0.48) | 0.27 (0.11–0.41) | .056 | cFTOE | 0.37 (0.16–0.58) | 0.41* (0.20–0.55) | .795 |
| aCMRO2 (AU) | 4.36 (0.86–7.18) | 4.14 (1.78–7.86) | .522 | CMRO2 (AU) | 4.54 (1.96–6.89) | 6.15* (2.69–12.07) | .003 |
| rcSO2 (%) | 65.02 (51.47–85.76) | 70.94 (57.9–86.13) | .082 | rcSO2 (%) | 60.24 (41.44–79.35) | 58.99* (44.87–79.1) | .855 |
| rcFlow (AU) | 431.46 (291.11–654.86) | 543.79 (360.93–929.65) | .001 | rcFlow (AU) | 421.62 (190.62–714.17) | 537.38 (466.51–935.09) | <.001 |
| MABP (mmHg) | 45.0 (32.0–62.0) | 48.0 (36.0–62.0) | .054 | MAP (mmHg) | 50.0 (36.0–63.0) | 41.0* (33.0–69.0) | .045 |
| aSO2 (%) | 98.0 (95–100) | 97.0 (90–100) | .574 | aSO2 (%) | 99.5 (92–100) | 98.5 (95–100) | .739 |
| pH | 7.34 (7.27–7.50) | 7.37 (7.31–7.56 | .330 | pH | 7.36 (7.31–7.47) | 7.32* (7.18–7.44) | .009 |
| paCO2 (mmHg) | 43.6 (29.7–48.1) | 47.9 (38.1–58.0) | .107 | paCO2 (mmHg) | 40.1 (26.1–46.4) | 50.7 (37.0–59.9) | <.001 |
| Lactate (mmol/L) | 1.0 (0.6–3.3) | 1.1 (0.7–4.1) | .322 | Lactate (mmol/L) | 0.7 (0.4–4.1) | 1.5 (1.0–4.0) | <.001 |
| Hb (g/dL) | 11.3 (9.4–17.9 | 14.3 (9.4–17.8) | .200 | Hb (g/dL) | 12.5 (7.3–17.5) | 11.2 (7.7–15.6) | .945 |
- Note: Fields marked with “*” indicate a significant difference in the comparison between groups.
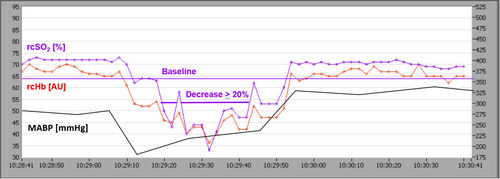
Any patient who suffered a regional cerebral oxygen desaturation below 20% of baseline was included in the event group (also see Figure 1).
2.1 Statistical analysis
Categorical data are presented as frequencies and percentages. Continuous data are presented as median, range, and interquartile range (IQR). The distributions of measurements are shown as box-and-whisker plots. The line within the box marks the median, and the boundaries of the box indicate the 25th and 75th percentile. Whiskers indicate the 90th and 10th percentiles. To test for normal distribution, the Shapiro–Wilk test was applied. Continuous variables with normal distribution were evaluated using the unpaired t-test; difference and 95 percent two-tailed confidence interval (CI) for difference of means were reported. Variables with non-normal distribution were evaluated using the Mann–Whitney U-test. Categorical variables were analyzed with the chi-square test. The statistical relationship between two continuous variables was determined using Pearson's correlation coefficient. A p value <.05 was considered as statistically significant. All charts were created with the software SigmaPlot 2000 (SPSS, Chicago, IL, USA). The data collected with the O2C were analyzed with O2CevaTime (LEA, Medizintechnik, Giessen, Germany).
3 RESULTS
Thirty-seven infants were included. The operations performed included the repair of a congenital diaphragmatic hernia (n = 7), the resection of a congenital cystic adenomatoid malformation of the lung (n = 6), the repair of an esophageal atresia with tracheoesophageal fistula (n = 5), the repair of an abdominal wall defect at gastroschisis (n = 2), an Anderson-Hynes-plastic (n = 1), a heminephrectomy (n = 1), a Kasai procedure (n = 1), a pull-through procedure for Hirschprung's disease (n = 1), and other surgeries (n = 13). All patients in the two groups belonged to ASA status 3 and 4 (also see Table 1).
Seventeen of the 37 studied neonates and infants (46%, median age at surgery 7.5 days [range 1–128]; median weight 3350 g [range 1600–6100]) revealed intraoperative periods of regional cerebral oxygen desaturation below 20% of baseline (event group) (also see Figure 1). Twenty infants and neonates showed no events (median age at surgery 54 days [range 1–172]; median weight 4400 g [range 1600–7600]) (nonevent group). Except for duration of surgery (event group median 135 min [range 11–260; IQR 113.5–167.0] vs median 46.5 min [range 11–180; IQR 30.5–159.3] in the nonevent group; difference of −62.94; 95% CI −105.17 to −20.71; p = .021), there was no statistically significant difference between both groups in demographics but the event group had significantly longer operative time and there was a wide range of rcSO2 at baseline (40%–80%), especially in the event group (Table 1).
There was a wide range of values for PCO2 at baseline and postoperatively, notably severe hyperventilation (paCO2 < 30 mmHg) preoperatively and hypoventilation (paCO2 > 50 mmHg) of patients in the event group (Table 1).
In many patients, lactate was also high, suggesting a poor hemodynamic situation, which was the case in children with diaphragmatic hernia and other urgent surgeries, among others.
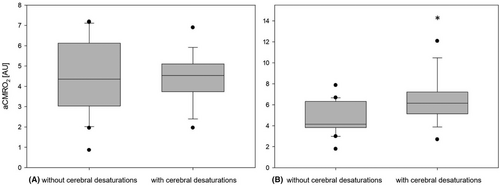
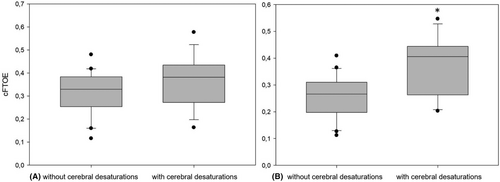
The severity of cerebral desaturations recorded in the event group was median 4.0%min/h (range 0.1–58.7; IQR 0.99–21.29) and 0%min/h in the nonevent group. Preoperative values for cFTOE and aCMRO2 showed no difference between the groups. The postoperative values for cFTOE (median 0.41 [range 0.20–0.55; IQR 0.26–0.44] vs median 0.27 [range 0.11–0.41; IQR 0.20–0.31]; difference of −0.11; 95% CI −0.17 to −0.05; p = .001) and aCMRO2 (median 6.15 AU [range 2.69–12.07; IQR 5.12–7.21] vs. median 4.14 AU [range 1.78–7.86; IQR 3.82–6.31]; difference of −1.76; 95% CI −3.03 to −0.49; p = .009) were significantly higher in the event group (see Figures 2 and 3). Postoperative rcSO2 (median 58.99% [range 44.87–79.1; IQR 54.26–72.61] vs. median 70.94% [range 57.9–86.13; IQR 67.07–76.59]; difference of 10.01; 95% CI 4.13–15.90; p = .002) was significantly lower in the event group compared to the nonevent group.
Regarding the rcFlow, we found a significant increase in both groups comparing the pre- and postoperative values (event group median 421.62 AU [range 190.62–714.17; IQR 383.54–439.67] to median 537.38 AU [range 466.51–935.09, IQR 483.96–636.10]; difference of 160.98; 95% CI 82.07–239.89; p < .001, nonevent group median 431.46 AU [range 291.11–654.86; IQR 370.69–505.10] to median 543.79 AU [range 360.93–929.65, IQR 472.16–688.88]; difference of 143.05; 95% CI 60.67–225.44; p = .001) but no statistically significant difference between both groups. The event group showed a significantly lower postoperative middle arterial blood pressure (MABP) compared with the nonevent group (event group median 41.0 mmHg [range 33.0–69.0; IQR 36.0–42.0] nonevent group median 48.0 mmHg [range 36.0–62.0; IQR 42.0–51.5]; difference of 5.5; 95% CI 0.5–10.5; p = .04).
Postoperative aCMRO2 showed a statistically significant association with the magnitude of perioperative cerebral desaturations (R = 0.605, R2 = 0.365, Adj R2 = 0.347; p < .001, 95% CI 0.35–0.78) as shown in Figure 4.
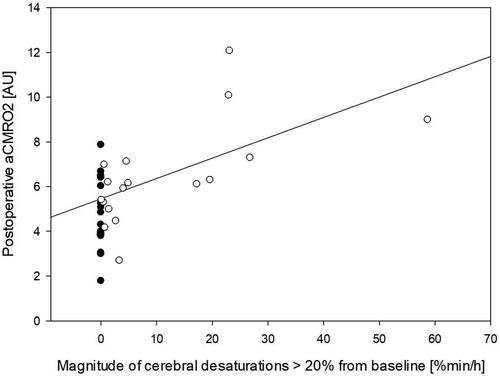
Cerebral desaturations were associated with events with low arterial pressure. In this setting, it was not possible to reliably detect and analyze events with hyperventilation.
4 DISCUSSION
In accordance with Olbrecht et al. we found moderate (21%–30% below baseline) and severe (more than 30% below baseline) cerebral desaturations during neonatal and infant anesthesia.4 However, the incidence of cerebral desaturations in our study (46%) was considerably greater than that observed by Olbrecht (2%), likely related to our patient population being critically ill (ASA III or IV) undergoing major surgery. Even short moderate cerebral desaturations were associated with higher postoperative cFTOE and aCMRO2 values. The aCMRO2 reflects the rate at which O2 is consumed by the brain through metabolic processes and thereby represents a key indicator of normal brain function.13 Exposure of healthy human brain to acute hypoxia seems to alter the cerebral energy metabolism.14 Increase in aCMRO2 might be related to an increased neuronal activity and metabolism as reported in the acute phase of an evolving brain injury.15 The increase of aCMRO2 could indicate an elevated oxidative energy metabolism in the “stressed” brain, due to repair processes.14, 15 In the postoperative course, neonates and infants with elevated CMRO2 therefore could be at an increased risk for additional harm through hypoxia or hypotension and should be monitored closely. Previous studies have reported increased and decreased cerebral oxygen metabolism and CBF after acute hypoxia and ischemia: More severe and longer duration events are associated with decreases whereas less severe and short duration are associated with increases. The findings of Gómez-Pesquera et al. who found an association of decreases in rcSO2 values of less than 20% from baseline with negative postoperative behavior changes on postoperative Day 7 suggest that even mild declines in rcSO2 values may have a negative impact on the neurological outcome and should therefore be avoided.16
The cFTOE reflects the relation between oxygen delivery and consumption in the brain.17 A study on a newborn intensive care unit showed that a cFTOE value above 0.4 is associated with an increased risk of early poor outcome in very preterm infants.5 The median postoperative cFTOE value in our event group (0.41) was significantly higher than in the nonevent group (0.27). The increased cFTOE fits with the decreased NIRS cerebral oxygenation. The NIRS cerebral oxygenation reflects saturation in gas exchanging vessels and correlates with fractional oxygen extraction, which could result from decreased CBF, decreased SpO2, and/or increased oxygen metabolism. Because SpO2 was unchanged and CBF was increased, our data suggest an increase in cerebral oxygen metabolism was the cause. aCMRO2 seems to be more useful in detecting neonatal brain injury in contrast to near infrared spectroscopy measurement of cerebral oxygen saturation alone.15
We observed a significantly lower postoperative MABP in the event group as compared to patients in the nonevent group. There is a lack of a consensus definition for intraoperative hypotension in pediatric anesthesia.18 Studies in neonates with hypoxic–ischemic encephalopathy showed that it is important to maintain MABP within MABPOPT (optimal mean arterial blood pressure), defined by the individualized autoregulation, to reduce brain damage.19, 20 NIRS and O2C monitoring might help define safe MABP values in neonates and infants during major surgery.
Although we found a significant increase of rcFlow in both groups comparing the pre- and postoperative values, there was no statistically significant difference between the event and the nonevent group compared to postoperative cFTOE or aCMRO2. It is possible that the increase in cerebral oxygen consumption is served by an increase in oxygen exhaustion and not by an increase in microcirculation. This could indicate an intact cerebral autoregulation.
The measurement depth is dependent on the distance between the illuminating and detecting elements. In the present study, one single flat probe was applied on the cerebral cortex. The depth of penetration is determined by the emitter-detector separation, wavelength of light, and tissue optical characteristics. Visible wavelength does not penetrate as deep as near infrared light, which penetrates approximately one-half the emitter-detector distance. Because the emitter-detector difference was 15 mm, the dept would be approximately 8 mm. Thus, the CBF and cerebral oxygen metabolism measurements would be contaminated by extra-cerebral tissues, especially in infants. For this reason, the CBF and metabolism data should be viewed with caution.
Our pilot study has some limitations. One limitation is the single-center design and the rather small number of patients. Furthermore, we did not assess cerebral oxygenation metabolism levels later than half an hour after surgery. Therefore, we did not observe at which point cerebral oxygenation metabolism may fully recover in neonates and infants with intraoperative cerebral deoxygenations. However, studies in pediatric cardiac surgery showed that raised cFTOE and CMRO2 after surgery normalized after 24–48 h.12, 21 Another limitation is that the patients' diagnoses, and therefore their operations, varied widely. Also, age and weight differed between the groups although not significantly. This could also explain the lower MABP values in the event group, where the patients were younger and lighter.
Cerebral desaturations are associated with events of low arterial pressure. In this context, future studies on the influence of cerebral autoregulation on cerebral oxygen metabolism should be performed. Furthermore, it is important to continuously record CO2 by means of multimodal monitoring and to investigate its influence on autoregulation and oxygen metabolism.
5 CONCLUSION
Cerebral oxygen desaturation occurs frequently during major surgery in neonates and infants which is associated with early postoperative increased cerebral oxygen extraction and possibly increased cerebral oxygen metabolism.
ACKNOWLEDGEMENTS
Open Access funding enabled and organized by Projekt DEAL.
CONFLICT OF INTEREST STATEMENT
The authors declare no conflicts of interest.
Open Research
DATA AVAILABILITY STATEMENT
The data that support the findings of this study are available on request from the corresponding author. The data are not publicly available due to privacy or ethical restrictions.


