Characterization of infant spinal anesthesia using surface electromyography: An observational study
Work for this study was conducted at the University of Vermont Medical Center in Burlington, Vermont.
Section Editor: Laszlo Vutskits
Abstract
Background
As the risks of general anesthesia in infants become clearer, pediatric anesthesiologists are seeking alternatives. Though infant spinal anesthesia is one such alternative, its use is limited by its perceived short duration. Prior studies investigating infant spinal anesthesia are open to interpretation and may not have accurately characterized block onset or density. Surface electromyography is a passive, noninvasive modality that can measure the effects of neural blockade.
Aims
To quantitatively describe the onset, density, and duration of infant spinal anesthesia using surface electromyography.
Methods
In this observational study, 13 infants undergoing lower abdominal surgery received spinal anesthesia (0.5% bupivacaine with clonidine). Surface electromyography collected continuous data at T2, right T8, left T8, and L2. Data were processed in MATLAB. Onset, density, and duration were defined as the mean derivative within the first 30 s after block administration, the maximum difference in signal compared with preblock baseline, and the time elapsed between block administration and the return of a persistent signal to 50% above the maximum difference, respectively.
Results
Mean patient age and weight were 7.5 ± 2.6 months and 8.0 ± 2.2 kg, respectively. All patients were male. There was a statistically significant difference in the average rate of spinal anesthesia onset (mean percent decrease per second [95% confidence interval]) between myotomes (F (3, 35) = 7.42, p < .001): T2 = 15.93 (9.23, 22.62), right T8 = 20.98 (14.52, 27.44), left T8 = 17.92 (11.46, 24.38), L2 = 32.92 (26.46, 39.38). There was a statistically significant difference in mean surface electromyography signal (mean decibels, 95% confidence interval) across both pre- and postspinal anesthesia Timepoints between myotomes (F (3, 36) = 32.63, p < .0001): T2 = 45.05 (38.92, 51.18), Right T8 = 41.26 (35.12, 47.39), Left T8 = 43.07 (36.93, 49.20), L2 = 22.79 (16.65, 28.92). Within each myotome, there was statistically significant, near complete attenuation of sEMG signal due to spinal anesthesia: T2 mean (pre–post) difference: mean decibels (95% confidence interval) = 39.53 (28.87, 50.20), p < .0001, right T8 = 51.97 (41.30, 62.64), p < .0001, left T8 = 46.09 (35.42, 56.76), p < .0001, L2 = 44.75 (34.08, 55.42), p < .0001. There was no statistically significant difference in mean (pre–post) differences between myotomes. The mean duration of spinal anesthesia lasted greater than 90 min and there was no statistical difference between myotomes. There were also no statistically significant associations between age and weight and onset or duration.
Conclusions
Surface electromyography can be used to characterize neural blockade in children. Importantly, these results suggest that awake infant spinal anesthesia motor block lasts, conservatively, 90 min. This exploratory study has highlighted the potential for expanding awake infant spinal anesthesia to a broader range of procedures and the utility of surface electromyography in studying regional anesthesia techniques.
1 INTRODUCTION
Millions of anesthetics are performed annually for children less than 1 year of age.1, 2 Historically, general anesthesia (GA) has been the primary modality, but previous literature has revealed that GA in neonates and infants is associated with significant complications, including hypoxia, hypotension, and bradycardia.3-5 In fact, infants less than 1 year of age have a threefold higher risk of cardiac arrest than other age groups.6, 7 These concerns have prompted stakeholders in infant perioperative care to seek alternatives to GA, leading to a resurgence of interest in awake spinal anesthesia (SA).
S in infants eliminates the need for airway management, rendering an element of GA that confers its high risk of respiratory complications unnecessary. Additionally, SA avoids the use of GA medications that incur its risk of serious respiratory and cardiovascular events.3, 4 Airway management is rarely required when SA is used, and pharmacologic intervention for hypotension is three times less frequent in infants receiving awake regional anesthesia compared with GA.8
Despite clear benefits of infant SA, its widespread implementation is limited, in part due to the conservative assumptions with regards to its duration. A recent survey of members of the Society for Pediatric Anesthesia revealed that the duration of infant SA is a key reason that GA is selected when SA is an otherwise ideal choice.9 Prior attempts to determine the duration of infant SA have been qualitative, with prior analyses concluding that SA with bupivacaine 0.5% lasts 80 min and up to 110 min with clonidine as an adjunct.10, 11 Unfortunately, these findings have been unable to shift the misconception regarding SA's duration, indicating a need for robust measurement techniques to provide a more precise understanding.12, 13 As such, the goal of this study was to characterize the rate of onset, block density, and duration of infant SA using sEMG.
2 METHODS
This prospective, observational study was approved by the Institutional Review Board at the University of Vermont. Written informed consent was obtained from the parents of each patient. This manuscript adheres to the applicable Strengthening the Reporting of Observational Studies in Epidemiology (STROBE) guidelines.
2.1 Participants
Patients were recruited from April 2022 to October 2022 at the University of Vermont Medical Center. Inclusion criteria included patients less than 1 year old undergoing lower abdominal surgery. Exclusion criteria were known spinal column/cord abnormalities or allergies to bupivacaine, clonidine, or adhesive. Patients were included if SA was selected as the anesthetic technique by the attending anesthesiologist in consultation with the surgeon based on patient and surgical factors. Patients were screened using their patient charts prior to being approached for recruitment. Patient characteristics such as age, sex assigned at birth, weight at time of surgery, gestational age at birth, and American Society of Anesthesiology (ASA) physical classification were recorded. Because there was only a single patient group, blinding was not indicated.
2.2 Spinal anesthesia protocol
Single-shot SA was administered as 0.5% isobaric bupivacaine, 1 mg/kg to a maximum of 6 mg (1.2 mL maximum total volume) with clonidine 1 mcg/kg at the level of L3/L4 or L4/L5 per routine clinical practice at the University of Vermont. Clonidine is used for the majority of infant SA in our practice because the addition of clonidine is known to extend the duration of infant SA.13 Per routine clinical practice, lidocaine-prilocaine 2.5%–2.5% (EMLA) topical cream was placed over the puncture site at least 30 min prior to SA administration. The patient was in the upright, seated position during SA administration and then repositioned supine for the rest of the procedure. When present, a resident anesthesiology physician performed the first attempt at SA administration. If the resident physician failed, the attending anesthesiologist performed the SA. SA needle size was determined by the administering physician. Intravenous access was obtained in the lower extremity after SA administration. If the infant remained too active for the surgery to proceed safely after SA placement and non-pharmacologic soothing (e.g., pacifier, music) was unsuccessful, oral sucrose and/or intravenous dexmedetomidine (2–4 mcg) was administered at the discretion of the attending anesthesiologist. The need for and timing of dexmedetomidine was recorded after administration.
2.3 Surface electromyography
Surface electromyography (sEMG) signal was recorded using a four-channel Nihon Kohden Neuropack S3. Detailed device settings can be found in Appendix S1. Self-adhesive surface electrocardiography electrodes were attached to the patient at three distinct myotomal levels in the preoperative area. The electrode pairs were assigned to the following myotomes and locations: thoracic level two (T2) right pectoralis major, thoracic level eight (T8) right (T8R) and left (T8L) external oblique, and lumbar level two (L2) right rectus femoris (Figure S1). The myotomes studied were selected with the goal of obtaining a broad impression of the extent of blockade in infant SA as well as anatomical order in which the blockade was expected to progress and recede. For example, the T2 myotome level was selected to assess whether SA is associated with blockade above the xiphoid process (which we have observed in our clinical practice). Two T8 electrode pairs were used to assess symmetry and lend a greater degree of validity to the data.
Data collection was begun in the preoperative area. Throughout data collection, any relevant anesthetic or surgical events that occurred (e.g., electrocautery use, patient activity, medication administration) were recorded. A dedicated research team member with no other responsibilities was present throughout the entire study to record these observations and ensure sEMG signal collection integrity. The research team member would engage the parents and perioperative staff to assist them in maintaining appropriate electrode-to-skin connection. Data collection was continued into the post-anesthesia care unit (PACU) until the restoration of any lower extremity motor function that correlated with an increase in L2 myotome sEMG signal. Changes in sEMG signal were observed by the research team member, and observation of motor function was observed by the research team member, PACU nurse, and parent. If particular circumstances (e.g., emergence delirium or parental request) rendered this endpoint impossible, the recordings were ceased early and documented.
2.4 Data processing and analysis
Surface electromyography data were processed using MATLAB 2022b (The MathWorks Inc.). All analyses were preplanned prior to data examination. Detailed data-processing methodology can be found in Appendix S1. All processing and analytic codes used are available upon reasonable request.
Spinal anesthesia rate of onset was determined by calculating the derivative in signal from time of SA administration to the first local minimum in each myotome channel within a 30 s window after SA administration. The lowest sEMG value compared with pre-SA baseline signal values represented the maximum effect of SA. The duration endpoint for SA per myotome was determined as the time at which the sEMG signal recovered to 50% of the maximum difference sEMG signal and never decreased below that level for the rest of the case. This duration endpoint was then used to calculate the duration of SA per myotome channel. The primary outcomes of the study were the rate of onset of SA by myotome, block density of SA by myotome, and the duration of SA by myotome. Secondary outcomes included onset and duration of SA in relation to age and weight, and onset and duration of SA based on ASA status and procedure type.
2.5 Statistical analysis
To test for significant differences in mean onset, block density, and duration of sEMG signal between myotomes and to test for significant associations between age, weight, procedure, and ASA status and onset or duration, linear mixed effect models were used. Linear regression analyses were also done to test for significant associations between age and weight and onset or duration within each myotome. None of the outcome measures analyzed were found to have a statistically significant non-normal distribution. Results for post hoc analyses such as pairwise comparisons were corrected for multiple comparisons using a Bonferroni correction.
All statistical analyses were performed using SAS version 9.4 statistical analysis software (SAS Institute, Inc.). Statistical significance level alpha for all analyses was set a priori at 0.05. For a more detailed description of statistical analysis, please refer to Appendix S1.
3 RESULTS
Thirteen patients were recruited for the study. The mean age was 7.0 months (standard deviation [SD] ± 2.6, range = 3–11). Among premature infants (n = 3), the postconceptual average age was 7.3 months (SD ± 2.1, range = 5–9). The average weight was 8.0 kg (SD ± 2.1, range = 3.1–10.7). All patients were male and presenting for urologic procedures or bilateral inguinal hernia repair. Data collection began preoperatively in every patient. All SA attempts were successful, though some required more than one puncture attempt. Eight SA administrations were performed by resident anesthesiology physicians and five were performed by anesthesiology attending physicians. Of the latter five, only one was after two failed attempts by the resident physician. Four SA administrations were performed at the L3–L4 level and nine were performed at the L4–L5 level. Only one patient required preoperative oral midazolam (20 mg). Low-dose dexmedetomidine (2–4 mcg IV) was administered in four patients (30%). No patients required conversion to GA. No patients experienced significant hemodynamic or respiratory complications due to SA. No patients were withdrawn from the study as a result of protocol violations.
Analyses of age, weight, procedure type, and ASA status individually versus each outcome did not show statistically significant effects. In addition, analyses conducted with all of these variables included in the models as covariates showed very similar results to the models without covariates. Due to these findings, the results presented are for analyses using models without these covariates.
3.1 sEMG tracings
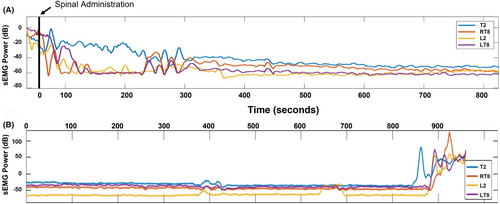
Figure 1 shows a representative trace for SA onset and resolution in one patient in order to visualize a case that reflects the typical appearance of sEMG activity in this cohort. Temporary upward deflections in power reflect artifact (e.g., patient movement/repositioning and electrocautery use). The sEMG signal tracings revealed a visually apparent decrease in sEMG power after block administration (1A) and resolution of the block at the end of the case (1B). As expected, substantially more time was required for sEMG signal to achieve its maximum effect at T2 as is anatomically expected for intrathecal local anesthetic administered at L3-4/L4-5. Similarly, at L2 the greatest attenuation in sEMG signal is seen. Eventually, sEMG signal at each myotome decreased to a level similar to their baseline values.
3.2 Primary outcomes
3.2.1 SA initial rate of onset
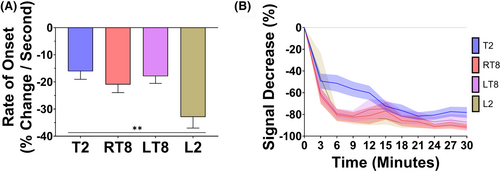
To determine the goodness of fit for the onset derivative model, the average normalized root mean-squared error (NRMSE) was calculated for each myotome. The NRMSE for initial onset ranged between 0.54% and 0.93% (Table S1), indicating that there was less than 1% error between the average onset calculation and the actual data. Figure 2A shows the rate of onset of infant SA by myotome. Overall, there was a statistically significant difference in mean rates of onset across all myotomes (F (3, 35) = 7.42, p < .001, Figure 2A). The average rates of spinal anesthesia onset (mean percent decrease per second, 95% confidence interval [CI]) for each myotome were T2 = 15.93 (9.23, 22.62), right T8 = 20.98 (14.52, 27.44), left T8 = 17.92 (11.46, 24.38), L2 = 32.92 (26.46, 39.38). Pairwise comparisons showed statistically significant differences between L2 and T2 (mean difference = 17.00, 95% CI: [8.86, 25.13], p = .001), between L2 and LT8 (mean difference = 15.00, 95% CI: [7.05, 22.95], p = .003) and between L2 and RT8 (mean difference = 11.94, 95% CI: [3.99, 19.89], p = .03). Additionally, the rate of onset for infant SA at each myotome was consistent with anatomical expectations. Figure 2B characterizes the average rate of sEMG signal decrease over the first 30 min for each myotome. There was a reproducible decrease in sEMG signal across all myotomes in all patients within the first 30 min after SA administration (Figure 2B).
3.2.2 SA block density
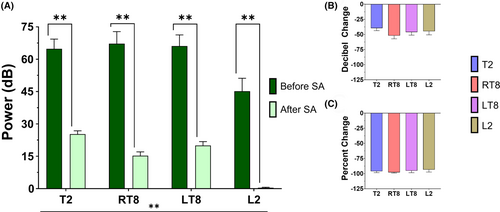
The change in sEMG signal before and after SA is shown in Figure 3. Overall, there was a statistically significant difference in mean sEMG signal (mean decibels, 95% CI) across both pre- and postspinal anesthesia timepoints between myotomes (F (3, 36) = 32.63, p < .0001): T2 = 45.05 (38.92, 51.18), right T8 = 41.26 (35.12, 47.39), left T8 = 43.07 (36.93, 49.20), L2 = 22.79 (16.65, 28.92) (Figure 3A). In addition, there were statistically significant decreases in sEMG power at each myotome (T2 mean [pre–post] difference = 39.53, 95% CI: [28.87, 50.20], p < .0001; RT8 mean [pre–post] difference = 51.97, 95% CI: [41.30, 62.64], p < .0001; LT8 mean [pre–post] difference = 46.09, 95% CI: [35.42, 56.76], p < 0.0001; L2 mean [pre–post] difference = 44.75, 95% CI: [34.08, 55.42], p < .0001). The differences in sEMG signal before and after anesthetic administration were not statistically different when comparing myotomes, but all decibel values represented a near complete attenuation of sEMG signal when converted into scalar percent decrease (Figure 3B).
3.2.3 SA duration
Figure 4 illustrates the sEMG duration of infant SA across myotomes. Mean SA block duration was not statistically or clinically different between myotomes: T2 = 93.78, 95% CI: (78.73, 108.82, 108.85); right T8 = 94.21, 95% CI: (79.17, 109.26); left T8 = 93.06, 95% CI: (78.03, 108.09); L2 = 94.39, 95% CI: (79.32, 109.46) (Figure 4A). Though some patients demonstrated a time to 50% resolution of block that was <90 min, no patient had a block that reached 50% resolution in less than 60 min. The histogram of durations in Figure 4B was normally distributed, with all statistical test models providing nonsignificant p values. There were 2–5 patients (15%–33%), depending on myotome, that did not achieve the stated endpoint (Figure 4B), suggesting a duration longer than 90 min. The number of patients with durations <90 min, >90 min, or undetermined was not significantly different between myotomes.

3.3 Secondary outcomes
3.3.1 Associations between age, weight, procedure, and ASA status and SA onset/duration
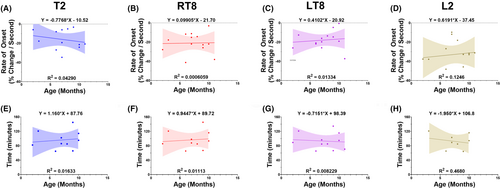
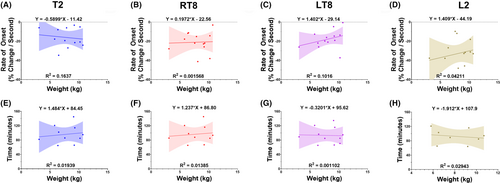
Figures 5 and 6 demonstrate the linear regressions between infant SA onset and age/weight (Figure 5) and sEMG duration and age/weight (Figure 6). There were weak, nonstatistically significant associations between age and weight and onset or duration (Figures 5 and 6). Figure S2 shows mean myotomal onset and duration by procedure type and ASA classification. The mean rate of onset (percent decrease per second) for circumcisions = 18.32, 95% CI: (11.52, 25.12), noncircumcision penile surgeries = 27.11, 95% CI: (20.16, 34.06), and other surgeries = 20.35, 95% CI: (11.57, 29.13) (Figure S2A). Mean duration (min) for circumcisions = 76.95, 95% CI: (51.08, 102.83), noncircumcision penile surgery = 105.66, 95% CI: (79.81, 131.51), and other surgeries = 100.25, 95% CI: (70.40, 130.10) (Figure S2B). Mean rate of onset (percent decrease per second) for ASA 1 = 23.17, 95% CI: (17.51, 28.83) and ASA 2–3 = 19.69, 95% CI: (11.28, 28.09) (Figure S2C). Mean duration (min) for ASA 1 = 91.95, 95% CI: (70.27, 113.62) and ASA 2–3 = 96.91, 95% CI: (68.25, 125.57) (Figure S2D).
4 DISCUSSION
This study has three main findings. First, sEMG is an effective means of measuring infant SA rate of onset, density, and duration. Second, infant SA as evaluated with sEMG has a rate of onset and density that is consistent with clinical observations and has a longer duration than was expected. Finally, contrary to expectation, age and weight did not significantly influence onset or duration of infant SA.
The present study provides proof-of-concept for the use of sEMG as a non-invasive, cost-effective, high temporal resolution monitor for observations of regional and neuraxial anesthetics. The inclusion of left and right T8 also provided further validity to the results obtained, as differences between the two sides were nonsignificant for every variable. Additionally, SA onset demonstrated clinically expected differential values across myotomes according to local anesthetic spread in the cerebrospinal fluid: the rate was slowest at T2 and fastest at L2. These myotomal differences lend further credibility to the use of sEMG as a valid monitoring device.
While sEMG signal does not directly measure the onset or duration of sensory blockade, onset of motor blockade is an appropriate surrogate because it occurs after the onset and before the resolution of sensory block.14 Therefore, it can be inferred that the onset and duration values for SA's sensory block would be faster and longer, respectively, than the recorded values in this study.
The data contained herein confirm that infant SA has an extremely rapid onset of action. Previous literature in children aged 0–13 years old who received SA demonstrated an onset of block in 2.34 ± 0.19 min, measured by loss of sensitivity.15 Based upon the rapidity with which muscle activity diminished after SA administration, it can be concluded that the onset of sensory blockade in infants and neonates is even faster than previously assumed. These findings confirm and quantify previous clinical observations that infant SA onset is near instantaneous, and highlight the inherent limitations of observational metrics.
This study revealed new information regarding the extent to which infant SA spreads in the cephalad direction. Prior studies have demonstrated the average highest myotome blocked during infant SA to be T6, with a range of T9–T4 using subjective measurements.15 However, the decrease in sEMG signal consistently achieved at T2 in this study suggested that infant SA established a much higher block than previously believed. This is further supported by the absolute power and percent decrease in T2 block being comparable to the lower myotomes. Though clinical observation makes clear that infant SA provides profound, surgical anesthesia, these results provide the first measure of SA density.
Infant SA with clonidine had an average duration of at least 90 min across all measured myotomes. Notably, several patients were not included in the calculation because their sEMG signal never achieved endpoint criteria. This implies that the duration of infant SA is substantially longer on average than reported. Previously published durations of infant SA have been highly variable.10, 12 These findings are likely due to heterogeneity of research methodology and vagaries in the interpretation of subjective measures of regional blockade. The present study provides a much-needed measure of infant SA duration that is based on the persistence of sEMG signal attenuation. The sEMG duration represents a strongly conservative estimate that infant SA provides at least 90 min of surgical anesthesia and suggests that motor/sensory block duration is longer. Infant SA, therefore, could be appropriate for a much wider range of pediatric surgeries that have been previously excluded due to underestimations of SA duration. The findings of the present study should prompt reevaluation of infant SA's limitations and assumptions and motivate further study.
Surprisingly, this study indicated that age and weight had weak, statistically nonsignificant associations with infant SA onset and duration. Magnetic resonance imaging has described a positive linear association of 2 mL/kg between weight and cerebrospinal fluid (CSF) volume in the spinal cord in neonates up to 60 weeks old.16 Therefore, in this patient cohort, the anesthetic volume administered for patients weighing less than 5 kg was approximately 10% of the total spinal cord CSF volume. For patients greater than 5 kg, 1.2 mL of maximum allotted anesthetic volume represented approximately 5.6%–10.2% of the spinal cord CSF volume. Despite these volumetric differences, the present study did not demonstrate a strong association between weight and duration of block. While it is challenging to assess correlations in a small cohort, this finding suggests that there may be flexibility in infant SA dosing parameters that extend beyond weight. This is in congruence with recent findings of a linear relationship between height and CSF volume versus a curvilinear relationship between weight and CSF volume.17 Larger, prospective, and randomized studies with more statistical power will be needed to confirm these findings.
The present study demonstrates that sEMG is a powerful tool that can be used to study infant SA. Future studies will further characterize infant SA, including investigations that will aid in the understanding of differences between local anesthetics and adjunctive medications. sEMG also provides an avenue to examine different dose parameters to ascertain what factors would allow for a lower dose, thereby reducing local anesthetic exposure. The overall goal of these endeavors is to construct a more patient-centric, personalized infant SA plan, thereby increasing safety in this vulnerable population. Importantly, this methodology can also extend beyond infant SA and be applied to other regional anesthetic techniques in both pediatric and adult patients.
This observational study analyzed a small number of participants, limiting the generalizability of the findings. Due to the small sample size, the results presented were from models without covariates included. Although, as stated above, it was notable that potential confounding factors were not significantly associated with the primary outcomes. With all patients being male, it is important to note that our results should not be generalized to all infants until further study is completed. Future studies will include more participants and will emphasize the potential associations of age, sex, intraoperative medications, prematurity, and other variables that may influence overall sEMG signal. Due to the novelty of using sEMG in the perioperative setting, future studies should examine the methodology to find areas for improvement. The use of cervical (e.g., more cephalad) electrode placement could provide more detail into the height and resolution of infant SA. In addition, the study's endpoint criteria did not provide detailed correlations between sEMG signal and subjective, clinical analyses of sensory and motor block resolution. Future studies will continue to optimize perioperative sEMG methodology to analyze sEMG signals with subjective test scores. Finally, per institutional practice, each patient received the same concentration of intrathecal bupivacaine with clonidine. Future studies will include patients who receive bupivacaine alone to determine the effect of clonidine addition on infant SA, and other cohorts will be added to assess differences between different concentrations of local anesthetics.
Due to this study being the first of its kind, sources of artifactual data were unknown. Future studies will continue to document sources of signal artifact as they appear to ensure rigorous monitoring and analysis. In this study, electrocautery was a notable source of artifactual data due to iatrogenic signal interference. Research study staff were diligent in noting periods of electrocautery to identify peaks in sEMG signal that correlated with electrocautery. Pressure on electrode leads, usually due to repositioning, also appeared to cause artificial elevations in sEMG signal, indicating a necessity in future studies to be attentive to electrode integrity. If intraoperative sEMG were to be applied clinically, these devices would require the ability to distinguish between pressure on leads rather than elevated activity of the muscle to avoid a false positive impression of block resolution. In contrast, the administration of neuromuscular blocking drugs renders the sEMG approach to monitoring neural blockade impossible. Any use of this medication class eliminates the ability to use sEMG as a neural blockade device. This may be important when considering protocols for sEMG monitoring to assess general anesthesia cases with the addition of a caudal block in pediatric patients. Future studies must be diligent in their documentation of artifact sources and areas of potential false positives/negatives to construct a robust methodology for future sEMG use.
5 CONCLUSION
This study's use of sEMG was a novel approach that provided greater insight into infant SA characteristics. Namely, onset is faster than previously stated, blockade is achieved as high as the T2 myotome, and duration is greater than historically documented. sEMG should be considered a powerful tool that can be used to measure the effectiveness and duration of other modalities of regional blockade in patients of all ages. This study was limited by a small sample size. Future aims include recruitment of a larger number of patients, analyzing different local anesthetics, and including different neural blockade techniques.
AUTHOR CONTRIBUTIONS
Samuel J. Aldous was responsible for patient screening and recruitment, data collection, data analysis, and manuscript construction. Dylan T. Casey and Michael DeSarno were responsible for data analysis and manuscript preparation. Emmett E. Whitaker was responsible for design of the study, overall supervision of study activities, data analysis, and manuscript preparation.
ACKNOWLEDGMENTS
We gratefully thank Robert Greenberg, MD and Wayne Sternberger, PhD for contributing their expertise and guidance to this study and to Nihon Kohden for providing the sEMG device used in this study. We also thank the University of Vermont Medical Center perioperative staff for their invaluable support throughout the entire study period.
FUNDING INFORMATION
This study was supported internally by departmental sources.
CONFLICT OF INTEREST STATEMENT
None to declare.
ETHICS STATEMENT
This study was reviewed and approved by the Institutional Review Board of the University of Vermont.
PATIENT CONSENT STATEMENT
Written informed consent was obtained from the parents of each patient.
Open Research
DATA AVAILABILITY STATEMENT
The data that support the findings of this study are available from the corresponding author upon reasonable request.


