Monitoring anesthesia depth with patient state index during pediatric surgery
Section Editor: Nada Sabourdin
Abstract
Background
Monitoring anesthesia depth in children is challenging. Pediatric anesthesiologists estimate general anesthesia depth using indirect methods such as pharmacokinetic models and neurovegetative reflexes. The application of processed electroencephalography may help to identify the correct anesthesia depth (i.e., patient state index between 25 and 50).
Aims
To determine the median values of patient state index and spectral edge frequency 95% in children undergoing general anesthesia conducted according to indirect evaluation of depth. The relationships between patient state index and spectral edge frequency 95% and indirect monitoring of anesthesia depth, type of anesthesia, age subgroups, and postoperative delirium were also assessed.
Methods
A prospective observational study on children (aged 1–18 years) undergoing surgery longer than 60 min. The SedLine monitor and the novel SedLine pediatric sensors (Masimo Inc., Irvine California) were applied. Patient state index levels were recorded for the duration of the anesthesia until the discharge to the ward at predefined time points.
Results
In the 111 enrolled children, median patient state index level at the end of anesthesia induction was 25 (22–32) and ranged from 26 (23–34) to 28 (25–36) in the maintenance phase. Patient state index at extubation was 48 (35–60) and 69 (62–75) at discharge from the operatory room. Median right/left spectral edge frequency 95% values at the end of induction were 10 (6–14)/9 (5–14) Hz and median right/left spectral edge frequency 95% values in the maintenance phase ranged from 10 (6–14) to 12 (11–15) Hz in both hemispheres. At extubation, right/left spectral edge frequency 95% levels were 18 (15–21)/17 (15–21) Hz. We observed 39 episodes of burst suppression in 20 patients (19%). Median patient state index levels were not different between patients undergoing inhalational and intravenous anesthesia and between those undergoing general anesthesia and general anesthesia added to locoregional anesthesia. Children <2 years displayed significantly higher patient state index levels than older patients (p = .0004). The presence of a burst suppression episode was not associated with PAED levels (OR 1.58, 95% CI 0.14–16.74, p` = .18).
Conclusions
NonpEEG-guided anesthesia in children led to median patient state index levels at the low range of recommended unconsciousness values with frequent episodes of burst suppression. Patient state index levels were generally higher in children below 2 years.
1 INTRODUCTION
General anesthesia (GA) is essential for reducing the stress associated with surgical procedures and managing pain. Its depth must be adapted to the type of surgery and to the individual need of patient. The achievement of the correct depth of anesthesia in children is crucial to deliver the correct dose of anesthetic drugs, and to reduce the side effects of anesthesia, such as hemodynamic instability1 and emergence delirium,2 or to avoid inadequate anesthesia, and the risks of intraoperative awareness. As a matter of fact, clinicians try to adapt the anesthetic administration through “indirect” parameters, such as pharmacokinetic models—including minimum alveolar concentration (MAC) of halogenated vapors,3 and propofol effect site concentration (Ce)—, and neurovegetative reflexes—such as heart rate and blood pressure.4, 5 However, these methods do not consider pharmacogenomics that imply different drug doses required by different patients.6 Furthermore, circulatory responses are prevalently secondary to nociception, anesthetic drug effects on heart function and vascular tone, surgical manipulation, and patients' volemia. In children, all these variables imply that a wide variation of anesthetic dosing may be required.7
On the other hand, it is technically possible to directly monitor the effects of inhalation and/or intravenous anesthesia on brain electric activity with the application of processed electroencephalography (pEEG). The rational of pEEG is to provide a simplified method to monitor depth of anesthesia through the rapid interpretation of frontal electroencephalogram (EEG). The pEEG in adults has been strictly related to anesthesia depth and specific electroencephalographic patterns and spectrograms (signatures) are currently recognized for propofol and halogenates.8 The application of pEEG-guided anesthesia in children has been reported only in few studies.4, 9 This is because this technology is not routinary applied in pediatric anesthesia and the use of dedicated pediatric devices is still on a development phase.4, 9-12 However, if feasible, a pEEG-guided anesthesia might contribute to optimally target anesthesia depth. The Root® and SedLine® monitor (Masimo Inc.) and the novel SedLine pediatric sensors (Masimo Inc.) can be applied as a pEEG monitor in children. This monitor displays four channels of unprocessed EEG (L1, R1, L2, and R2—equivalent to Fp1, F7, Fp2, and F8 according to a standard EEG monitoring system), electrode impedance, patient state index (PSI), left and right spectral edge frequency (SEF95), burst suppression (BS) rate, and electromyography. PSI is an adimensional index of anesthesia depth calculated by the SedLine algorithm that combines “weighted quantitative EEG parameters reflecting many dimensions of brain electrical activity such as: (1) changes in power in various EEG frequency bands; (2) changes in symmetry and synchronization between critical brain regions; and (3) the inhibition/activation of regions of the frontal cortex”.13 SEF95 is the frequency below which the 95% of the total power is represented in a specific epoch. The correct anesthesia depth is indicated by the manufacturer as a PSI value between 25 and 50. It is currently unknown if this threshold applies to children and what is the level of PSI in children whose GA is conducted according to indirect evaluation of depth.
The aim of our study was to determine the median values of PSI and SEF95 during GA in children undergoing noncardiac surgery. The relationship of PSI and SEF95 with pharmacokinetic models and hemodynamics, type of anesthesia, age subgroups, and postoperative delirium were also assessed.
2 METHODS
A prospective observational study was conducted on consecutive children undergoing noncardiac surgery at the Meyer Children's Hospital, Florence, Italy, from November 2021 until July 2022. Inclusion criteria were age between 1 and 18 years and the requirement of GA with the placement of laryngeal mask airway or endotracheal tube (ET), with or without the addition of locoregional anesthesia (LRA). Exclusion criteria were duration of surgical procedure <60 min, history of severe neurologic abnormalities or antiepileptic therapies, intraoperative ketamine administration, suboptimal sensors impedance (as indicated by the Root), and postanesthesia admission to the pediatric intensive care unit (PICU) under continuous sedation. The Hospital Ethics Committee (Comitato Etico Regionale per la Sperimentazione Clinica della Regione Toscana) approved the study (n. 310/2022). Informed consent was obtained from all patients' parents. Furthermore, patients between 7 and 13 years and patients older than 14 years had the possibility of receiving a dedicated (additional) consent form. The reporting of this cohort study conforms to Strengthening the Reporting of Observational Studies in Epidemiology statement.14
After the skin had been prepared with alcohol, the probe was placed on the patient's forehead. This procedure was performed just before anesthesia induction in collaborating patients or soon after induction in case the patient needed to be sedated first. The SedLine monitor, and the novel SedLine pediatric sensors were utilized in all patients. PSI levels were recorded for the duration of the anesthesia until the discharge to the ward at predefined time points: “awake”, when the “ET or laryngeal mask airway placement” maneuver started, and every 15 min thereafter up to 120 min, at “patient extubation” and at the time of “operatory room discharge” by researchers who were not directly involved in the anesthetic management (SC, LG, AB, CR). At the same time points, left and right SEF95 values, BS events, systolic, diastolic, and mean blood pressure (MBP), heart rate, respiratory rate, and pulse oximetry were also recorded. Hypotension episodes were identified according to intraoperative blood pressure thresholds in relationship to age- and sex-adjusted reference values for children undergoing anesthesia.15 Propofol induction dose and Ce, sevoflurane endtidal concentration (exp sevo%), MACage levels, airway management, administration of opioids (i.e., fentanyl and remifentanil), midazolam, and local and/or regional anesthesia (e.g., ropivacaine and bupivacaine) were recorded. The Pediatric Anesthesia Emergence Delirium (PAED) score16 was calculated and recorded before patients were discharged from the operatory room. A score ≥12 was considered as diagnostic of emergence delirium.
Operators were not trained in the utilization of SedLine but this monitor was unblinded. Anesthesia was conducted by the anesthesiologists according to institutional standards and personal choice, without considering SedLine values. The selection between inhalational (INHAL) and target-controlled infusion (TCI) anesthesia, in addition to the choice of applying an LRA (whether neuraxial and peripheral), were left to the attending anesthesiologists.
The primary aim of our prospective observational study was to determine the median values of PSI and SEF95 values during GA conducted according to indirect evaluation of depth.
The secondary aims were to study the relationship between SEF95 and PSI, to assess the number of BS episodes during GA, to evaluate the correlation of PSI with MAC/endtidal sevoflurane, propofol Ce, MBP, and postanesthesia delirium through the PAED score. We also compared the PSI values in patients who underwent LRA versus those who did not, the PSI values in patients who underwent INHAL versus those who received TCI, the PSI and SEF95 values in subgroups of different ages (i.e., <2, 2–5, 5–10, and >10 years). The correlations between PSI and MAC/endtidal sevoflurane and between PSI and propofol Ce were analyzed at anesthesia steady-state (i.e., >15 min from induction).
We decided to enroll 100 patients as an explorative sample, provided that all predefined age subgroups were represented at the same proportion of routine activity at our hospital. Predicting a 10% dropout, we planned to enroll 110 patients before analyzing the results. Patients with surgery unexpectedly lasting <60 min were included in the analysis.
2.1 Statistical analysis
All data are presented as median (interquartile range). Mann–Whitney test was used to assess the differences between variables. Pearson correlation was applied to verify the association between continuous variables and logistic regression was utilized in case of dichotomic variables. One-way analysis of variance, two-way analysis of variance, and mixed-effects analysis were performed to analyze the differences over time between continuous variables. Tukey's multiple comparisons posthoc test was conducted to assess differences between groups at single time points. A p-value of <.05 was considered statistically significant. Statistical analysis was performed using the GraphPad Prism 9.0 software package (GraphPad Software).
3 RESULTS
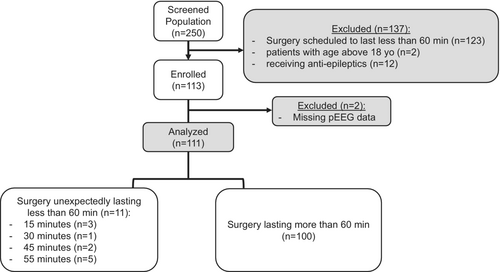
Overall, in the study period, 250 patients were screened for inclusion. Of these, 123 were excluded because scheduled surgeries were estimated to last <60 min, 2 patients' ages were > 18 years, and 12 were receiving antiepileptic drugs at the time of surgery. At the end, 113 patients were enrolled and after the exclusion of 2 children for pEEG missing data, a final sample of 111 patient was included in the analysis (Figure 1). Descriptive data of the enrolled patients is presented in Table 1. Baseline vital parameters before induction are depicted in Table 2. PSI was recorded before anesthesia induction in 65 patients (58%).
| Total # | 111 |
|---|---|
| Median age (years) | 10 (6–13) |
| Gender (F/M) | 42/66 |
| Age groups (yo) | 1–2: 10 |
| 2–5: 25 | |
| 5–10: 36 | |
| >10: 40 | |
| ASA | I: 74 |
| II: 33 | |
| III: 4 | |
| Surgery type | Abdominal surgery: 34 |
| Orthopedic surgery: 48 | |
| Thoracic surgery: 10 | |
| Urology: 16 | |
| Surgery duration (hours) | 2.1 (1.3–3.2) |
| Comorbidities (y/n) | 23/85 |
| GA/GA+LRA | 35/73 |
| ET/laryngeal mask airway | 57/51 |
| Inhal/TCI | 92/19 |
- Abbreviations: ASA, American society of anesthesiologists; ET, endotracheal tube; GA, general anesthesia; Inhal, inhalational anesthesia; LRA, locoregional anesthesia; TCI, target-controlled infusion.
| HR (bpm) | 104 (87–119) |
|---|---|
| SpO2% | 100 (99–100) |
| SBP (mmHg) | 113 (97–122) |
| DBP (mmHg) | 60 (50–69) |
| MBP (mmHg) | 74 (65–85) |
| PSI | 96 (93–100) |
| SEF95 L | 20.4 (15–25) |
| SEF95 R | 19.8 (14–25) |
- Abbreviations: DBP, diastolic blood pressure; HR, heart rate; MBP, mean blood pressure; PSI, patient state index; SBP, systolic blood pressure; SEF95 L, left spectral edge frequency 95%; SEF95 R, right spectral edge frequency 95%; SpO2: pulse-oximeter oxygen saturation.
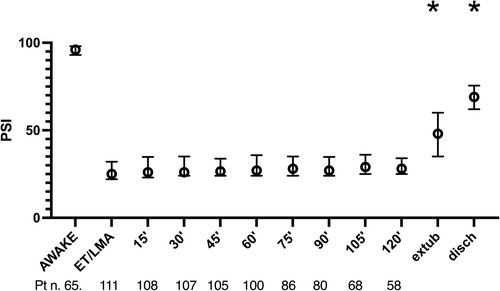
PSI at ET/laryngeal mask airway placement was 25 (22–32) and median values over the maintenance phase ranged from 26 (23–34) to 28 (25–36). PSI at extubation was 48 (35–60) and 69 (62–75) at discharge from the operatory room (p < .0001 at mixed-effects analysis, with significant differences at extubation and operating theater discharge) (Figure 2).
No episodes of hypotension were observed in the sampled population, and we found no correlation between MBP and PSI levels (r: .03, 95% CI −0.04 to 0.12, p = 0.36). Median right/left SEF95 values at induction were 10 (6–14)/9 (5–14) Hz and median right/left SEF95 values over maintenance phase ranged between 10 (6–14) and 12 (11–15) Hz in both hemispheres. At extubation, right/left SEF95 levels were 18 (15–21)/17 (15–21) Hz. No significant differences were found between right and left SEF95 at any time point, and we decided to analyze only right SEF95. Correlation between PSI and right SEF95 was 0.74 (95% CI 0.71–0.77), p < .0001. The time from induction to ET placement was 8 (7–10) min, and time for laryngeal mask airway positioning was 5 (4.5–8) min (p = .0036). The time from induction to ET placement showed no correlation with the PSI value, r: .16 (95% CI −0.23 to 0.51), p = .41. Similarly, no correlation was evident for the time from induction to laryngeal mask airway positioning, r: .31 (95% CI 0.62 to 0.08), p = .11.
We observed 39 episodes of BS in 20 patients (19%) that were distributed prevalently during intubation/laryngeal mask airway placement (n. 20) and in the first 15 min (n. 11).
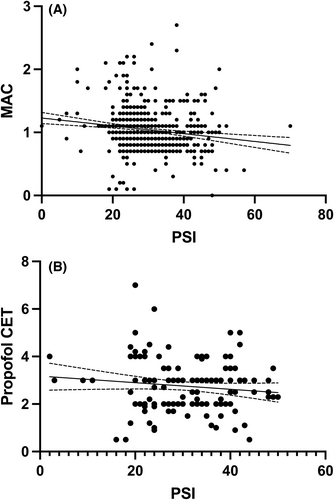
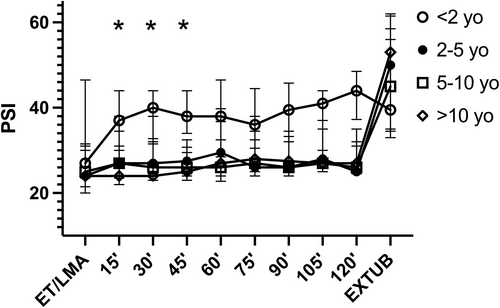
The correlation between PSI values and exp sevo% at steady state was r = −.22 (95% CI −0.30 to −0.14), p < .0001 and the correlation of PSI and MACage was r = −.20 (95% CI −0.28 to −0.13), p < .0001 in patients undergoing INHAL (Figure 3A). The correlation between PSI values and propofol Ce at steady state was −0.05 (95% CI-0.21 to 0.11), p = .54 in patients receiving TCI anesthesia (Figure 3B). PSI levels, over time, did not show significant differences between INHAL versus TCI (p = .06) and between GA versus LRA-GA (p = .63). Age groups were distributed as follows: <2, 12 patients; 2–5, 14 patients; 5–10, 31 patients; and >10, 54 patients. Although no difference was evident in median MACage levels withing age subgroups undergoing INHAL (p = .63), a difference was found in PSI levels after stratification for age groups (p = .0004), with median PSI levels at age <2 years being significantly higher, compared to other age groups, at 15-, 30-, and 45-min time points (Figure 4). Right SEF95 showed a nonsignificant difference after stratification for age groups (p = .07), with median right SEF95 levels at age <2 years old being generally higher, with respect to other age groups, at 45-, 60-, and 75-min time points (Figure S1).
At discharge from operatory room, patients showed a median PAED score of 11.10-12 The presence of a BS episode was not associated with the PAED levels (OR 1.58, 95% CI 0.14–16.74, p = .18). Shorter surgeries were associated with higher PAED levels (r: −.36, 95% CI −0.55 to −0.13, p = .0025), and lower PSI at extubation (r: −.46, 95% CI −0.62 to −0.27, p < .0001).
4 DISCUSSION
The key findings of this study are that in a cohort of children undergoing surgery, anesthesia induction and maintenance conducted according to standard indirect signs of depth seemed to be characterized by median PSI levels between 25 and 28, in the low range of commonly suggested limits of “unconsciousness” (i.e., 25–50).4
To our knowledge, this is the first pediatric study that has attempted to provide monitoring of anesthesia conducted according to standard of care by using pEEG. In this light, the lack of a linear correlation of MAC, exp sevo%, and Ce with PSI values showed that anesthesia guided by indirect signs indeed correctly targeted anesthesia depth (i.e., some patients had low PSI levels with low anesthetic doses). However, the “clinical” target corresponded generally to a low PSI (close to the lower “recommended” level of 25), which, in some cases, could have been less profound (i.e., in patients with neuraxial anesthesia). Moreover, the described correlation between anesthetic doses and anesthesia-EEG-patterns could support the importance of pharmacogenomics in anesthesia as already found in adults.6
Furthermore, considering that at ET/laryngeal mask airway placement PSI levels were lowest and, in some cases, reached BS, possibly an adequate PSI level was reached before the ET/laryngeal mask airway time point. Consequently, the pEEG-monitoring revealed that the induction times “clinically” required before ET/laryngeal mask airway placement were possibly longer than what was actually needed.
A recent randomized trial on pEEG-guided INHAL anesthesia in children highlighted that, compared to standard of care, a pEEG-guided management might reduce sevoflurane doses and BS episodes.4 However, in that study the pEEG-guided protocol recommended to maintain PSI between 25 and 50. The authors do not provide further data on PSI levels, and there remains the possibility that this is not necessarily an adequate range for all pediatric patients undergoing surgery, and that targeting 25 or 50 could lead to different outcomes and hypnotic doses in different conditions.
In order to overcome the limitations of pEEG, other authors have suggested that clinicians should be trained to analyze the raw EEG traces targeting high power on alpha-band and slow/delta waves and avoiding BS.8 It will be interesting to verify these basic notions in the pediatric population. In our population, the choice of INHAL compared to TCI anesthesia, as well as GA compared to GA-LRA, did not imply significant differences in median PSI levels. Again, this may be due to the utilization of “indirectly guided” anesthetic levels that tend to imply an averagely deep anesthesia.
PSI and SEF95 appeared to have a significant correlation, and the interpretation of their respective levels in the context of pEEG-guided anesthesia has to be clarified. As a matter of fact, PSI values are processed by the SedLine algorithm13 whereas SEF95 is an attempt to provide a quantification of power. As suggested by some authors, future recording of pEEG monitoring should include the possibility of quantifying and analyzing density spectral array information that currently provide detailed unprocessed qualitative information on the power of different frequencies.17
Children <2 years of age repeatedly displayed higher median PSI levels compared to older peers, while receiving similar MACage levels. This is in line with what was reported by Tokuwaka9 and Long,4 who, in a pEEG-guided protocol, noticed that, in order to maintain a prespecified bispectral index and PSI value, respectively, their 2-year-old children required a significantly higher sevoflurane concentration. This dissociation between “clinical” sevoflurane doses and pEEG value may reflect subcortical (brainstem and spinal cord) inhibition that is not measured by the monitor in patient below 2 years of age.18 A better appraisal of such different pEEG patterns in this subpopulation is critical to avoid unnecessary hypnotics, as it may happen in case a one-fit-all prespecified pEEG threshold.19 The peculiar modifications of pEEG readings in the earlier ages of neuroevolution is the reason why we decided to exclude patients below 1 year of age.12, 19
We confirmed that BS events occur frequently in the early stages of anesthesia (i.e., at induction and up to 15 min). Moreover, even if they are short-lasting, they should probably be avoided, because literature reports an association between oversedation, hemodynamic instability,2, 10 and postoperative delirium.2 However, we acknowledge that these episodes were primarily detected in the early phases of the surgical procedures (i.e., induction and presurgery) and rarely thereafter. It has been remarked by Hesse and coworkers that BS at anesthesia induction may be better tolerated than delayed episodes during surgery in terms of postoperative delirium.20 Furthermore, our patients demonstrated rather stable hemodynamics, especially in correlation with PSI values. This can be attributed to the fact that, at our center, GA, conducted according to indirect signs of depth, did not cause delayed episodes of BS, and that anesthetic doses were not excessive, therefore not associated with hypotension.10 However, we noticed that patients were extubated and discharged with relatively low PSI levels. This aspect was associated with higher PAED scores, possibly in association with inappropriate hypnotic doses at procedure end and the lack of gradual anesthetic superficialization. Although possible, it is currently unknown whether a pEEG-guided anesthesia targeting higher levels of PSI, especially in the final phases of surgery, can reduce sevoflurane/anesthetics doses, still warranting an adequate level of hypnosis. This aspect appears fundamental for sparing the amount of anesthesia, potentially reduce BS events and possibly improving PAED scores.
4.1 Limitations
This study has several limitations. It was a single-center observation with a limited number of ASA III patients. Furthermore, in general, patients were hemodynamically stable and in relatively few cases major surgeries needed vasoactive support. Furthermore, awakening the patient in the PICU was considered as an exclusion criterion. However, the sample was quite homogenous, we aimed to include only longer procedures (i.e., >60 min), in order to collect data on long lasting surgeries with planned prolonged anesthesia and to avoid deep/moderate sedation procedures, and the explorative sample resembled the activity of our center and that of many pediatric centers performing average surgery. We acknowledge that the lack of an objective gold standard reference to target anesthesia depth outside indirect clinical variables may cause some issues in an observational study applying the SedLine system and comparing patients of different ages receiving different types of GA. However, all attending anesthesiologists were expert with 100% activity in the pediatric setting. Similarly, we cannot warrant with this study that recorded PSI levels derived from an incorrect interpretation of the algorithm in pediatric patients. Future appraisal of this aspect appears fundamental for the definite implementation of a pediatric PSI-guided anesthesia protocol. The exact impact of nociception on pEEG readings and how this might have influenced our data is currently unknown.18 However, all patients were provided similar pain management, including intraoperative opioids and LRA whenever the surgical procedure made it possible. BS episodes were recorded only at prespecified time points and this may have implied an underestimation of actual BS rate. Finally, as the pEEG monitor was unblinded, the effects of the spontaneous progressive training of anesthesiologists involved in the enrolled cases and the tendency to perform a pEEG-guided anesthesia cannot be ruled out. However, a dedicated team of researchers, independent of anesthesia management, was in charge of pEEG data collection and its quality. Hence monitoring and clinical activity were generally separated for this study. PAED scores were analyzed before patient discharge from the operatory room, but the timing of this decision was not decided by protocol. PAED scores evaluation could have been influenced by this factor and this finding would deserve a dedicated study.
5 CONCLUSION
In conclusion, in our center, nonpEEG-guided anesthesia in children led to record median PSI levels at the low range of recommended unconsciousness values (i.e., 25). This value was generally higher in children <2 years of age. Frequent episodes of BS were recorded, at anesthesia induction and in the presurgical phase. Future research should evaluate if pEEG-guided anesthesia in children should target specific PSI levels (i.e., >25), or different levels in specific pediatric cohorts (i.e., those receiving GA and LRA or in different phases of the procedure) with the aim of decreasing hypnotic dosages, BS events, emergence delirium, and hypotensive events.
AUTHOR CONTRIBUTION
Zaccaria Ricci study design, data analysis and collection supervision, manuscript drafting. Chiara Robino, Paolo Rufini, Silvia Cumbo, Sara Cavallini, Lorenzo Gobbi, Agata Brocchi data collection. Paola Serio draft supervision. Stefano Romagnoli manuscript drafting, paper supervision.
ACKNOWLEDGMENTS
None.
FUNDING INFORMATION
None.
CONFLICT OF INTEREST STATEMENT
The authors declare that they have no conflict of interest’.
Open Research
DATA AVAILABILITY STATEMENT
The data that support the findings of this study are available on request from the corresponding author. The data are not publicly available due to privacy or ethical restrictions.


