Contrast-enhanced computed tomography in the venous rather than the arterial phase is essential for the evaluation of the right phrenic nerve
Abstract
Background
Preprocedural detection of the running course of the right pericardiophrenic bundles (PBs) is considered to be useful in preventing phrenic nerve (PN) injury during catheter ablation for atrial fibrillation (AF). However, previous studies using the arterial phase of contrast-enhanced computed tomography (CT) reported a relatively low right PBs detection rate.
Methods
This study included 63 patients with AF who underwent catheter ablation and preoperative contrast-enhanced CT imaging of the venous and arterial phases (66.7 ± 10.2 years; 44 male). The venous phase of contrast-enhanced CT significantly improved the detection rate of PBs compared to the arterial phase (96.8% vs. 60.3%, p < .001), and PBs were detected in the venous phase only in 23 (36.7%) patients. No significant differences were observed between the right PBs detection rate using non-contrast CT versus the arterial phase of contrast-enhanced CT (p = .37). Patients without visualization of the right PBs during the arterial phase had a higher frequency of chronic heart failure (p = .0083), lower left ventricular ejection fraction (p = .021), and a higher CHADS2 score (p = .048) than those with visualization. In five patients whose right PBs could only be detected during the venous phase of contrast-enhanced CT, the reconstructed running course of the right PBs corresponded with the PN generated by electrical high-output pacing.
Conclusion
Contrast-enhanced CT images of the venous phase, rather than the arterial phase, are useful in detecting the right PBs, especially in patients with heart failure or reduced left ventricular ejection fraction.
Abbreviations
-
- AF
-
- atrial fibrillation
-
- CT
-
- computed tomography
-
- ECV
-
- extracellular volume
-
- FAM
-
- fast anatomical map
-
- LA
-
- left atrium
-
- LVEF
-
- left ventricular ejection fraction
-
- MDCT
-
- multidetector computed tomography
-
- PBs
-
- pericardiophrenic bundles
-
- PN
-
- phrenic nerve
-
- PNI
-
- phrenic nerve injury
-
- PV
-
- pulmonary vein
-
- RA
-
- right atrium
-
- RSPV
-
- right superior pulmonary vein
-
- SVC
-
- superior vena cava
1 INTRODUCTION
Right-side diaphragmatic paralysis caused by impairment of the right phrenic nerve (PN) is a well-recognized possible complication of catheter ablation for atrial fibrillation (AF) including right pulmonary vein (PV) and superior vena cava (SVC) isolation.1-4 The right PN runs laterally along the right pericardial cavity, descending from the superior mediastinum adjacent to the SVC over the right atrium (RA) and inferior vena cava, and ends at the right half diaphragm.5 The PN is indetectable via computed tomography (CT) imaging. However, the PN, pericardiophrenic artery (branching from the ipsilateral internal thoracic artery), and pericardiophrenic vein (flowing into the ipsilateral brachiocephalic vein) forgather to form pericardiophrenic bundles (PBs), which are detectable.6, 7 Previous studies using contrast-enhanced CT in the arterial phase demonstrated the usefulness of preprocedural CT in confirming PBs and avoiding PN injury during AF ablation, but the detection sensitivity of the right PBs used to locate the right pericardiophrenic artery was relatively low (approximately 50%).8, 9
Evidence from recent studies shows that the evaluation and comparison of contrast-enhanced CT images obtained in various phases are useful for assessing cardiac structure and pathology.10-13 A previous study suggested that contrast CT is more accurate in detecting thrombus during the venous phase than in the arterial phase.10 However, the utilization of contrast-enhanced CT images to detect the right PBs in the venous phase has not yet been validated. Accordingly, we aimed to assess the detection rate of the right PBs using contrast-enhanced CT in the venous and arterial phases and to ascertain whether the three-dimensional reconstruction of PBs from CT data could locate the running course of the PN map using electrical phrenic high-output pacing. Furthermore, we investigated factors that influence right PBs detection using contrast-enhanced CT.
2 METHODS
2.1 Study population
This single-center retrospective cohort analysis included 98 consecutive patients with AF who underwent AF ablation and preprocedural contrast-enhanced CT between November 2022 and March 2023. The exclusion criteria were as follows: patients who did not undergo contrast-enhanced CT due to a contrast agent allergy and/or chronic kidney disease and those that had missing data regarding the venous phase of contrast-enhanced CT before catheter ablation. Finally, 63 patients were included. This study complied with the Declaration of Helsinki. All patients provided written informed consent. The study protocol was approved by our hospital's institutional review board (Clinical Trial Registration: UMIN000058184).
2.2 Cardiovascular CT and three-dimensional image reconstruction
Prior to the ablation procedure, patients underwent an electrocardiography-gated cardiovascular CT using a 192-row multidetector CT (MDCT) scanner (SOMATOM Force, SIEMENS healthineers, Germany). CT scans were acquired during a single breath-hold from the level of the aortic arch to the diaphragm. Retrospective electrocardiographic gating was employed, with tube current applied from 20% to 80% of the RR interval for all patients. The gantry rotation time was 0.25 s and the tube current was 350 mA at 100 kV. Iodinated contrast material injection protocols contain an undiluted contrast material bolus for 8 s, then a diluted contrast chaser for 10 s, followed by a saline chaser. The dilution of contrast material can be altered (e.g., 50% iodine with 50% saline) and provides diminished right heart cavity attenuation. Approximately 50 mL of iodinated contrast material was injected at a rate of 4.5 mL/s. All 63 patients underwent non-contrast CT, contrast-enhanced CT in the arterial phase to produce three-dimensional images of the LA and PVs for use in the electroanatomical three-dimensional mapping system, and contrast-enhanced CT in the venous phase to evaluate left atrial appendage thrombus.11 We performed contrast-enhanced CT in the venous phase 2 min after contrast injection. We created a stack of contiguous axial images with the same section thickness of 0.75 mm from non-contrast CT, arterial phase of contrast-enhanced CT, and venous phase of contrast-enhanced CT. Furthermore, 14 patients underwent delayed ECG-gated delayed post-contrast CT which was performed 5 min after contrast injection.12 Delayed post-contrast images for ECV quantification were also reconstructed from 0.75 mm slices. In addition to contrast media, 0.3 mg of nitroglycerin (glyceryl trinitrate) was administered before contrast-enhanced CT. First, the patients were divided into two groups based on whether the right PBs could be observed or not. The patients whose right PBs could be reconstructed from the SVC to the right diaphragm using three-dimensional CT on an image processing workstation (syngo.Via VB30A: SIEMENS healthineers), which was employed in daily clinical practice, were defined as patients with right PBs visualization. In contrast, the patients whose right PBs could not be reconstructed using three-dimensional CT were defined as patients without right PBs visualization. Furthermore, we measured the minimal distance between the right PBs and the right superior pulmonary vein (RSPV) ostium and the minimal distance between the right PBs and SVC in all patients in whom the right PBs were identified in the venous phase.
2.3 Catheter ablation protocol, PN map using phrenic high-output pacing protocol, and follow-up
Catheter ablation protocol and follow-up are described previously.7, 14 Direct oral anticoagulants were not interrupted throughout the peri-procedural period. Further, the intra-procedural activated clotting time was maintained between 300 and 350 s. After a transseptal puncture, PV isolation was performed using either a contact force-sensing irrigated-tip radiofrequency catheter (SmartTouch Surround Flow, Biosense Webster, Diamond Bar, CA, USA) guided by a three-dimensional mapping system (CARTO3, Biosense Webster), a 28-mm fourth-generation cryoballoon (Arctic Front Advance, Medtronic, Minneapolis, MN, USA), or endoscopic visually guided third-generation laser ablation (Heartlight X3, CardioFocus, Inc., Marlborough, MA, USA). A single 180 s freeze was applied to each PV.15 If there was complete occlusion or a very short time for isolation, the freezing time was shortened to 150 s for the left and right inferior PV to minimize the risk of esophageal injury and pulmonary vein stenosis decided by each attending physician. Cryoablation for superior PVs was started before tightly contacting the cryoballoon (proximal seal technique).16 This technique can achieve a lesion with a closer resemblance to the typical wide area circumferential ablation, thereby reducing the risk for phrenic nerve injury (PNI) at the RSPV. Additional substrate modification was performed at the operators’ discretion. The procedural endpoint was a bidirectional conduction block between the PVs and the left atrium (LA).
In seven consecutive patients with right PBs visualization in the venous phase only, three-dimensional images of the right PBs were reconstructed from unmodified CT data on an electroanatomical mapping system (CARTO3) to navigate the mapping catheter during the electrophysiological study. In these patients, we created geometry shells derived from a fast anatomical map (FAM) using a 1-mm electrode spacing multi-electrode mapping catheter (PentaRay, Biosense Webster, CA, USA) and the CARTO3 system. The reconstructed CT data sets were merged with the geometries via three registration processes. Visual alignment was performed with the use of anatomical landmark pairs, that is, landmarks of the left inferior PV bottom, established on the FAM images, and corresponding sites on the reconstructed CT image. After surface registration, a manual iterative process was used to minimize differences in the individual PV positions and overall LA geometry. High output pacing of 10 V and pulse width of 1.0 ms with a cycle length of 1000 ms was applied from the distal bipolar electrodes of the ablation catheter in the RA and the SVC to capture the PN. The capture or non-capture of the PN was defined as the presence or absence of diaphragmatic twitching, respectively. Operators were blinded to the PN reconstruction during pacing. Positional information and the response to stimuli of the pacing sites were recorded using the CARTO3 system.7
In-hospital electrocardiogram monitoring was performed for 3–5 days after the procedure. The regular follow-up period comprised outpatient clinic visits at 1 and 3 months post-procedure. Subsequent follow-up visits involved a clinical interview, a 12-lead electrocardiogram, and/or 24-hour Holter electrocardiogram recordings performed at 3-month intervals.14
2.4 Statistical analysis
Continuous data are expressed as means ± standard deviations and medians [25th, 75th percentiles] for normally and non-normally distributed variables, and were compared using a Student's t-test or Mann-Whitney U-test, respectively. Categorical variables were compared using the chi-square test. Statistical significance was set at p < .05. Statistical analyses were performed using JMP version 12.0.
3 RESULTS
3.1 Patient characteristics and PBs detected by non-contrast and contrast-enhanced CT
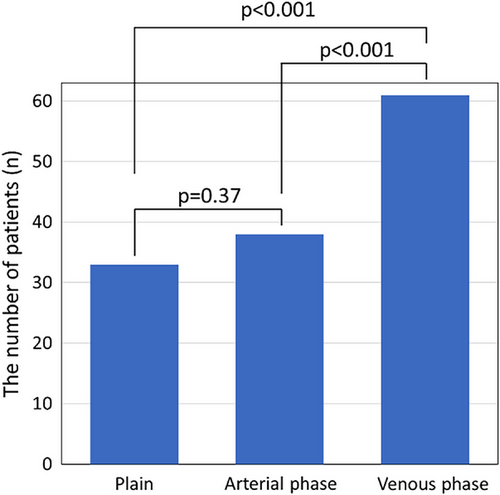
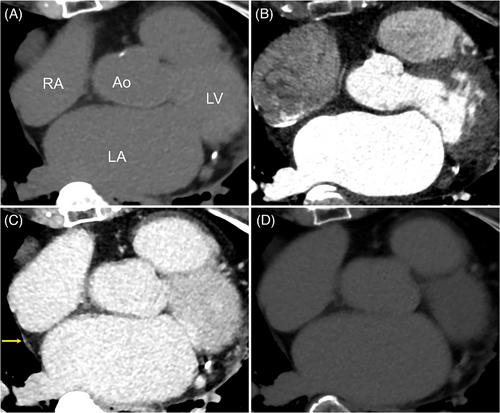
All patients underwent successful AF ablation using radiofrequency (n = 24), cryoballoon (n = 36), or endoscopic visually guided laser balloon (n = 3). Although a complication of air embolization was observed in one patient, none of the other patients had any complications, including PNI. The 63 patients (66.7 ± 10.2 years; 44 male, 32 non-paroxysmal AF patients) were included in our study (Table 1). Preprocedural CT scans showed successful detection of the right PBs in 33 patients (52.4%) using non-contrast CT, 38 patients (60.3%) in the arterial phase of contrast-enhanced CT, and 61 patients (96.8%) in the venous phase of contrast-enhanced CT. The venous phase of contrast-enhanced CT significantly improved the detection rate of the right PBs visualization compared with non-contrast CT and arterial phase of contrast-enhanced CT, respectively (p < .0001 for both, Figure 1). However, no significant differences were noted in the right PBs detection rate between non-contrast CT and the arterial phase of contrast-enhanced CT (p = .37). Additionally, in 14 patients who underwent delayed post-contrast imaging, the right PBs of eight patients (57.1%) were observed by phase 3 min after the venous phase of contrast-enhanced CT (Table 1). Figure 2 demonstrates non-contrast and contrast-enhanced CT images. The right PBs could only be observed in the venous phase of contrast-enhanced CT.
| Overall | |
|---|---|
| Age, years | 66.7 ± 10.2 |
| Male sex, n (%) | 44 (69.8) |
| Height, cm | 164.0 ± 9.6 |
| Weight, kg | 65.5 ± 13.8 |
| Body mass index, kg/m2 | 23.8 ± 3.7 |
| CHADS2 score | 1.3 ± 1.0 |
| CHA2DS2-VASc score | 2.2 ± 1.4 |
| Chronic heart failure, n (%) | 16 (25.4) |
| Hypertension, n (%) | 35 (55.6) |
| Diabetes mellitus, n (%) | 14 (22.2) |
| Vascular disease, n (%) | 5 (7.9) |
| Stroke, n (%) | 2 (3.2) |
| Non-paroxysmal AF, n (%) | 32 (50.8) |
| Physiological function test | |
| Heart rate, bpm | 79.8 ± 20.0 |
| AF rhythm, n (%) | 35 (55.6) |
| LV ejection fraction, % | 58.8 ± 12.0 |
| LV end-diastolic diameter, mm | 47.0 ± 4.6 |
| LV end-systolic diameter, mm | 32.1 ± 5.9 |
| Left atrial diameter, mm | 40.3 ± 4.9 |
| Laboratory test | |
| N-terminal prohormone brasin natriuretic peptide, pg/mL | 392.2 [103.8–840.4] |
| Creatinine, mg/dL | 0.88 ± 0.16 |
| Blood urea nitrogen, mg/dL | 16.7 ± 3.8 |
| Ablation methods | |
| Radiofrequency ablation, n (%) | 24 (38.1) |
| Cryoballoon, n (%) | 36 (57.1) |
| Laser balloon, n (%) | 3 (4.8) |
| The findings of CT | |
| Non-contrast CT, n (%) | 63 (100) |
| Visualization of PBs, n (%) | 33 (52.4) |
| Arterial phase of contrast-enhanced CT, n (%) | 63 (100) |
| Visualization of PBs, n (%) | 38 (60.3) |
| Venous phase of contrast-enhanced CT, n (%) | 63 (100) |
| Visualization of PBs, n (%) | 61 (96.8) |
| Delayed post-contrast CT, n (%) | 14 (22.2) |
| Visualization of PBs, n (%) | 8 (57.1) |
| Minimal distance between the right PBs and the RSPV ostium in patients with visualized PBs, mm | 17.6 ± 1.7 |
| Minimal distance between the right PBs and the SVC in patients with visualized PBs, mm | 2.5 ± 0.9 |
- Note: Values are reported as means ± standard deviations or proportion of patients (%) unless otherwise noted. Levels of N-terminal prohormone brain natriuretic peptide are non-normally distributed, and the values are reported as medians [25th, 75th percentiles].
- Abbreviations: AF, atrial fibrillation; CT, computed tomography; LV, left ventricular; PBs, pericardiophrenic bundles; RSPV, right superior pulmonary vein; SVC, Superior vena cava.
3.2 Comparison of patients with right PBs visualized in the venous phase only versus patients with right PBs visualized in both arterial and venous phases
The right PBs of two patients could not be visualized in the venous phase of contrast-enhanced CT. The details of the two patients are as follows: the first patient was a 73-year-old woman with non-paroxysmal AF, AF rhythm at the time of CT, a history of chronic heart failure, and an LVEF of 50.3%, and the second patient was a 48-year-old woman with obesity and paroxysmal AF without heart failure, and sinus rhythm at the time of CT. Patients whose right PBs were visualized in the venous phase of contrast-enhanced CT were divided into those with and without right PBs visualization at the arterial phase. No significant differences were found in age, sex, or laboratory data between the two groups. However, patients with the right PBs visualized during the venous phase of contrast-enhanced CT only, and not in the arterial phase, were more likely to have chronic heart failure (p = .0083), lower left ventricular ejection fraction (LVEF) (p = .021), and a higher CHADS2 score (p = .048) than patients with the right PBs visualized in both arterial and venous phases (Table 2).
| PBs visualized in venous phase only (n = 23) | PBs visualized in both arterial and venous phases (n = 38) | p value | |
|---|---|---|---|
| Age, years | 67.9 ± 12.2 | 66.4 ± 8.5 | .56 |
| Male sex, n (%) | 16 (69.6) | 28 (73.7) | .73 |
| Height, cm | 163.2 ± 11.1 | 164.7 ± 8.6 | .55 |
| Weight, kg | 63.0 ± 14.5 | 64.3 ± 17.0 | .34 |
| Body mass index, kg/m2 | 23.4 ± 3.7 | 24.3 ± 3.0 | .32 |
| CHADS2 score | 1.6 ± 1.2 | 1.1 ± 0.9 | .048 |
| CHA2DS2-VASc score | 2.5 ± 1.8 | 2.0 ± 1.2 | .25 |
| Chronic heart failure, n (%) | 10 (43.5) | 5 (13.2) | .0083 |
| Hypertension, n (%) | 13 (56.5) | 21 (55.3) | .92 |
| Diabetes mellitus, n (%) | 6 (26.1) | 8 (21.1) | .65 |
| Vascular disease, n (%) | 1 (4.3) | 4 (10.5) | .37 |
| Stroke, n (%) | 1 (4.3) | 1 (2.6) | .72 |
| Non-paroxysmal AF, n (%) | 12 (52.2) | 19 (50.0) | .87 |
| Physiological function test | |||
| Heart rate, bpm | 80.8 ± 24.4 | 78.1 ± 16.2 | .60 |
| AF rhythm, n (%) | 12 (52.2) | 22 (57.9) | .66 |
| LV ejection fraction, % | 54.3 ± 15.8 | 61.5 ± 8.6 | .021 |
| LV end-diastolic diameter, mm | 47.9 ± 5.3 | 46.4 ± 4.2 | .17 |
| LV end-systolic diameter, mm | 34.0 ± 7.5 | 30.9 ± 4.6 | .053 |
| Left atrial diameter, mm | 40.2 ± 4.6 | 40.2 ± 5.2 | .98 |
| Laboratory test | |||
| N-terminal prohormone brain natriuretic peptide, pg/mL | 500.3 [100.0–1671.6] | 351.6 [133.3–639.9] | .29 |
| Creatinine, mg/dL | 0.91 ± 0.18 | 0.86 ± 0.15 | .32 |
| Blood urea nitrogen, mg/dL | 16.7 ± 3.5 | 16.8 ± 3.7 | .92 |
- Notes: Values are reported as means ± standard deviations or proportion of patients (%) unless stated otherwise. Levels of N-terminal prohormone brain natriuretic peptide are not normally distributed and the values are reported as medians [25th, 75th percentiles].
- Abbreviations: AF, atrial fibrillation; CT, computed tomography; LV, left ventricular; PBs, pericardiophrenic bundles.
3.3 Comparison of the right PBs visualized by CT versus electrical phrenic high-output pacing
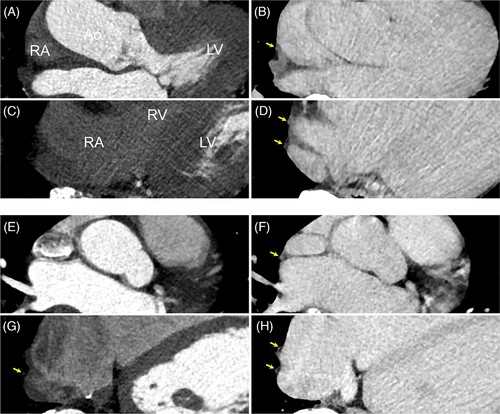
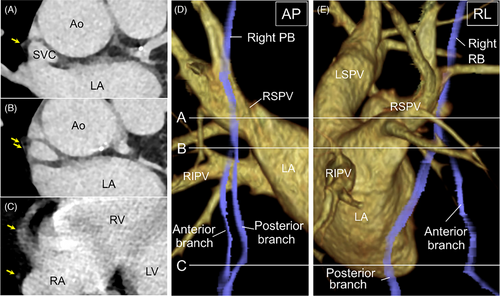
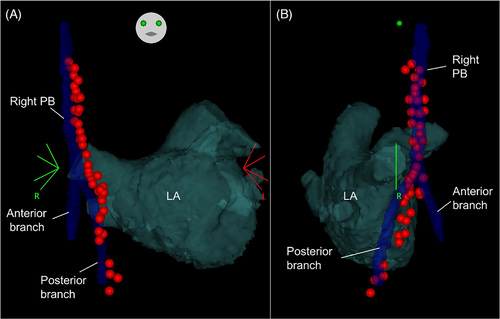
A representative image of two patients whose right PBs were detected in the venous phase of contrast-enhanced CT and appeared bifurcated is shown in Figure 3. In the patients in whom right PBs were visualized in the venous phase, the minimal distance from the RSPV ostium to the right PBs was 17.6 ± 1.7 mm and that from the SVC to the right PBs was 2.5 ± 0.9 mm (Table 1). Of 61 patients with right PBs visualized via contrast-enhanced CT imaging in the venous phase, 31 patients (50.8%) had bifurcated PBs. The PNs of seven patients whose right PBs could only be detected in the venous phase of contrast-enhanced CT were generated using a three-dimensional map with high-output phrenic pace. Of those, the PN of five patients was captured using electrical pacing in the SVC and RA; however, those of the remaining two patients were not captured in the RA due to epicardial and pericardial adipose tissue. The running course of the right PBs reconstructed from the venous phase of contrast-enhanced CT and the ipsilateral PN generated by a three-dimensional map with electrical phrenic pace was visually well-matched. Of the five patients whose PNs were captured using electrical pacing from the SVC to the RA, the right PBs in four patients looked bifurcated and the PN generated by a three-dimensional map with phrenic pacing ran along the posterior branch of the PBs. Furthermore, a representative image from a patient indicates that right PBs could only be detected in the venous phase of contrast-enhanced CT and that the running course reconstructed using the CARTO3 system visually matched with that of the right PN generated by the electrical high-output pacing (Figures 4 and 5). Moreover, the right PN generated by a three-dimensional map with phrenic high-output pacing ran along the posterior branch of the PBs (Figure 5).
4 DISCUSSION
We found that (1) the venous phase of contrast-enhanced CT significantly improved the right PBs detection rate and PBs were only detected in the venous phase in 23 (36.7%) patients; (2) patients with right PBs visualization in the venous phase of contrast-enhanced CT only were more likely to have chronic heart failure, lower LVEFs, and higher CHADS2 scores than those with visualization in both arterial and venous phases; (3) the running course of the right PBs reconstructed using contrast-enhanced CT in the venous phase and PN generated by a three-dimensional map with phrenic high-output pacing was visually well matched; (4) approximately 50% of patients had an apparent bifurcation based on imaging from the venous phase of contrast-enhanced CT; (5) right PN generated by a three-dimensional map with phrenic high-output pacing ran along the posterior branch of the PBs.
Our results indicate that contrast-enhanced CT is useful in confirming the course of the right PB including the right transverse nerve; however, for this evaluation, obtaining CT images is essential in the venous phase rather than the arterial phase.
4.1 Advantage of using MDCT
In recent decades, advancements in MDCT scanners resulted in improved temporal and spatial resolution, allowing for precise non-invasive evaluation of the LA, PVs, and related structures before the AF ablation procedur.17-19 In the present study, a 192-row MDCT scanner was used. The advantage of high-speed and wide-coverage MDCT scanners is reduced cardiac motion and artifact, thus improving image quality. Since the nerve runs in the same vascular bundle as the artery, locating the artery and/or vein enables precise three-dimensional positioning of the nerve. Although several studies reported a lower (approximately 50%) sensitivity of the right PBs course identification in the arterial phase of contrast-enhanced CT8, 9; in our study, 60.3% of right PBs were detected in the arterial phase of contrast-enhanced 192-row MDCT. Therefore, high-speed and wide-coverage MDCT will serve to detect and recognize the location of the right PBs pre-procedurally.
4.2 Usefulness of the venous phase of contrast-enhanced CT
In our study, right PBs were detectable and reconstructed using a three-dimensional mapping system in 96.8% of patients during the venous phase of contrast-enhanced CT. Although delayed post-contrast CT could not be performed in all cases, the detection rate of right PBs was 57.1%. Hence, delayed post-contrast CT was not more useful in detecting right PBs than the venous phase of contrast-enhanced CT. Furthermore, there were no significant differences in the frequency of AF rhythm between patients whose right PBs could be visualized in the venous phase only and in those whose right PBs could be visualized in both arterial and venous phases (p = .66). The results suggest that AF or sinus rhythm at the time of CT was not associated with visualization of right PBs. The running course of the right PBs visualized in the venous phase of contrast-enhanced CT and the PN generated by electrical high-output pacing were visually well-matched. A prior study reported an anatomic correlation between CT images obtained using the arterial phase of contrast-enhanced CT and the three-dimensional electroanatomical map using phrenic high-output pacing from the RA to the SVC.7 The novel aspect of our study was the reconstruction of the right PBs running course using the venous phase of contrast-enhanced CT, which corresponded with the PN generated by a three-dimensional map with phrenic high-output pacing. Moreover, the right PBs in 50.8% of patients appeared bifurcated and the generated PN ran along the posterior branch of the PBs. However, it remains to be determined whether the anterior branch detected during the venous phase of contrast-enhanced CT is the pericardiophrenic artery or vein, or fibrous tissue since thoracic surgical procedures and autopsy were not performed.
4.3 Characterization of patients with right PBs visualization in the venous phase only
Although previous studies showed that visualization of the left PBs was thought to be dependent on age and male sex,9 a high degree of anatomical variability in the course of the right PBs was a challenge for the effective characterization of these nerves through imaging. However, in this study, patients with detectable right PBs only in the venous phase of contrast-enhanced CT were more likely to have chronic heart failure, lower LVEFs, and higher CHADS2 scores than patients with indetectable right PBs in the arterial phase. A possible explanation for the low detection rate of the right PBs in patients with heart failure and reduced LVEF in the arterial phase of contrast-enhanced CT is that heart failure may have delayed blood flow into the pericardiophrenic artery due to venous stasis and reduced cardiac output. Moreover, since a CHADS2 score includes a history of chronic heart failure, a significant difference in the CHADS2 score may have been observed. Therefore, since it is challenging to detect the right PBs of patients with chronic heart failure and reduced LVEF in the arterial phase of contrast-enhanced CT, the strategy to identify the three-dimensional location of the right PBs in the venous phase may be acceptable.
4.4 Clinical implication
Phrenic nerve injury is often complicated when isolating the RSPV and SVC during radiofrequency ablation. In published reports, PNI from cryoballoon ranged from 2.8% to 11.2%.3, 20, 21 Moreover, PNI was observed in 2.6% of patients who underwent PV isolation using a laser balloon.4 The anatomical proximity between PN and RSPV ostium is a risk factor for right PNI when PV isolation is performed by balloon-based ablation systems.22, 23 A previous study revealed that the minimal distance from RSPV ostium to the right PBs in the group with PNI was 10.7 ± 2.1 mm and that in the group with no PV isolation was 17.4 ± 3.8 mm.23 Moreover, a PN location within 8 mm of the RSPV poses a high risk for PNI using cryoballoon.20 Although none of the patients suffered from PNI in our study, the reason for the absence of patients with complications arising due to PNI can be attributed to the fact that the minimal distance from the right PBs and RSPV ostium of the patients included in our study was relatively large. A non-invasive technique in which identification of the right PB in the venous phase of contrast-enhanced CT may reduce PNI complications. Additionally, for patients with sufficient anatomical distance between PN and RSPV, fluoroscopy time, procedural time, and discomfort caused by continuous abdominal palpitation during PN pacing can be reduced.
4.5 Limitation
First, a major limitation of our study is its design (i.e., non-randomized, single-center, retrospective) and relatively small sample size. Second, the 192-row MDCT used in this study may be advantageous in improving the right PBs detection rate. Therefore, it is unclear whether any row CT improves the right PBs detection rate in the venous phase as much as our results. Third, although delayed post-contrast images were not acquired in all patients, the rate of PBs visualization by delayed post-contrast imaging was lower than that of the right PBs visualization in the venous phase of contrast-enhanced CT. A prospective study is warranted to verify our findings.
5 CONCLUSION
Imaging right PBs in the venous phase of contrast-enhanced CT scanning provides more accurate identification of the three-dimensional location of the vessel and its spatial relationship with adjacent structures. Hence, this technique might prevent the right PNI caused by the catheter ablation procedure.
ACKNOWLEDGMENTS
The authors have nothing to report.
CONFLICT OF INTEREST STATEMENT
Hiroshi Tada received honoraria (lecture fees, presentations, or speakers bureaus) Daiichi- Sankyo Co., Ltd., Biotronik Japan, Inc., Bristol-Myers Squibb, Nippon Boehringer lngelheim Co., Ltd., Medtronic Japan Co., Ltd., and Novartis Pharma, K.K. Dr. Tada also received research grants from Abbott Medical Japan, LLC, Nippon Boehringer lngelheim Co., Ltd., Daiichi- Sankyo Co., Ltd., and ALVAUS Inc. Toshihiko Tsuji and Daisetsu Aoyama belong to endowed department by Biotronik Japan, Inc., DVx Inc., ALVAUS Co., Ltd. Shota Kakehashi and Moe Mukai belong to endowed department by Medtronic Japan Co., Ltd., DVx Inc., Abbott Medical Japan, LLC, Boston Scientific Japan K.K., and Japan Lifeline Co., Ltd. No other authors have any conflicts of interest to disclose.
ETHICAL STATEMENT
The study was approved by the Research Ethics Committee of the University of Fukui (no. 20220212) and clinical trial registration (UMIN000058184).
Open Research
DATA AVAILABILITY STATEMENT
The data that support the findings of this study are available from the corresponding author upon reasonable request.


