Associations between body mass index and all-cause mortality: A systematic review and meta-analysis
Funding information: The study was supported by MT's David Freeze Chair in Health Services Research at the University of Calgary. The sponsors had no role in the design and conduct of the study; collection, management, analysis, and interpretation of the data; preparation, review, or approval of the manuscript; nor in the decision to submit the manuscript for publication.
Summary
Fasting insulin and c-reactive protein confound the association between mortality and body mass index. An increase in fat mass may mediate the associations between hyperinsulinemia, hyperinflammation, and mortality. The objective of this study was to describe the “average” associations between body mass index and the risk of mortality and to explore how adjusting for fasting insulin and markers of inflammation might modify the association of BMI with mortality. MEDLINE and EMBASE were searched for studies published in 2020. Studies with adult participants where BMI and vital status was assessed were included. BMI was required to be categorized into groups or parametrized as non-first order polynomials or splines. All-cause mortality was regressed against mean BMI squared within seven broad clinical populations. Study was modeled as a random intercept. β coefficients and 95% confidence intervals are reported along with estimates of mortality risk by BMIs of 20, 30, and 40 kg/m2. Bubble plots with regression lines are drawn, showing the associations between mortality and BMI. Splines results were summarized. There were 154 included studies with 6,685,979 participants. Only five (3.2%) studies adjusted for a marker of inflammation, and no studies adjusted for fasting insulin. There were significant associations between higher BMIs and lower mortality risk in cardiovascular (unadjusted β −0.829 [95% CI −1.313, −0.345] and adjusted β −0.746 [95% CI −1.471, −0.021]), Covid-19 (unadjusted β −0.333 [95% CI −0.650, −0.015]), critically ill (adjusted β −0.550 [95% CI −1.091, −0.010]), and surgical (unadjusted β −0.415 [95% CI −0.824, −0.006]) populations. The associations for general, cancer, and non-communicable disease populations were not significant. Heterogeneity was very large (I2 ≥ 97%). The role of obesity as a driver of excess mortality should be critically re-examined, in parallel with increased efforts to determine the harms of hyperinsulinemia and chronic inflammation.
1 INTRODUCTION
Obesity has been designated a disease by the National Institutes of Health,1 the Centers for Disease Control Prevention,2 the World Health Organization,3 and many other leading organizations. Numerous studies examine the association between body mass index (BMI) and mortality, but the findings have not consistently favored the “healthy” BMI range (18.5 to 25 kg/m2). Rather, multiple studies suggest that obesity is associated with a lower risk of mortality in a diverse range of clinical populations including kidney failure,4 cardiovascular disease,5 cancer,6 and acute respiratory distress.7
Using population-based data from the United States, we recently found that levels of fasting insulin and c-reactive protein (CRP) confound the association between mortality and BMI. Both fasting insulin and CRP were correlated with BMI (correlations ~0.40),8 and after adjustment for all three factors, hyperinsulinemia and hyperinflammation were associated with increased mortality, while obesity was associated with decreased mortality. Thus, an increase in fat mass may mediate the associations between hyperinsulinemia, hyperinflammation, and mortality. However, the extent to which the published literature accounts for this potential confounding is unknown.
In this systematic review, we aimed to describe the “average” associations between BMI and the risk of mortality in studies published during 2020. We also aimed to explore how adjusting for fasting insulin and markers of inflammation might modify the association of BMI with mortality and to quantify the proportion of published studies that include such adjustment.
2 METHODS
This systematic review and meta-analysis were conducted and reported according to PRISMA9 and MOOSE guidelines.10 Research ethics board approval was not required, as this is a systematic review of previously published research. No patients or members of the public were directly involved in this study as no primary data were collected.
2.1 Data sources and searches
We did a comprehensive search designed by a MLIS-trained librarian (EC) to identify all longitudinal studies (randomized trials and cohort studies) collecting BMI at baseline and vital status. We included only full peer-reviewed studies published in English. No abstracts or early release pre-peer reviewed articles on Covid-19 or any other topic were included. MEDLINE (1946 to July 19, 2021) and EMBASE (1974 to July 19, 2021) were searched; however, only studies published in 2020 were retained due to the high volume. The specific search strategies are provided in Table S1. The term “obesity paradox” was not used in the search strategies in order to avoid selection bias. The abstracts were independently screened by two reviewers (NW; MT, NA, AL, or ST). The full text of any study considered potentially relevant by one or both reviewers was retrieved for further consideration.
2.2 Study selection
Each potentially relevant study was independently assessed by two reviewers (NW; NA, AL, or ST) for inclusion in the review using the following predetermined eligibility criteria. Studies with adult (≥16 years) participants where BMI or waist-to-hip ratio (WHR) was measured and vital status was assessed were included. Studies that reported all-cause mortality were included but cause-specific mortality was not included. BMI and WHR were required to be categorized into groups or parametrized as non-first order polynomials or splines (i.e., not simply linear parametrizations of BMI or WHR). Studies where most or all participants were pregnant, or recently pregnant, or had received a form of bariatric surgery were excluded due to their fluctuations in weight. Original studies or meta-analyses using individual patient data were included. Disagreements were resolved by consultation with a third party.
2.3 Data extraction and risk of bias assessment
Data from eligible studies were extracted by a single reviewer (NW). A second reviewer (NA, AL, or ST) checked the extracted data for accuracy. The following properties of each study were recorded in a database: study characteristics (data source[s], region, era of accrual, design, duration of follow-up, populations and subpopulations of interest, intervention where applicable, and sample size), age, biological sex and Asian ancestry of participants, BMI or WHR groups, and mortality statistics (counts; hazard, odds, and risk ratios and lists of covariates). No data on WHR groups were found. Data were also extracted from Kaplan–Meier figures and splines. Authors were contacted at least twice if the ranges and/or the mortality counts of the BMI groups were not reported.
Risk of bias was assessed using the Newcastle-Ottawa tool for cohort studies, which has three sections: selection (max of 4 points), comparability or confounding (max of 2 points), and outcome items (max of 3 points).11 Higher scores indicate a lower risk of bias (max score of 9). Sources of funding were also extracted given its potential to introduce bias.12
2.4 Data synthesis and analysis
Data were analyzed using Stata 17.0 (www.stata.com). Studies were grouped broadly by clinical populations (i.e., general, cancer, cardiovascular, Covid-19, critically ill, non-communicable chronic disease [NCD; e.g., diabetes, kidney disease, liver disease], and surgical) and by duration of follow-up (i.e., long-term vs. short-term). Participants followed on average for 6 months or longer were deemed to be long-term studies. Populations with fewer than 10 BMI groups were categorized with other populations.
Hazard ratios, odds ratios, risk ratios, and counts were converted into risks (i.e., probability) of mortality by BMI group. Mortality counts were extracted from available graphs (largely Kaplan–Meier graphs) when not reported. The natural logarithm of standard error for the mortality risks was derived from confidence intervals (CIs) and other measures of variability. Full details of these calculations are available in Methods S1 and in Woods et al.13
We aimed to use the mean BMI from each BMI group (rather than the BMI intervals) as the independent variable in the regressions, but most studies did not report this information. We imputed the mean, when missing, for each within-study BMI group by using the ranges and mean of BMI groups from eight cycles of the publicly available National Health and Nutrition Examination Surveys (NHANES; 1999–2000 to 2013–2014; https://wwwn.cdc.gov/nchs/nhanes/Default.aspx). The reported means from our included studies were regressed on the NHANES means, within BMI groups, clinical populations, and follow-up categories, allowing us to impute means for each within-study BMI group.
While no pooled estimates could overcome the expected diversity within these studies, populations, and varying follow-ups, we wanted to estimate the “average” associations that may exist between BMI and mortality within each clinical population. We decided a priori to regress the natural logarithm of mortality risk onto the natural logarithm of mean BMI squared (a quadratic term anticipating a U-shaped association) using mixed effects generalized linear models (Gaussian family, identity link).14 Studies were modeled with random intercepts. The standard errors for each BMI group were fixed at the values extracted from the included articles. To report the “average” associations (fixed effects meta-analyses) between mean BMI and all-cause mortality, we present the β coefficients along with 95% CIs and the corresponding p values. Estimates of mortality risk were given at mean BMIs of 20, 30, and 40 kg/m2. Statistical heterogeneity was quantified using the τ2 statistic (between-study variance)15 and the I2 statistic. We present the raw data (the size of the markers weighted by the inverse variance), the predicted curve, its fixed effects CIs, and its corresponding random effects CIs in bubble plots. Results were presented separately for each clinical population.
In sensitivity analyses, we regressed the natural logarithm of mortality risk onto the natural logarithm of mean BMI (as a linear term). Additionally, we removed groups with mean BMI < 20 kg/m2 so that cachexia or significant weight loss would not affect our findings. We also removed studies that did not adjust for smoking status. Because people with Asian ancestry tend to have more frequent metabolic disturbances at lower BMI,16 we considered Asian ancestry as a potential effect modifier. Since few studies reported the percent of participants with Asian ancestry, we interacted mean BMI with countries mostly with Asian ancestry versus those mostly without. In long-term studies, we interacted mean BMI with follow-up ≥5 years versus <5 years. The Type I error rate for meta-regressions was set at P < 0.05.
3 RESULTS
3.1 Quantity of research available
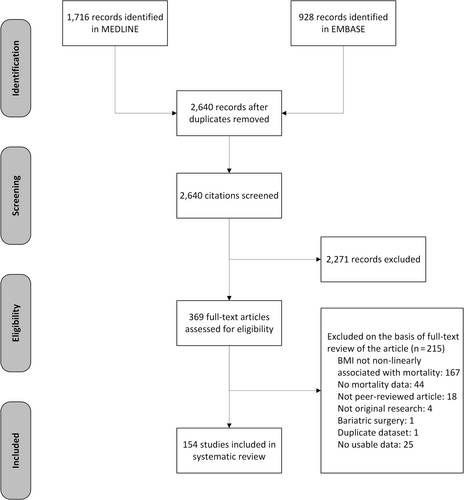
The searches identified 2,640 unique records of articles published in 2020 (Figure 1). After initial screening, the full text of 369 articles were retrieved for detailed evaluation. Of these, 215 articles were excluded resulting in 154 studies that met the selection criteria. We excluded 25 studies with no usable data: 23 did not report baseline risk for mortality by BMI group,17-39 1 only reported a p value,40 and another 1 mentioned data in a supplement that were not available.41 Disagreements about the inclusion of studies occurred in 16% of the articles (kappa = 0·67).
3.2 Risk of bias
The Newcastle-Ottawa score has three sections: selection (max of 4 points), comparability or confounding (max of 2 points), and outcome (max of 3 points). All the studies were prospective or retrospective cohort studies or secondary analyses of trials. There were no case–control studies. In terms of selection bias, 40 studies (26.0%) obtained all 4 points, 103 (66.9%) obtained 3 of 4 points, and 11 (7.1%) obtained 2 of 4 points. Most studies (91.6%) reported where the BMI data were collected from (e.g., medical records and physical examination). Few studies gave participant flow diagrams; half (48.1%) did not give sufficient details on cohort derivation. In terms of outcome bias, 106 (68.8%) obtained all 3 points, 41 (26.6%) obtained 2 of 3 points, and 7 (4.5%) obtained 1 of 3 points. Most studies (89.6%) reported where the death data were collected from (e.g., government vital statistics), and most studies (81.8%) had complete data on vital status although calculations typically needed to be performed to ascertain this. More than half had no funding or public funding only (51.9%). The remaining had mixed or private only funding (20.8%) or did not report whether they had funding or not (27.3%).
Most studies (96.8%) scored poorly on the Newcastle-Ottawa risk of bias score simply because they did not adjust for two important confounders: fasting insulin and a marker of inflammation (Table S2). Only five studies42-46 (3.2%) adjusted for a marker of inflammation and none adjusted for fasting insulin. Four studies42-45 (two in Covid-19 populations and two in cancer) obtained a good score, and one46 (in cancer) obtained a fair score.
3.3 General populations
There were 12 studies47-58 (13 cohorts; 187,866 participants) with general populations (Table S3). Of these, seven cohorts were in East Asia, and three cohorts in each Europe and North America. Mean age of participants ranged from 54 to 87 years. Percent males ranged from 13% to 100%. Mean BMI ranged from 20 to 32 kg/m2. Follow-up ranged from 4.0 to 17.4 years.
Neither the unadjusted mortality risk nor the adjusted mortality risk was significantly associated with mean BMI (β −0.341 [95% CI −0.905, 0.224] and β −0.149 [95% CI −0.747, 0.448]; Table 1; Figure 2). Heterogeneity was very large (I2 99% and 98%). Replacing the quadratic term for BMI with a linear term did not materially change the results (Table 2). There were no BMI groups with means <20 kg/m2. Adjusting for smoking did not materially change the results. Asian versus non-Asian majority countries and ≥5 years versus <5 years interactions were not significant. No studies adjusted for fasting insulin or a marker of inflammation.
| Population | Mortality risk | Studies or subgroups/BMI groups/participants | Heterogeneity I2/Ʈ2 | Quadratic BMI β (95% CI) | Risk at BMI 20 kg/m2 | Risk at BMI 30 kg/m2 | Risk at BMI 40 kg/m2 |
|---|---|---|---|---|---|---|---|
|
General (long-term) |
Unadjusted | 16/47/162,118 | 99%/0.305 |
−0.341 (−0.905, 0.224) |
0.157 (0.107, 0.207) |
0.119 (0.089, 0.149) |
0.098 (0.045, 0.151) |
| Adjusted | 14/40/133,275 | 98%/0.284 |
−0.149 (−0.747, 0.448) |
0.132 (0.087, 0.176) |
0.116 (0.085, 0.148) |
0.107 (0.046, 0.169) |
|
|
Cancers (long-term) |
Unadjusted | 46/130/118,889 | 100%/0.659 |
−0.224 (−0.560, 0.111) |
0.347 (0.276, 0.418) |
0.289 (0.230, 0.348) |
0.254 (0.162, 0.346) |
| Adjusted | 33/95/106,737 | 99%/0.415 |
−0.221 (−0.550, 0.108) |
0.393 (0.320, 0.467) |
0.329 (0.260, 0.397) |
0.290 (0.183, 0.396) |
|
|
Cardiovascular diseases (long-term) |
Unadjusted | 23/71/174,696 | 100%/0.838 |
−0.829 (−1.313, −0.345) |
0.182 (0.122, 0.242) |
0.093 (0.068, 0.119) |
0.058 (0.030, 0.086) |
| Adjusted | 14/46/155,743 | 100%/1.151 |
−0.746 (−1.471, −0.021) |
0.150 (0.078, 0.222) |
0.082 (0.049, 0.115) |
0.053 (0.014, 0.092) |
|
|
Covid-19 (short-term) |
Unadjusted | 14/53/27,846 | 97%/0.446 |
−0.333 (−0.650, −0.015) |
0.179 (0.123, 0.235) |
0.137 (0.108, 0.165) |
0.113 (0.080, 0.146) |
| Adjusted | 11/41/26,300 | 98%/0.338 |
0.053 (−0.248, 0.354) |
0.129 (0.091, 0.168) |
0.135 (0.109, 0.162) |
0.139 (0.101, 0.177) |
|
|
Critically ill (short-term) |
Unadjusted | 18/61/1,396,669 | 100%/0.574 |
−0.320 (−0.668, 0.028) |
0.201 (0.133, 0.268) |
0.155 (0.123, 0.187) |
0.129 (0.090, 0.167) |
| Adjusted | 11/35/1,392,995 | 100%/0.810 |
−0.550 (−1.091, −0.010) |
0.135 (0.072, 0.198) |
0.087 (0.059, 0.114) |
0.063 (0.032, 0.095) |
|
|
NCDs (long-term) |
Unadjusted | 20/65/458,877 | 100%/0.203 |
−0.160 (−0.381, 0.061) |
0.338 (0.274, 0.403) |
0.297 (0.259, 0.335) |
0.271 (0.216, 0.326) |
| Adjusted | 12/45/447,229 | 100%/0.183 |
−0.176 (−0.430, 0.079) |
0.331 (0.261, 0.401) |
0.287 (0.246, 0.328) |
0.259 (0.199, 0.320) |
|
|
Surgical (short-term) |
Unadjusted | 30/109/2,070,009 | 100%/1.725 |
−0.415 (−0.824, −0.006) |
0.028 (0.016, 0.039) |
0.020 (0.014, 0.025) |
0.015 (0.010, 0.021) |
| Adjusted | 10/39/1,816,686 | 100%/2.295 |
−0.734 (−1.534, 0.067) |
0.025 (0.007, 0.043) |
0.014 (0.007, 0.020) |
0.009 (0.002, 0.016) |
- Note: The natural logarithm of mortality (unadjusted or adjusted) risk was regressed on the logarithm of mean BMI squared for each BMI group. I2 quantifies the percent of between-study heterogeneity. Ʈ2 is the between-study variance. Marginalized estimates of risk are reported at BMIs of 20, 30, and 40 kg/m2. Estimates presented in a lighter gray color are outside the range of the mean BMIs within the meta-analysis. Statistically significant results at P < 0.05 are bolded.
- Abbreviations: BMI, body mass index; CI, confidence interval; NCD, non-communicable chronic disease.
| Population | Mortality risk | Quadratic BMI β (95% CI) | Linear BMI β (95% CI) | Linear BMI BMI ≥ 20 β (95% CI) | Quadratic BMI Adjusts for smoking β (95% CI) | Quadratic BMI Asian/non-Asian P for interaction | Quadratic BMI ≥5 years/<5 years P for interaction |
|---|---|---|---|---|---|---|---|
|
General (long-term) |
Unadjusted |
−0.341 (−0.905, 0.224) |
−0.700 (−1.843, 0.444) |
- | - | 0.254 | 0.172 |
| Adjusted |
−0.149 (−0.747, 0.448) |
−0.318 (−1.530, 0.893) |
- |
−0.380 (−1.042, 0.281) |
0.320 | 0.271 | |
|
Cancers (long-term) |
Unadjusted |
−0.224 (−0.560, 0.111) |
−0.442 (−1.105, 0.221) |
0.054 (−0.846, 0.954) |
- | 0.392 | 0.039 |
| Adjusted |
−0.221 (−0.550, 0.108) |
−0.427 (−1.077, 0.223) |
−0.247 (−1.104, 0.611) |
−0.369 (−0.873, 0.135) |
0.417 | 0.007 | |
|
Cardiovascular diseases (long-term) |
Unadjusted |
−0.829 (−1.313, −0.345) |
−1.652 (−2.610, −0.695) |
−1.780 (−3.049, −0.510) |
- | 0.529 | 0.545 |
| Adjusted |
−0.746 (−1.471, −0.021) |
−1.500 (−2.943, −0.057) |
−2.168 (−4.044, −0.293) |
−0.331 (−0.990, 0.329) |
0.922 | 0.508 | |
|
Covid-19 (short-term) |
Unadjusted |
−0.333 (−0.650, −0.015) |
−0.662 (−1.295, −0.030) |
−0.574 (−1.389, 0.242) |
- | 0.609 | - |
| Adjusted |
0.053 (−0.248, 0.354) |
0.108 (−0.492, 0.709) |
−0.103 (−0.874, 0.669) |
0.107 (−0.170, 0.384) |
0.778 | - | |
|
Critically ill (short-term) |
Unadjusted |
−0.320 (−0.668, 0.028) |
−0.639 (−1.336, 0.057) |
−0.759 (−1.666, 0.148) |
- | 0.303 | - |
| Adjusted |
−0.550 (−1.091, −0.010) |
−1.107 (−2.190, −0.024) |
−2.058 (−3.638, −0.479) |
- | 0.339 | - | |
|
NCDs (long-term) |
Unadjusted |
−0.160 (−0.381, 0.061) |
−0.322 (−0.762, 0.118) |
−0.112 (−0.624, 0.400) |
- | 0.182 | 0.118 |
| Adjusted |
−0.176 (−0.430, 0.079) |
−0.352 (−0.860, 0.155) |
−0.097 (−0.660, 0.466) |
−0.244 (−0.520, 0.032) |
0.002 | 0.748 | |
|
Surgical (short-term) |
Unadjusted |
−0.415 (−0.824, −0.006) |
−0.828 (−1.645, −0.012) |
−0.983 (−2.030, 0.063) |
- | 0.813 | - |
| Adjusted |
−0.734 (−1.534, 0.067) |
−1.458 (−3.060, 0.144) |
−2.230 (−4.275, −0.184) |
−0.405 (−0.880, 0.069) |
0.572 | - |
- Note: The natural logarithm of mortality (unadjusted or adjusted) risk was regressed on the logarithm of mean BMI squared for each BMI group. In sensitivity analysis, (1) the quadratic term for mean BMI was replaced with a linear term for mean BMI, (2) groups with mean BMIs <20 kg/m2 were excluded, (3) a covariate for mostly Asian versus mostly non-Asian countries was added, and (4) in long-term risk populations, a covariate for the number of years of follow-up was added. Statistically significant results at P < 0.05 are bolded.
- Abbreviations: BMI, body mass index; CI, confidence interval; NCD, non-communicable chronic disease.
There were three studies47, 51, 55 (five cohorts) that modeled BMI with splines (Table 3). All had a quadratic convex shape. None of the studies adjusted for fasting insulin or a marker of inflammation. The BMIs associated with the lowest risk of mortality ranged from 23 to 34 kg/m2 (median 31 kg/m2). The BMIs associated with the highest risk of mortality were bimodal: 14 and ranged from 34 to 50 kg/m2 (median 45 kg/m2).
| Population | Study/subgroups | Model | BMI range | Shape |
|---|---|---|---|---|
|
General (long-term) |
Seino et al.55 2020/Women |
Unadjusted Cox with RCS, 3 knots | 14–34 |
Quadratic convex Lowest risk 23 Highest risk 14 |
|
Seino et al.55 2020/Men |
14–34 |
Quadratic convex Lowest risk 34 Highest risk 14 |
||
|
Jensen et al.47 2020/Women |
Age-adjusted Cox with RCS | 18–45 |
Quadratic convex Lowest risk 27 Highest risk 34 |
|
|
Jensen et al.47 2020/Men |
20–45 |
Quadratic convex Lowest risk 25 Highest risk 45 |
||
|
Seino et al.55 2020/Women |
Adjusted Cox with RCS, 3 knots | 14–34 |
Quadratic convex Lowest risk 34 Highest risk 14 |
|
|
Seino et al.55 2020/Men |
14–34 |
Quadratic convex Lowest risk 34 Highest risk 14 |
||
|
Michaëlsson et al.51 2020 |
Adjusted Cox with RCS, 3 knots | 20–50 |
Quadratic convex Lowest risk 27 Highest risk 50 |
|
|
Cancers (long-term) |
Dou et al.43 2020 |
Adjusted Cox model with piecewise segments, 2 knots | 14–37 |
Quadratic convex Lowest risk 23 Highest risk 14 and 37 |
|
Cardiovascular diseases (long-term) |
Forgie et al.96 2020/Women |
Adjusted Cox model with smooth splines | underweight-morbidly obese |
Quadratic convex Lowest risk obese Highest risk underweight |
|
Forgie et al.96 2020/Men |
underweight-morbidly obese |
Flat Lowest risk obese Highest risk underweight |
||
|
Shahim et al.110 2020 |
Adjusted Cox with penalized splines, 2 df | 18–48 |
Flat then increasing Lowest risk 18–30 Highest risk 48 |
|
|
Trammell et al.94 2020 |
Adjusted Cox with RCS | 15–75 |
Quadratic convex Lowest risk 40 Highest risk 15 |
|
|
Critically ill (short-term) |
Jee et al.133 2020 |
Unadjusted Cox with RCS | 10–45 |
Quadratic convex Lowest risk 27 or 45 with MI Highest risk 10 |
|
Secombe et al.140 2020 |
Adjusted Cox with RCS, 3 knots | 15–60 |
Quadratic convex Lowest risk 34 Highest risk 15 |
|
|
Non-communicable chronic diseases (long-term) |
Kim et al.41 2020/<65 years |
Adjusted Cox with smooth splines | 12–42 |
Decreasing Lowest risk 42 Highest risk 12 |
|
Kim et al.41 2020/≥65 years |
12–40 |
Decreasing Lowest risk 40 Highest risk 12 |
||
|
Kowall et al.155 2020 |
Adjusted Cox with RCS, 3 knots | 20–50 |
Quadratic convex Lowest risk 31 Highest risk 50 |
|
|
Surgical (short-term) |
Nishioka et al.171 2020 |
Unadjusted GAM with smooth splines | 15–40 |
Quadratic convex Lowest risk 25 Highest risk 15 and 40 |
| Adjusted GAM with smooth splines | 15–40 |
Quadratic convex Lowest risk 23 Highest risk 40 |
||
|
Scully et al.174 2020 |
Adjusted logistic with RCS, 4 knots | 18–60 |
Sigmoid Lowest risk 60 Highest risk 18 |
|
|
Other diseases (long-term) |
Zhang et al.143 2020 |
Adjusted GAM with smooth splines | 15–45 |
Quadratic convex Lowest risk 45 Highest risk 15 |
|
Other diseases (short-term) |
Choi et al.189 2020 |
Adjusted GAM with smooth splines | 8–50 |
Quadratic convex Lowest risk 32 Highest risk 50 |
- Abbreviations: BMI, body mass index; df, degrees of freedom; GAM, generalized additive model; MI, multiple imputation; RCS, restricted cubic splines.
3.4 Cancer populations
There were 38 studies43, 45, 46, 59-91, 211, 212 (40 cohorts; 2,361,275 participants) of cancer populations (Table S3); 17 cohorts were in East Asia, 10 cohorts in North America, 7 in Europe, 2 were international cohorts, 2 were in West Asia, and 1 each in South America and Africa. Mean age of participants ranged from 17 to 75 years. The percentage of males ranged from 0% to 100%. Mean BMI ranged from 16 to 33 kg/m2. Follow-up ranged from 0.9 to 12.0 years.
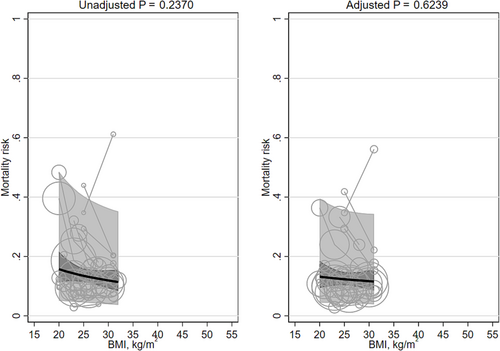
Neither the unadjusted mortality risk nor the adjusted mortality risk was significantly associated with mean BMI (β −0.224 [95% CI −0.560, 0.111] and β −0.221 [95% CI −0.550, 0.108]; Table 1; Figure 3). The heterogeneity was very large (I2 100% and 99%, respectively). Replacing the quadratic term for BMI with a linear term did not importantly change the results (Table 2). Excluding BMI groups with means <20 kg/m2 and studies that did not adjust for smoking did not importantly change the results. The interaction terms for Asian versus non-Asian majority countries were not significant. As compared to studies with <5 years of follow-up, the slope of the relation between BMI and mortality was significantly steeper in studies with ≥5 years of follow-up in unadjusted analyses (≥5 years β −0.319 [95% CI −0.687, 0.050] versus <5 years β −0.303 [95% CI −0.673, 0.066]; p = 0.039) and adjusted analyses (≥5 years β −0.264 [95% CI −0.567, 0.038] versus <5 years β −0.132 [95% CI −0.435, 0.170]; p = 0.007). Two studies45, 46 adjusted for a marker of inflammation (CRP and neutrophil-lymphocyte ratio); their pooled result was non-significant (β −0.490 [95% CI −1.066, 0.086]).
One study43 modeled BMI with splines (Table 3). It showed a quadratic convex shape; the BMI associated with the lowest mortality risk was 23 kg/m2, and the BMIs associated with the highest mortality risk were bimodal: 14 and 37 kg/m2. This study did adjust for a marker of inflammation (the neutrophil-lymphocyte ratio) but did not adjust for fasting insulin.
3.5 Cardiovascular populations
There were 22 studies92-113 (178,002 participants) with cardiovascular populations (Table S3): 7 cohorts in Europe, 6 in North America, 5 in East Asia, 2 were international cohorts, and 1 each West Asia and the Pacific. Mean age of participants ranged from 37 to 83 years. The percentage of males ranged from 7% to 96%. Mean BMI ranged from 17 to 43 kg/m2. Follow-up ranged from 0.8 to 9.0 years.
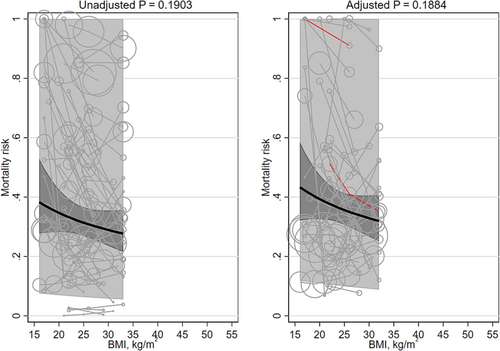
Unadjusted and adjusted mortality risk was associated with mean BMI (β −0.829 [95% CI −1.313, −0.345] and β −0.746 [95% CI −1.471, −0.021]; Table 1; Figure 4), both favoring higher BMIs. The heterogeneity was very large (I2 100% and 100%, respectively). Unadjusted mortality risk decreased, on average, from 18.2% (95% CI 12.2, 24.2) at a BMI of 20 kg/m2 to 5.8% (95% CI 3.0, 8.6) at a BMI of 40 kg/m2. Adjusted mortality risk decreased, on average, from 15.0% (95% CI 7.8, 22.2) at a BMI of 20 kg/m2 to 5.3% (95% CI 1.4, 9.2) at a BMI of 40 kg/m2. Results remained statistically significant after replacing the quadratic term for mean BMI with a linear term (Table 2) or when groups with mean BMIs <20 kg/m2 were excluded. The adjusted mortality risk was no longer significant after removing studies that did not adjusting for smoking status. The interaction terms for Asian/non-Asian majority countries and for ≥5 years/<5 years were non-significant. No studies adjusted for fasting insulin or a marker of inflammation.
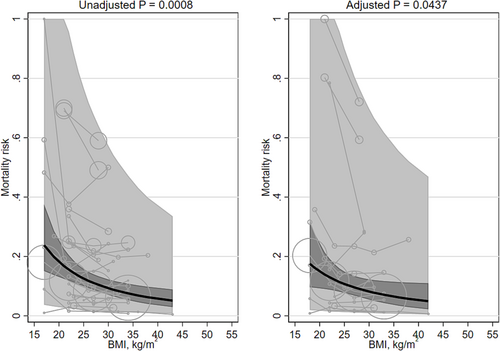
There were three studies94, 96, 110 (four cohorts) that modeled BMI with splines (Table 3). None of these studies adjusted for fasting insulin or a marker of inflammation. The BMIs associated with the lowest mortality risk were 18–30 kg/m2, “obese” and 40, covering the entire range. The BMIs associated with the highest mortality risk were bimodal: 15, “underweight” and 48 kg/m2. None of the studies adjusted for fasting insulin or a marker of inflammation.
3.6 Covid-19 populations
There were 15 studies42, 44, 114-126 (29,940 participants) with Covid-19 populations (Table S3): 9 cohorts were in North America, 5 in Europe, and 1 in East Asia. Mean age of participants ranged from 48 to 73 years. The percentage of males ranged from 46% to 91%. Mean BMI ranged from 17 to 52 kg/m2. Most (N = 10) followed participants from the duration of hospitalization; the others ranged from 7 to ≥39 days.
Unadjusted mortality was significantly associated with mean BMI (β −0.333 [95% CI −0.650, −0.015]) and favored higher BMIs. Unadjusted mortality risk decreased, on average, from 17.9% (95% CI 12.3, 23.5) at a BMI of 20 kg/m2 to 11.3% (95% CI 8.0, 14.6) at a BMI of 40 kg/m2. The adjusted mortality risk was not significantly associated with mean BMI (β 0.053 [95% CI −0.248, 0.354]; Table 1; Figure 5). The heterogeneity was very large (I2 97% and 98%, respectively). Replacing the quadratic term for BMI with a linear term did not importantly change the results (Table 2). The association between BMI and mortality was no longer significant after excluding BMI groups with means <20 kg/m2 from the unadjusted populations. Adjusting for smoking did not materially change the results. The interaction terms for Asian/non-Asian majority countries were non-significant. Two studies42, 44 adjusted for a marker of inflammation (both CRP); their pooled results were non-significant (β −0.362 [95% CI −1.657, 0.933]).
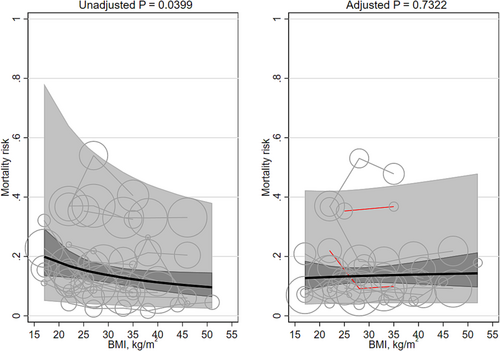
No studies modeled BMI with splines.
3.7 Critically ill populations
There were 18 studies89, 127-143 (1,415,697 participants) with critically ill populations (Table S3): 11 cohorts in North America, 3 each were in East Asia and in Europe, and 1 in the Pacific. Mean age of participants ranged from 41 to 87 years. The percentage of males ranged from 46% to 94%. Mean BMI ranged from 17 to 47 kg/m2. Most (N = 14) followed participants from the duration of hospitalization; the others ranged from 30 to 90 days.
Unadjusted mortality was not significantly associated with mean BMI (β −0.320 [95% CI −0.668, 0.028]). The adjusted mortality risk was significantly associated with mean BMI (β −0.550 [95% CI −1.091, −0.010]; Table 1; Figure 6) and favored higher BMIs. Adjusted mortality risk decreased, on average, from 13.5% (95% CI 7.2, 19.8) at a BMI of 20 kg/m2 to 6.3% (95% CI 3.2, 9.5) at a BMI of 40 kg/m2. The heterogeneity was very large (I2 100% and 100%, respectively). Results were not materially affected after replacing the quadratic term for mean BMI with a linear term (Table 2) or when groups with mean BMIs <20 kg/m2 were excluded. The interaction terms for Asian/non-Asian majority countries were non-significant. No studies adjusted for fasting insulin or a marker of inflammation.
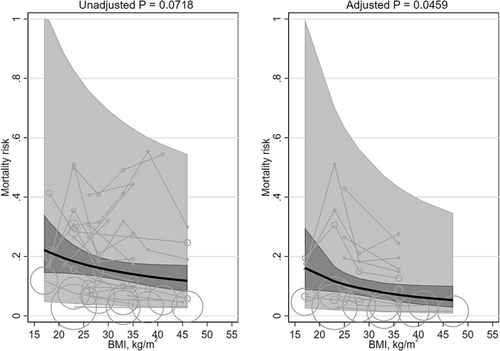
Two studies133, 140 modeled BMI with splines (Table 3). None of these studies adjusted for fasting insulin or a marker of inflammation. Both had quadratic convex shapes; the BMI associated with the lowest mortality risk was 27 and 34 kg/m2, and the BMIs associated with the highest mortality risk were 10 and 15 kg/m2. None of the studies adjusted for fasting insulin or a marker of inflammation.
3.8 Non-communicable chronic disease populations
There were 16 studies144-159 (425,072 participants) with diabetes, pancreatitis, kidney disease, or hepatic disease populations (Table S3): 7 cohorts were in North America, 5 cohorts were in Europe, 3 in East Asia, and 1 in South Asia. Mean age of participants ranged from 45 to 64 years. The percentage of males ranged from 30% to 80%. Mean BMI ranged from 17 to 55 kg/m2. Follow-up ranged from 0.5 to 22.4 years.
Neither unadjusted nor adjusted mortality risk were associated with mean BMI (β −0.160 [95% CI −0.381, 0.061] and β −0.176 [95% CI −0.430, 0.079]; Table 1; Figure 7). The heterogeneity was very large (I2 100% and 100%, respectively). Replacing the quadratic term for mean BMI with a linear term did not materially change the results (Table 2), nor did excluding groups with mean BMI < 20 kg/m2, nor did adjusting for smoking status. The interaction terms for ≥5 years/<5 years were non-significant. Including an interaction term for Asian/non-Asian majority countries did significantly modify the adjusted results. The slope in studies in majority non-Asian countries was significantly steeper in the adjusted populations (non-Asian β −0.144 [95% CI −0.410, 0.123] versus Asian β −0.123 [95% CI −0.413, 0.167]; P = 0.002). No studies adjusted for fasting insulin or a marker of inflammation.
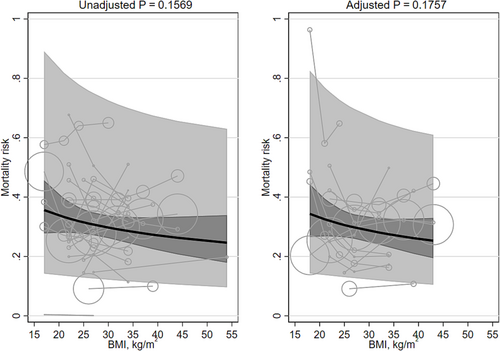
There were two studies41, 155 (three cohorts) that modeled BMI with splines (Table 3). The two cohorts from the same study both showed a decreasing curve; the other shape was quadratic convex. The BMIs associated with the lowest mortality risk ranged from 31 to 42 kg/m2 (median 40 kg/m2). The BMIs associated with the highest mortality risk were bimodal: 12 and 50 kg/m2. None of the studies adjusted for fasting insulin or a marker of inflammation.
3.9 Surgical populations
There were 28 studies70, 96, 107, 109, 150, 156, 160-181 (29 cohorts; 2,068,365 participants) with surgical populations (Table S3): 17 cohorts in North America, 6 were in Europe, 4 in East Asia, and 1 each in South Asian and the Pacific. Mean age of participants ranged from 46 to 83 years. The percentage of males ranged from 0% to 88%. Mean BMI ranged from 17 to 66 kg/m2. Six followed participants from the duration of hospitalization. The others used a range of follow-up durations extending from the immediate perioperative period to 90 days postoperatively; most (N = 19) were 30 days in duration.
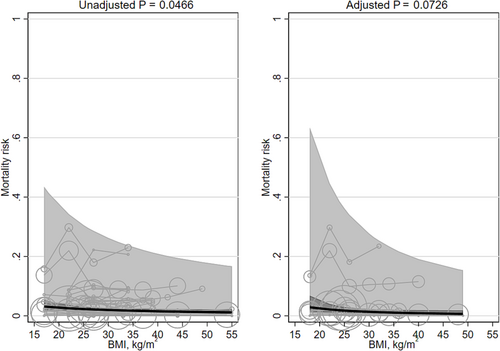
Unadjusted mortality was significantly associated with mean BMI (β −0.415 [95% CI −0.824, −0.006]) and favored higher BMIs. Unadjusted mortality risk decreased, on average, from 2.8% (95% CI 1.6, 3.9) at a BMI of 20 kg/m2 to 1.5% (95% CI 1.0, 2.1) at a BMI of 40 kg/m2. The adjusted mortality risk was not significantly associated with mean BMI (β −0.734 [95% CI −1.534, 0.067]; Table 1; Figure 8). The heterogeneity was very large (I2 100% and 100%, respectively). There was one large study165 whose dataset overlapped with other studies' datasets.161, 162, 168, 172, 179, 180 When we removed that one large study, the unadjusted results were no longer significant (β −0.323 [95% CI −0.756, 0.110]), and adjusted results remained non-significant (β −0.730 [95% CI −1.786, 0.326]). Replacing the quadratic term for BMI with a linear term did importantly change the results (Table 2). Unadjusted risk was no longer significant after excluding BMI groups with means <20 kg/m2, and adjusted mortality risk became significant (β −2.230 [95% CI −4.275, −0.184]). Adjusting for smoking did not materially change the results. The interaction terms for Asian/non-Asian majority countries were non-significant. No studies adjusted for fasting insulin or a marker of inflammation.
Two studies171, 174 modeled BMI with splines (Table 3). One had quadratic convex shapes (for both unadjusted and adjusted results), and the other study displayed a sigmoid shape. The BMIs associated with the lowest mortality risk were bimodal: 23, 25 and 60 kg/m2. The BMIs associated with the highest mortality risk were also bimodal: 15, 18, and 40 kg/m2. None of the studies adjusted for fasting insulin or a marker of inflammation.
3.10 Summary and other populations
In summary, the results from other populations for both long-term (nine studies93, 143, 178, 182-187; 31,812 participants; Table S2; Figure S1) and short-term (six studies93, 188-192; 517,818 participants; Figure S2) outcomes were similar to that of the categorized populations. Mortality risk was not significantly associated with BMI. The spline shapes were quadratic convex with BMIs associated with the lowest mortality risk in the overweight to obesity level 1 ranges (25 to 35 kg/m2) and where the BMIs associated with the highest mortality risk appeared at both ends of the BMI range (Table 3).
4 DISCUSSION
We examined the unadjusted and adjusted associations between BMI and mortality in general populations and six broadly grouped clinical populations. Of these 14 meta-analyses, none showed a significant overall association between higher BMI and higher mortality. In one analysis, mortality appeared non-significantly higher among people with higher BMI. Five meta-analyses found that higher BMI was associated with a significantly lower risk of death: unadjusted and adjusted analyses in cardiovascular populations; unadjusted analyses in Covid-19 populations; adjusted analyses in critically ill populations; and unadjusted analyses in surgical populations. The association between higher BMI and lower mortality remained statistically significant when mean BMI was modeled as a linear term instead of a quadratic term and in three of five cases when participants with low BMI (<20 kg/m2) were removed. In the remaining two analyses, the slope of the association between BMI and mortality appeared to favor higher BMI but was not statistically significant. The associations in the remaining clinical populations showed no significant differences in mortality by BMI.
Despite the common perception that obesity is associated with worse clinical outcomes among people with Covid-19 infection, unadjusted analyses of 14 studies (27,846 participants) showed that mortality was significantly lower among people with higher BMI, with no significant association between BMI and mortality after adjustment.
Although markers of inflammation and fasting insulin confound the association between BMI and mortality,8 only 5/154 studies42-46 (3.2%) adjusted for CRP or the neutrophil-lymphocyte ratio, and none adjusted for fasting insulin levels. Only one of the spline analyses adjusted for a marker of inflammation; none adjusted for fasting insulin.
Therefore, since few studies in our meta-analyses adjusted for hyperinsulinemia or hyperinflammation, this together with the clinical heterogeneity (I2 ≥ 97%) in the source populations will have reduced our ability to investigate the possibility that higher BMI is associated with lower mortality in the general population and among people with cancer or an NCD.
4.1 Support from other studies
Using a simple search, we found 14 meta-analyses that also explored the association between BMI and mortality: 3 each in heart failure193-195 and percutaneous coronary intervention,196-198 1 in atrial fibrillation,199 1 in acute coronary syndrome,200 1 in aortic stenosis,201 1 in type 2 diabetes,202 1 in colorectal cancer,203 1 in lung cancer,204 1 in acute respiratory distress,7 and 1 in pneumonia.205 All found that BMI in the overweight and obesity range was associated with significantly lower mortality as compared to BMI 18–25 kg/m2. Similar to some of the findings from our spline analyses, three of these meta-analyses193, 197, 202 suggested that the protective associations of a high BMI may begin to attenuate around 45 kg/m2.
4.2 Importance of the findings
Obesity is often framed as a reversible condition that can be modified by dieting, although dieting has not been shown to lead to long-term weight loss in the majority of people and may cause harm, including increases in insulin and inflammation levels, which may lead to further weight gain.206-208 Kong et al.209 found that patients with hyperinsulinemia and hyperinflammation are in fact resistant to weight loss. While bariatric surgery does decrease levels of fasting insulin in the short term,210 the long-term clinical benefits of surgery (and weight-loss medications) have not been thoroughly studied. Given the findings of the current review, we suggest that the merits of public health interventions to treat obesity and/or promote weight loss should be critically re-examined, in parallel with increased emphasis on the adverse effects of hyperinsulinemia and chronic inflammation in people with and without obesity.
4.3 Limitations
This study has limitations. First, this meta-analysis used summary-level rather than individual patient-level data and is therefore vulnerable to ecologic fallacy. Mean within-group BMI was used in place of individual BMI, and thus, the groups with the highest and lowest BMIs would be more representative of the participants with BMI closer to the center of the BMI population distribution. To note, the results from the spline parametrizations, where the BMI range often extended beyond 45 kg/m2, allow for the possibility of an increase in mortality risk at the higher end of the BMI spectrum. Second, due to the very large anticipated search yield, this review was limited to studies published in 2020 and therefore is not a complete inventory of all studies that examined this topic. Although the search was limited to a single publication year, there is no reason to expect that data from this year would differ from data published earlier or later. Third, the heterogeneity, as expected, was enormous (I2 ≥ 97%). The objective of this systematic review was to gather evidence of the “average” associations between BMI and mortality across many clinical populations. The intent was not to definitively characterize the association in a particular clinical population. Fourth, in populations defined by access to a treatment (including surgery), the selection of participants may have been subject to bias, that is, to differentially select healthier patients (with less comorbidities) on either end of the extremes of BMI. Last, we achieved our secondary goal of determining the extent to which recent studies account for the confounding effect of inflammation and fasting insulin when assessing the relation between BMI and mortality. Unfortunately, only five studies42-46 adjusted for a marker of inflammation, and no studies adjusted for fasting insulin, making it impossible for our review to isolate the independent association between BMI and mortality.
5 CONCLUSION
We found no evidence that higher BMI was associated with a higher mortality risk. Rather, higher BMI was associated with lower mortality in several clinical populations. These findings suggest that the role of inflammation and fasting insulin in mediating adverse outcomes that are typically attributed to obesity should be further considered, whereas the merits of public health interventions to treat obesity and/or promote weight loss should be critically re-examined.
AUTHOR CONTRIBUTIONS
NW conceived the study, did the statistical analyses, and wrote the first draft of the manuscript. ETC designed the search strategies. All authors contributed to the design, interpretation of results, and critical revision of the article for intellectually important content. NW had full access to all the data in the study and takes responsibility for the integrity of the data and the accuracy of the data analysis.
ACKNOWLEDGMENTS
The authors of this report are grateful to Nasreen Ahmad and Sophanny Tiv for reviewer support and Ghenette Houston for administrative support.
CONFLICT OF INTEREST
No conflict of interest statement.
Open Research
DATA AVAILABILITY STATEMENT
This is a systematic review of published summary statistics. All included studies are cited, and thus, all the data are currently available.


