Mycobacterium tuberculosis virulence-regulator PhoP interacts with alternative sigma factor SigE during acid-stress response
Summary
The ability to sense acid stress and mount an appropriate adaptive response by Mycobacterium tuberculosis, which adapts a long-term residence in the macrophage phagosome, remains one of the critical features that defines mycobacterial physiology and its intracellular location. To understand the mechanistic basis of adaptation of the intracellular pathogen, we studied global regulation of M. tuberculosis gene expression in response to acid stress. Although recent studies indicate a role for the virulence-associated phoP locus in pH-driven adaptation, in this study, we discovered a strikingly novel regulatory mechanism, which controls acid-stress homeostasis. Using mycobacterial protein fragment complementation and in vitro interaction analyses, we demonstrate that PhoP interacts with acid-inducible extracytoplasmic SigE (one of the 13 M. tuberculosis sigma factors) to regulate a complex transcriptional program. Based on these results, we propose a model to suggest that PhoP–SigE interaction represents a major requirement for the global acid stress response, absence of which leads to strongly reduced survival of the bacilli under acidic pH conditions. These results account for the significant growth attenuation of the phoP mutant in both cellular and animal models, and unravel the underlying global mechanism of how PhoP induces an adaptive program in response to acid stress.
Graphical Abstract
The ability of Mycobacterium tuberculosis to thrive in acidic environment is a key to its success as an intracellular pathogen. Thus, we examined whether the virulence regulator PhoP, which has been implicated in M. tuberculosis pH homeostasis, cooperates functionally with the mycobacterial transcription machinery. We show that (i) PhoP specifically interacts with one of the acid-inducible sigma factors SigE and (ii) PhoP–SigE interaction represents a major requirement for the glsobal acid stress response.
Introduction
Adaptation of the pathogen to hostile stress within the host cells and its tolerance to drugs are controlled at the level of transcription of genes, whose products specifically help the bacteria to survive and grow under varying microenvironments. M. tuberculosis continues to be one of the most successful intracellular human pathogens with the ability to persist in human tissues for years. During this phase of latent infection the bacteria continually encounter adverse environmental conditions. M. tuberculosis, however, is able to adapt to a long-term residence in the macrophage phagosome. Notably, tubercle bacilli within the lysosome encounter a highly acidic environment (pH < 5.0) (MacMicking et al., 2003; Saviola et al., 2003; Vandal et al., 2008; Vandal et al., 2009a). Thus, the ability to sense pH stress and quickly readjust to the new condition is a critically important feature that defines mycobacterial physiology and its intracellular location. Indeed, there is evidence that M. tuberculosis encounters acidic environments in vivo and failure of the pH-dependent adaptations results in strong attenuation of virulence during mouse infection (Vandal et al., 2008). In agreement with this result, transcription profiling of M. tuberculosis in acidic pH, both in vitro as well as in macrophages, demonstrates substantial change in the gene expression pattern (Fisher et al., 2002; Rohde et al., 2007).
It is well established that M. tuberculosis growth and gene expression are tightly regulated by environmental pH (Vandal et al., 2008, 2009a,b; Abramovitch et al., 2011). While the mechanism by which M. tuberculosis responds to pH stress remains to be understood, studies on global transcriptional response to acid stress suggest possible role of multiple regulators in response to the cue of phagosomal acidification (Rohde et al., 2007). The role of a virulence-associated phoPR two-component system in pH-dependent gene expression of M. tuberculosis became obvious when several pH-sensitive genes including pks2, msl3, lipF, Rv2396 and Rv3612c-3616c were shown to be induced by PhoP (Walters et al., 2006). Moreover, the phagosomal acidic pH regulon (Rohde et al., 2007) shows significant overlap with the phoPR regulon (Gonzalo Asensio et al., 2006; Walters et al., 2006), suggesting that phoPR plays a major role in pH homeostasis. In an attempt to define the functions of phagosomal pH-responsive genes, Abramovitch et al have identified an acid and phagosome-regulated (apr) locus encompassing the MT2466, MT2467 and Rv2396 genes, designated as aprA, aprB and aprC, respectively. More recent results suggest the apr locus is acid inducible in M. tuberculosis CDC1551 and not in M. tuberculosis H37Rv (Schreuder et al., 2015). However, in line with the role of the phoPR system in pH-driven adaptation to the macrophage phagosome, expression of aprABC was shown to be dependent on the phoPR system (Abramovitch et al., 2011). Additional evidence suggests that available carbon source and the phoPR locus contribute to slow growth of M. tuberculosis under acidic conditions (Baker et al., 2014). What remains to be determined is how PhoP coordinates with the transcription machinery to induce an adaptive program in response to acid stress.
To investigate the underlying mechanism by which PhoP mounts the adaptive program of M. tuberculosis in response to acid stress, we compared survivability of WT and the ΔphoP mutant under normal and acid-stress condition. Our results confirm that phoP locus plays a major role in survival of the tubercle bacilli during acid stress. Next, we probed for a connection between acid stress and specific sigma factor expression since it is well-established that alternative sigma factors of the multi-subunit RNAP holoenzyme and members of this subfamily account for the extraordinary capability of M. tuberculosis to accommodate varying environmental cues (Ando et al., 2003; Geiman et al., 2004; Sun et al., 2004; Karls et al., 2006; Rodrigue et al., 2006; Sachdeva et al., 2010). Finally, we identify and establish that PhoP interacts with the mycobacterial transcription machinery to induce a stress-specific transcriptional program. Our results unravel the mechanism by which PhoP and the extracytoplasmic sigma factor SigE, one of the stress responsive sigma factors of M. tuberculosis (Manganelli et al., 2001; Raman et al., 2001) together coordinate a global transcriptional program of the tubercle bacilli in response to acid stress.
Results
phoP regulates the expression of acid -inducible genes of M. tuberculosis
During phagosome maturation M. tuberculosis responds synergistically to changes of Cl- concentration and pH through the phoPR regulatory system (Tan et al., 2013), consistent with the role of a phoPR in pH-driven adaptation of the pathogen via direct regulation of acid- and phagosome-regulated gene (aprABC) (Abramovitch et al., 2011). More recently, the phoPR system and the available carbon source have been shown to regulate slow growth of M. tuberculosis at acidic pH (Baker et al., 2014). Based on these results, we compared the in vitro growth of WT, ΔphoP and complemented ΔphoP under normal and acidic pH (Fig. 1A). Figure 1B shows CFU ml−1 data of WT and mutant strains grown for 6 days under normal and acidic pH conditions. Construction of ΔphoP and the complemented ΔphoP M. tuberculosis have been described previously (Walters et al., 2006) (Table S1). phoP expression was complemented by transforming the ΔphoP mutant strain with pSM607, which carries a 3.6 kb DNA fragment of Mtb phoPR (including the 200 bp phoP promoter region), and includes a hygromycin resistance cassette, attP site and the gene encoding phage L5 Integrase. Our results show that ΔphoP is approximately 3-4 fold defective in growth compared to the WT strain under acidic pH (Fig. 1A and B). In contrast, there was no significant difference in growth between the WT and the mutant under normal growth conditions. More importantly, complementation of ΔphoP restored the growth pattern of the mutant under acidic conditions to the level of the WT strain. Thus, we conclude that phoP locus plays a major role for M. tuberculosis growth under acid stress.
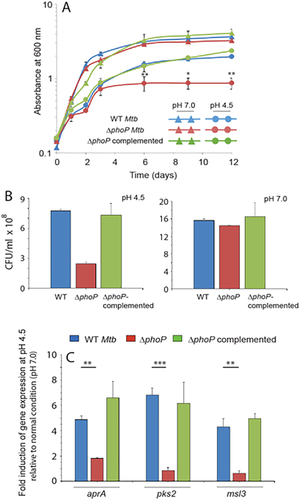
phoP locus is required for M. tuberculosis growth under acidic stress.
A. Growth curves of WT, ΔphoP and the ΔphoP-complemented mutant were compared under acidic pH and normal conditions.
B. CFU ml−1 data of WT and the mutant strains grown for 6 days under normal and acidic pH. Although ΔphoP grows comparably well to that of wild-type strain under normal conditions, it is significantly growth defective under acidic pH. More importantly the growth defect of the mutant under acidic pH is largely restored in the ΔphoP-complemented strain.
C. RT-PCR was performed to determine expression levels of acid-inducible genes in WT, ΔphoP and ΔphoP-complemented strains as described in the ‘Experimental procedures’ section. The average fold difference in expression levels of genes with standard deviations from multiple replicates of experiments were determined from at least three independent RNA preparations (**P < 0.01; ***P < 0.001).
Having shown a striking effect of the phoP locus on bacterial growth under acidic pH, we next probed expression of acid-inducible genes in WT and the ΔphoP mutant. A comprehensive list of acid-inducible genes has been reported by Russell and coworkers while studying the complex gene expression of M. tuberculosis in response to multiple environmental cues within macrophages (Rohde et al., 2007). Notably, many of the pH-sensitive genes, including pks2, msl3, Rv2331, Rv2633, Rv2396 and Rv3612c-3616c, had previously been shown to be activated by PhoP (Walters et al., 2006), suggesting a regulatory role for the phoPR system in cytoplasmic pH homeostasis. Table S2 lists the page-purified oligonucleotides used in gene expression studies using RT-PCR. Importantly, we observed that expression of these genes were reproducibly lowered by 2-3 fold in the ΔphoP mutant relative to the WT strain under acid stress compared to normal condition (Figs. 1B and S1). As expected, complementation of the ΔphoP mutant restored stress-dependent gene expression to the WT level. From these results, we conclude that under acidic conditions phoP acts as an activator of acid-inducible genes of M. tuberculosis.
PhoP interacts with acid-inducible mycobacterial sigma factors SigE and SigH
Numerous previous investigations had reported that extra-cytoplasmic sigma factors significantly contribute to mycobacterial environmental adaptability. To determine which sigma factors exhibit acid-stress dependent expression, we compared global expression profile of M. tuberculosis sigma factors for cells grown with or without acid stress (Fig. 2A). Notably, three sigma factors (sigB, sigE and sigH) out of a total of 13 showed approximately 5–12-fold activation of acid-inducible gene expression. Other sigma factor encoding genes, under identical conditions, did not display a significant difference in their expression pattern.
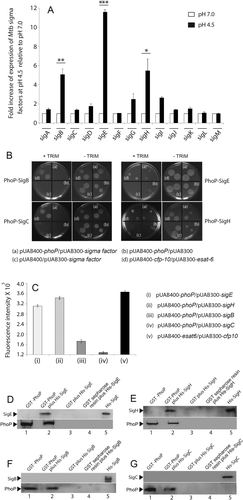
Acid-inducible expression of M. tuberculosis sigma factors.
A. To examine which M. tuberculosis sigma factors are differentially regulated in response to acid stress, the expression of 13 sigma factor-encoding genes was compared by RT-PCR using WT M. tuberculosis grown with or without acid-stress (compare filled columns with empty columns). The results show average values with standard deviations derived from at least three independent RNA preparations (*P < 0.05; **P < 0.01; ***P < 0.001).
B. To investigate which of the acid-inducible sigma factors interact with PhoP, M-PFC experiments utilized expression of M. tuberculosis PhoP and relevant sigma factors in M. smegmatis as described in the ‘Experimental procedures’ section. Coexpression of the phoP/sigE or phoP/sigH pair (a), relative to empty vector controls pUAB400-phoP/pUAB300 (b), or pUAB400/pUAB300-sigE/sigH (c), supports M. smegmatis growth, suggesting specific PhoP/SigE and PhoP/SigH interactions. Coexpression of the pUAB400-cfp-10/pUAB300-esat-6 (d) was used as a positive control (in presence of TRIM) and all of the strains grew well in absence of TRIM.
C. The strengths of protein–protein interactions in mycobacteria were quantified by Alamar Blue fluorescent assay. Samples were collected in 96-well microtiter plates and change of color from blue to fluorescent pink reflects protein–protein interaction. To this end, M. smegmatis cells were cotransformed with plasmids expressing following protein partners (i) PhoP/SigE, (ii) PhoP/SigH, (iii) PhoP/SigB, (iv) PhoP/SigC and (v) ESAT-6/CFP-10 (as a positive control). The change in intensity of color was measured by a microtiter plate fluorescence reader at an excitation wavelength of 530 nm and emission wavelength of 590 nm. TRIM concentration was 12.5 µg ml−1 and samples containing equal number of M. smegmatis cells (105 cfu) were analyzed in triplicate.
D–G. To investigate in vitro interactions purified His6-tagged SigE (D) or His6-tagged SigH (E) were incubated with glutathione-Sepharose previously immobilized with GST-PhoP. Fractions of bound proteins (lane 2) were analysed by Western blot using anti-His (upper panel) or anti-PhoP antibody (lower panel). Replicate experiments involved use of glutathione-Sepharose immobilized with GST alone (lane 3), or the resin alone (lane 4); lane 1 and lane 5 resolve purified GST-PhoP and indicated His6-tagged sigma subunits respectively. As controls, identical experiments investigated in vitro interactions between purified His6-tagged SigB (F) or His6-tagged SigC (G).
Since the phoP locus plays a major role in acid-inducible gene expression of M. tuberculosis, we next investigated whether PhoP interacts with any of the acid-inducible sigma factors. Notably, ChIP-sequencing results show the PhoP binding sites (within the PhoP-regulated promoters) are often within 50–100 bp of the transcription start sites (Solans et al., 2014; Broset et al., 2015). Thus, we hypothesized interactions between PhoP and the sigma factors as a possible mechanism of transcriptional regulation. To examine specific protein–protein interaction(s), we utilized a previously reported mycobacterial protein fragment complementation assay (M-PFC) using M. smegmatis as the surrogate host (Singh et al., 2006). In this assay, two interacting mycobacterial proteins are independently-fused to the domains of murine dihydrofolate reductase (mDHFR); when coexpressed in mycobacteria they reconstitute functionally active mDHFR enzyme, conferring bacterial resistance to trimethoprim (TRIM). We constructed the bait and prey plasmids as C-terminal fusions with complementary fragments of mDHFR. The oligonucleotides used in cloning, and the plasmid constructs used in expression of fusion proteins are listed in Tables S3 and S4, respectively. The corresponding plasmids upon cotransformation into M. smegmatis were selected on 7H10/Kan/Hyg either in the presence or absence of 15 µg ml−1 TRIM. Strikingly, M. smegmatis cells coexpressing PhoP/SigE and PhoP/SigH grew well in the presence of TRIM (Fig. 2B). As controls, cells containing empty vectors showed no growth on 7H10/TRIM plates, while all of the M. smegmatis strains grew well on 7H10 plates lacking TRIM. However, cells coexpressing PhoP/SigB and PhoP/SigC pairs did not grow in presence of TRIM. These results suggest specific protein–protein association between PhoP–SigE and PhoP–SigH, respectively. In additional M-PFC experiments under identical conditions, none of the other M. tuberculosis sigma factors tested showed interaction with PhoP (Fig. S2).
Having shown PhoP/SigE and PhoP/SigH interactions via the survival-based assay of M. smegmatis on 7H10/TRIM plates in M-PFC experiments, we next used Alamar Blue, an oxidation/reduction indicator, to quantitatively assess strengths of these interactions. In this assay, reduction of Alamar Blue correlates with the change of a nonfluorescent blue appearance to a fluorescent pink color, which is directly connected to extent of bacterial growth, which in turn depends upon the efficiency of reconstitution of mDHFR controlled by interacting mycobacterial proteins (Singh et al., 2006). For quantitative assessment, the emission intensity was set at 590 nm, while the samples were excited at 530 nm. M. smegmatis strains harboring the interacting clones (pUAB400-phoP/pUAB300-sigE and pUAB400-phoP/pUAB300-sigH) were cultured in 7H9/kan/hyg/TRIM and freshly inoculated in 96-well microtiter plates. Cells containing phoP/sigE and phoP/sigH clones grew well and developed pink color (Fig. 2C). However, for M. smegmatis cells containing phoP/sigB and phoP/sigC expressing clones, there was insignificant color change, confirming the specificity of the assay. It should be noted that (i) while sigB expression is activated under acid stress, sigC expression remains unaffected (Fig. 2A) and (ii) pH-dependent activation of sigB expression is consistent with sigB being a target of SigE and SigH (Raman et al., 2001; Manganelli et al., 2002).
We next verified PhoP–SigE and PhoP–SigH interactions in vitro using recombinant GST-PhoP with His6-tagged SigE and SigH proteins, expressed and purified using plasmid constructs listed in Table S5. Here, GST-PhoP was immobilized on glutathione-sepharose followed by incubation with purified SigE and SigH, respectively. Escherichia coli-derived His6-tagged M. tuberculosis SigE and SigH are shown in Fig. S3A. Upon elution of column-bound proteins we could detect the presence of both proteins in the same fraction (lane 2; Fig. 2D and E, respectively). Absence of a detectable signal with only GST-tag (lane 3) or the resin alone (lane 4) allowed us to conclude that PhoP interacts with SigE and SigH. As controls, we have carried out identical experiments using His-tagged SigB and SigC proteins (Fig. 2F and G, respectively). The plasmid constructs over-expressing SigB and SigC are listed in Table S5. However, in these experiments we were unable to detect presence of both proteins (His tagged and the GST tagged) in the same fraction. From these results, we conclude that PhoP does not appear to interact with SigB or SigC. Importantly, these results are in agreement with M-PFC data which suggest that neither of these sigma factors interact with PhoP (Fig. 2B). Together, we conclude that PhoP interacts with SigE and SigH (and not SigB or SigC).
SigE regulates stress-specific expression of acid -inducible genes of M. tuberculosis
We have unambiguously shown above the role of phoP locus in activating expression of acid-stress inducible genes. We also established that PhoP interacts with both the acid-inducible sigma factors SigE and SigH. We next investigated if acidic pH influences expression of the sigE and sigH regulon. To investigate this, we compared the expression of representative SigE- and SigH-regulated genes in cells grown under normal versus acid stress conditions (Fig. 3A). Note that while Rv1130c and fadE24 expression are known to be regulated by SigE (Manganelli et al., 2001), papA4 and trxB2 expression are known to be controlled by SigH (Manganelli et al., 2002). Our results clearly show that at acidic pH, both SigE- and SigH-regulated genes are expressed at a significantly higher level compared to normal conditions.
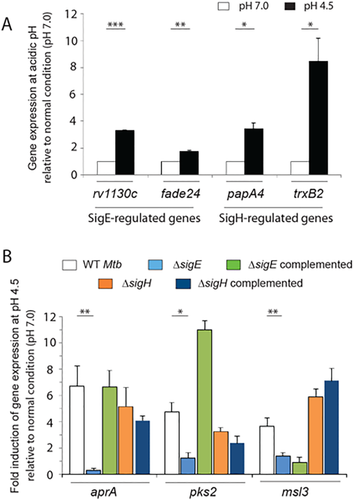
sigE but not sigH is required for in vivo expression of acid-inducible genes of M. tuberculosis.
To examine the effect of acid stress on expression of the sigE and sigH regulon, RT-PCR was carried out to compare expression levels of (A) SigE- and SigH-regulated representative genes for WT M. tuberculosis grown under normal condition and acidic pH as described in the ‘Experimental procedures’ section.
B. Wild type (WT), ΔsigE mutant and the ΔsigH mutant M. tuberculosis along with correspondingly complemented mutant strains were grown under normal condition (pH 7.0) as well as acidic pH (pH 4.5) and RT-PCR experiments compared expression levels of indicated genes in the mutant strains relative to their levels in the WT strain both under normal condition as well as acidic pH as described in the legend to Fig. 1C. The average fold differences in expression levels with standard deviations from multiple replicates of experiments were determined from at least three independent RNA preparations (*P < 0.05; **P < 0.01; ***P < 0.001).
Next, we examined which of the two sigma factors is critically important for acid-inducible gene expression. To this end, we compared expression of these genes in WT, ΔsigE and ΔsigH. Gene disruption of sigE and sigH in the respective mutants, as described previously (Manganelli et al., 2001, Manganelli et al., 2002), has been verified (Fig. S3). While acid-inducible activation of the indicated genes was reproducibly observed in WT, most of the genes (but not all) under identical conditions failed to display acid-inducible upregulation in the ΔsigE mutant (Figs. 3B and S4, respectively). In contrast, ΔsigH showed acid-inducible activation of these genes similar to that of WT when compared between normal pH and acidic condition. More importantly, complementation of the ΔsigE could restore stress-specific activation of gene expression to its level comparable to the WT. From these results, we conclude that SigE plays a key role as a specific activator of acid-inducible genes of M. tuberculosis.
To determine whether sigH expression level is controlled by SigE, we compared sigH expression levels in the WT and the ΔsigE mutant (Fig. S5). While sigB showed approximately 10-fold lower expression in ΔsigE M. tuberculosis compared to the WT strain, sigH showed 1.6–2.0-fold difference in expression between the WT and the mutant strain both under normal and acidic pH conditions. Notably, our results showing SigE functioning as a regulator of sigB expression is consistent with previously reported results (Raman et al., 2001). However, these results do not offer an explanation as to why acid-inducible genes remain unaffected in ΔsigH (Fig. 3) although sigH expression is induced under acidic pH conditions (Fig. 2).
Having shown that acid-inducible expression of genes are regulated by both PhoP and the extra-cytoplasmic sigma factor SigE, we next assessed in vivo recruitment of PhoP and SigE within acid-inducible promoters by chromatin immunoprecipitation (ChIP)-qPCR (Fig. 4). In ChIP experiments, DNA–protein complexes in growing cells are cross-linked by formaldehyde, cells are disrupted and cellular DNA in the cell lysate is sonicated. The total lysate, after removing the cell debris, is next used for immunoprecipitation (IP) using a specific antibody (raised against the regulator as the antigen) to assess recruitment of the specific regulator. Quantitative-PCR using IP DNA determines the enrichment of the PCR signal, which is a direct measure of recruitment of the regulator. ChIP assays were performed as described in the ‘Experimental procedures’ section using affinity-purified anti-PhoP and anti-SigE antibodies, respectively. Our results show that relative to a mock sample (without antibody as a control), anti-PhoP antibody showed comparable PCR enrichment for cells grown under normal condition (empty columns) to cells grown under acid-stress (filled columns) (Fig. 4A). Using gapdh-specific primers as a nonspecific control with identical input DNA samples we observed insignificant PCR enrichment, thus confirming specific recruitment of PhoP to the acid-inducible promoters. In striking contrast, ChIP experiments using anti-SigE antibody showed only stress-specific recruitment of SigE at the acid-inducible promoters (Fig. 4B). For several acid-inducible promoters tested, under identical experimental conditions, we did not observe significant SigE recruitment (Fig. S6). These observations are consistent with sigE-dependent regulation of acid-inducible genes, and together the results suggest that although PhoP binds to the regulatory region of acid-inducible genes, both under normal as well as acidic conditions, SigE is recruited only during acid-stress.
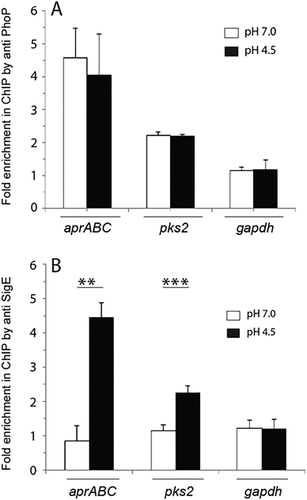
Recruitment of PhoP and SigE at the regulatory region of acid-inducible promoters.
In vivo recruitment of the regulators (A) PhoP and (B) SigE at the target promoters under indicated conditions of growth were examined by ChIP-qPCR using appropriate primer pairs (Table S2). gapdh was used as a negative control and fold enrichment of PCR signal was determined with respect to an IP without adding antibody (as a mock control). ChIP experiments were performed in triplicate and data represent mean values with standard deviations. At least three independent cultures of wild-type and mutant strains were grown under normal condition and acidic pH as described in the Experimental procedures (**P < 0.01; ***P < 0.001).
Recruitment of PhoP and SigE within the acid-inducible promoters of M. tuberculosis
To investigate whether SigE plays any role for PhoP recruitment, we compared in vivo recruitment of PhoP at the acid-inducible promoters in both WT and the ΔsigE mutant when grown under normal (Fig. 5A) or acidic pH (Fig. 5B). We observed comparable PhoP recruitment in both the WT and the ΔsigE mutant. Note that under acidic conditions phoP expression levels remained comparable in the WT and the ΔsigE mutant (Fig. S7A). In striking contrast, recruitment of SigE at the acid-inducible promoters was significantly lowered in the ΔphoP mutant compared to the WT strain under these acidic conditions (Fig. 5C). As a control, the phoP locus did not influence the expression level of sigE under acidic conditions (inset to Figs. 5C and S7B). This observation is consistent with the afore-mentioned PhoP–SigE protein–protein interactions (Fig. 2). Taken together, these results suggest that under acidic stress, recruitment of both PhoP and SigE, likely controlled by specific protein–protein interactions contribute to the activation of acid-inducible gene expression of M. tuberculosis.
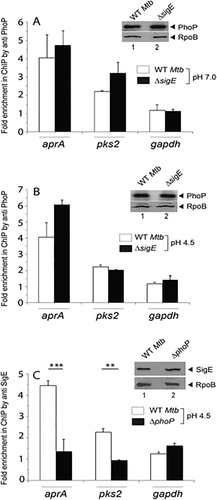
Regulation of in vivo recruitment of PhoP and SigE at the acid-inducible promoters.
PhoP recruitment under (A) normal conditions as well as (B) acidic pH was investigated by ChIP-qPCR in WT, and ΔsigE, as described in the legend to Fig. 4A. Insets show comparable phoP expression in the WT and the ΔsigE mutant under normal and acidic pH conditions, respectively. RpoB was used as a loading control. In contrast, (C) SigE recruitment was carried out in WT, and ΔphoP grown only under acidic pH. Data represent mean values of three independent experiments; asterisk indicates a statistically significant difference in fold enrichment between the WT and the ΔphoP mutant (**P < 0.01; ***P < 0.001). Inset to (C) shows comparable sigE expression in the WT and the ΔphoP mutant under acidic pH as probed by anti-SigE antibody.
Discussion
Very little is known about the underlying global regulatory mechanisms that couple environmental changes with intracellular gene expression in M. tuberculosis. Transcriptional profiling reveals that PhoP, as a major regulator, controls expression of approximately 2% of the M. tuberculosis genome including the ESX-1 secretion apparatus, a major pathogenic determinant (Walters et al., 2006; Gonzalo-Asensio et al., 2008). Thus, mutations in phoP are accompanied by in vivo as well as ex vivo attenuation (Chesne-Seck et al., 2008; Frigui et al., 2008; Lee et al., 2008). Although recent studies suggest a major role for the virulence-associated phoPR system in pH-driven adaptation (Abramovitch et al., 2011; Tan et al., 2013; Baker et al., 2014), the molecular mechanism of how PhoP coordinates the transcriptional program in response to acid stress remains unknown. In this study, we attempted to understand how M. tuberculosis responds to the phagosomal environment and readjusts its gene expression for intracellular survival and growth.
In an attempt to identify genome-wide PhoP binding sites, recent ChIP-sequencing analysis revealed that for a number of PhoP-regulated promoters, the regulator binds within 50–100 bp of the RNA polymerase (RNAP) binding site (Solans et al., 2014). Considering the proximity of their binding sites, protein–protein interaction(s) between PhoP and components of RNAP emerged as a likely possibility. Thus, we focused our attention on M. tuberculosis sigma factors. Along similar lines, previous studies have reported interactions between transcriptional activator RbpA and stress-inducible SigB which controls gene expression during the switch between different physiological states of the tubercle bacilli (Hu et al., 2014). Also, DevR and WhiB7 have been implicated in regulation of dormancy and antibiotic stress, respectively, via interactions with the housekeeping sigma factor SigA (Burian et al., 2013; Gautam et al., 2014). As phoPR is one of the major virulence regulators of M. tuberculosis, it was of interest to examine whether PhoP interacts with the mycobacterial transcription machinery in the context of a stress-specific transcriptional program.
Our hypothesis that PhoP possibly interacts with sigma factors led to the identification of specific PhoP/SigE and PhoP/SigH interactions (Fig.2). Intriguingly, both SigE and SigH are shown to be acid-stress inducible sigma factors of M. tuberculosis (Fig. 2). Previous studies suggested a specific role for SigE during phosphate limitation, oxidative stress, heat-shock and surface-induced SDS stress (Manganelli et al., 2001; Sanyal et al., 2013), and a role for SigH in heat-shock as well as thiol-specific oxidizing agent diamide (Raman et al., 2001; Manganelli et al., 2002). We have supplemented those studies by showing here for the first time a direct involvement of SigE in the acid stress response of M. tuberculosis. Along these lines, ΔsigE M. tuberculosis showed lowered expression of acid-inducible genes under acidic pH relative to WT bacteria (Fig. 3). Consistently, we found stress-specific enrichment of SigE within the acid-inducible promoters (Fig. 4). Furthermore, in agreement with PhoP–SigE protein–protein interaction (Fig. 2), we observed failure of stress-specific SigE recruitment to target promoters in the ΔphoP mutant (Fig. 5). Together, these results have implications on the mechanism of how the tubercle bacilli mount an adaptive program in response to acid-stress. However, we have been unable to offer an insight into the biological significance of PhoP–SigH interactions. Both PhoP and SigH being major regulators impacting on numerous physiological conditions, we think most likely the interaction between the two regulators plays a major regulatory role under a different stress condition.
Although virulence-associated PhoP has been shown to regulate several important loci of the M. tuberculosis genome, results reported in this study offer a novel insight into the regulation of acid-inducible gene expression. We suggest that under normal conditions PhoP regulates expression of acid-inducible genes and therefore is recruited within the acid-inducible promoters under normal pH (Fig. 4). However, SigE is recruited within acid-inducible promoters only under acidic pH (Fig. 4). Having shown that PhoP and SigE interact with each other, clearly the interaction(s) between the two regulators during acid-stress seems to contribute to additional stability of the higher order structure for a more productive transcription initiation. Such a situation might influence SigE to function more effectively and ensure its recruitment to target promoters already bound to PhoP. Thus, our finding that recruitment of both PhoP and SigE during acid stress, likely controlled by protein–protein interactions (Figs. 2 and 5), contributes to upregulation of the acid-inducible genes provides an integrated view of the results. Based on the results we propose a schematic model shown in Fig. 6. Together, these results highlight a novel mechanism involving a complex interplay of PhoP and SigE that contributes to the precise regulation of acid-inducible gene expression and defines a key step in the intracellular location of M. tuberculosis necessary to establish and maintain infection.
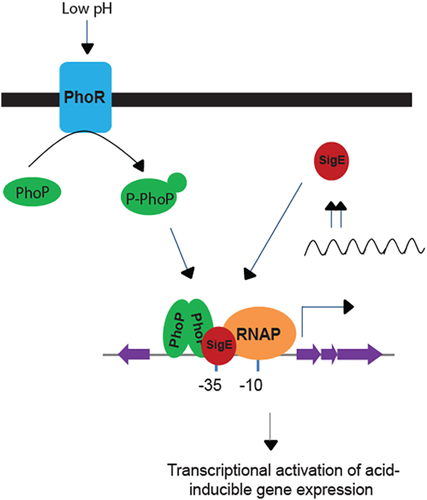
Regulatory scheme of acid-inducible gene expression of M. tuberculosis.
While PhoP regulates acid-inducible gene expression both under normal condition and during acid stress, SigE is recruited within the target promoter only during acid stress. Importantly, in the absence of PhoP, SigE is unable to be recruited within the promoter of acid-inducible genes thereby affecting bacterial survival under acid stress. From these results, we propose that PhoP–SigE interaction accounts for acid stress-specific upregulation of acid-inducible genes of the tubercle bacilli.
The results reported above argue for an additional layer of regulation which may have evolved in order to further tune survival and growth of the pathogen in response to the continuously changing complex physiology of the host. Perhaps, these additional protein–protein interactions, which distinguish the virulence regulators like PhoP from other members of its family, are related to the need for multiple regulatory functions during establishment and maintenance of infection. These regulatory features are subtle and may be extremely difficult to demonstrate in the carefully controlled in vitro conditions of growth. However, given the nature of the complex life-style of the pathogenic mycobacteria and wide range of physiological conditions under which they survive and replicate, it would be interesting to see whether these stress-specific regulatory features of PhoP, via interactions with specific sigma factors, are a general feature of many other response regulators of this family.
Experimental procedures
Bacterial strains and culture conditions
Bacterial strains used in this study are listed in Table S1. E. coli DH5α and E. coli BL21 (DE3) were used for cloning and for the overexpression of recombinant forms of mycobacterial proteins, respectively. E. coli strains were grown in LB medium at 37°C with shaking, transformed cells were selected on media containing appropriate antibiotics. M. tuberculosis H37Rv strains and M. smegmatis mc2155, an electroporation-efficient mutant strain of mc26 (Snapper et al., 1990) were grown at 37°C in Middlebrook 7H9 broth (Difco) containing 0.2% glycerol, 0.05% Tween-80 and 10% ADC (albumin–dextrose–catalase) or on 7H10-agar medium (Difco) containing 0.5% glycerol and 10% OADC (oleic acid–albumin–dextrose–catalase) enrichment and transformed by electroporation as described previously (Jacobs et al., 1991). Construction of ΔphoP, ΔsigE andΔsigH mutants and the corresponding complemented strains of M. tuberculosis have been described elsewhere (Manganelli et al., 2001, 2002; Walters et al., 2006). For acid stress, cells at OD600 of 0.6 were pelleted, washed twice with 7H9 medium buffered with 100 mM MOPS or 2 N HCl for pH 7.0 or pH 4.5, respectively, and finally resuspended in media of indicated pH. The cells were further grown for 2 h at 37°C. Following antibiotics were used as appropriate: ampicillin (Amp), 100 µg ml−1; hygromycin (Hyg), 250 µg ml−1 for E. coli or 50 µg ml−1 for mycobacterial strains; kanamycin (Kan), 50 µg ml−1 for E. coli or 20 µg ml−1 for mycobacterial strains.
RNA preparation
Total RNA from M. tuberculosis cultures grown with or without indicated stress were isolated as described previously (Singh et al., 2014) and purified with some modifications of a previously reported protocol as described elsewhere (Amin-ul Mannan et al., 2009). Briefly, 25 ml of bacterial culture of each strain was grown to mid-log phase (OD600 = 0.6–0.8) and combined with 40 ml GTC solution containing 5 M guanidinium-thiocyanate, 1% β-mercaptoethanol and 0.5% Tween 80. Cells were pelleted by centrifugation and lysed by resuspending in acetate-EDTA buffer (10 mM Na-acetate, 2 mM EDTA) containing acid washed glass beads (425–600 µm; Sigma, USA), 2% SDS and acid-saturated phenol, pH 4.5 (Ambion, USA). Following incubation at 65°C for 30 min, with intermittent vortexing (3 × 20 s) after every 10 min, total RNA was extracted with chloroform-isoamyl alcohol and precipitated with chilled ethanol. Genomic DNA was removed by treating RNA preparations with RNase-free DNaseI (Invitrogen, USA) for 20 min at room temperature. The integrity of RNA samples was verified by intactness of 23S and 16S rRNA using formaldehyde-agarose gel electrophoresis. In all cases, RNA preparations were free from genomic DNA.
Quantitative real-time reverse transcription polymerase chain reaction
For quantitative real-time PCR experiments, cDNA was generated from 50 ng of amplified RNA and real-time PCR reactions were carried out using Superscript III platinum-SYBR green one-step qRT-PCR kit (Invitrogen, USA). Oligonucleotide primers used in RT-PCR and ChIP-qPCR experiments are listed in Table S2. For each pair of primers a standard curve was generated using serially diluted RNA samples to evaluate the PCR efficiency. In all cases, PCR efficiency was within the acceptable range of 95–105% and cycling conditions in the real-time detection system were as follows: 50°C for 45 min and 95°C for 5 min, each for one cycle followed by 40 cycles of 95°C for 15 s and 65°C for 30 s. The endogenously expressed M. tuberculosis gapdh (Rv1436) was used to normalize each sample and the approximate fold difference was calculated using the ΔΔCT method (Schmittgen and Livak, 2008). Experiments to determine average fold changes with standard deviations involved at least three independent RNA preparations.
ChIP assays
For ChIP experiments, DNA–protein complexes in growing cells were cross-linked by 1% formaldehyde for 20 min, and cross linking was quenched by the addition of 0.3 M glycine. Next, 20 ml cultures were collected by centrifugation, washed at least twice with IP buffer (50 mM Tris-HCl, pH 7. 5, 150 mM NaCl, 1 mM EDTA pH 8.0, 1 mM phenyl methyl sulphonyl fluoride [PMSF], 5% glycerol and 1% Triton X-100) to remove excess formaldehyde. Cells were resuspended in 0.5 ml of IP buffer, disrupted by bead-beating using 0.1 mm zirconia glass beads (M P Biomedicals, USA), and cell lysates were diluted with 0.2 ml of IP buffer. Next, cellular DNA was sonicated (5 × 20 s with a cooling interval of 30 s between each pulses) to an average size of ≈500 bp. After removing the cell debris, typically 0.2 ml of clear supernatant was used as total lysate for each IP experiment. In vivo recruitment of PhoP or SigE was examined by ChIP-qPCR to detect promoter regions of interest. PCRs were carried out by using appropriate dilutions of IP DNA in a reaction buffer containing SYBR green mix (Invitrogen, USA), page-purified specific primers (0.4 µM) and one unit of Platinum Taq DNA polymerase (Invitrogen, USA). Enrichment of PCR signal from the anti-PhoP or anti-SigE IP compared to the PCR signal from mock sample (no antibody sample as a negative control) was assessed to determine region-specific recruitment of the regulators. Typically, 40 cycles of amplification were carried out using real time PCR detection system (Invitrogen, USA) with serially diluted DNA samples (mock, IP treated and total input). PCR-enrichment specificity was verified by performing ChIP-qPCR of the relevant IP samples using gapdh specific primers as described previously (Singh et al., 2014). In all cases, ChIP experiments were repeated at least three times.
M-PFC
M-PFC experiments were carried out as described previously (Singh et al., 2014). The oligonucleotide primers and plasmids used to generate relevant constructs used in M-PFC assays are listed in Tables S3 and S4, respectively. To express M. tuberculosis PhoP in M. smegmatis, phoP gene was PCR amplified from pET-phoP (Gupta et al., 2009) using primer pair mphoPF/mphoPR (Table S3) and cloned in the integrative vector pUAB400 (kanR, Table S4). Transformed cells were selected on 7H10/kan plates and grown in liquid medium to obtain competent cells of M. smegmatis harboring pUAB400-phoP. Likewise, sigE, sigH and other sigma factor encoding genes were amplified from M. tuberculosis genomic DNA using indicated primer pairs (Table S3), respectively and were cloned in episomal plasmid pUAB300 (hygR, Table S4) between BamHI/HindIII sites. Each of the constructs was verified by DNA sequencing.
Alamar Blue assay
M. smegmatis cells containing appropriate plasmid pairs were grown in Middlebrook 7H9 media containing Hyg and Kan to an OD600 of 0.5. Next, cells were diluted in fresh 7H9 media and 105 cells were added to a 96-well microtiter plate. TRIM was dissolved in DMSO and added to a final concentration of 12.5 µg ml−1. Plates were incubated at 37°C for 8 h, after which 20 µl of Alamar Blue (BioRad Laboratories, USA) solution was added to each well containing cells to a final concentration of 10%. Finally, the plates were incubated for 24 h at 37°C, and the fluorescence intensity was recorded in a microplate fluoremeter (Biotek, USA) with excitation at 530 nm and fluorescence emission at 590 nm.
Cloning
Isolation of plasmid DNA and genomic DNA, digestion with restriction enzymes, other enzymatic manipulations of nucleic acids, and analyses of DNA/RNA fragments by agarose gel electrophoresis followed standard procedures as described previously (Singh et al., 2014). The oligonucleotide primers and plasmids used in cloning and protein expression are listed in Table S5. M. tuberculosis SigE and SigH were cloned, expressed and purified as recombinant fusion proteins containing N-terminal His6 tag. First, sigE and sigH genes were amplified with the primer pairs FPsigE/RPsigE and FPsigH/RPsigH (Table S5), respectively. Next, each amplicon was digested with NdeI/XhoI and ligated with NdeI- and XhoI-digested pET28c to generate appropriate expression constructs. The sequence of both the (pET-SigE and pET-SigH) constructs was verified.
Purification of proteins
M. tuberculosis SigE and SigH proteins were overexpressed in E. coli BL21 (DE3) by using 50 µM IPTG for 4 h at 25°C and purified by Ni-affinity chromatography. In all cases, the purity of proteins was checked by SDS-polyacrylamide gel electrophoresis, and the protein concentrations were determined by Bradford reagent using BSA as a calibration standard.
Immunoblotting
Cell lysates or purified M. tuberculosis proteins were resolved by 12% SDS-PAGE and visualized by Coommasie blue staining or by Western blot analysis using appropriate antibodies. For immunoblotting, resolved samples were electroblotted onto polyvinyl difluoride (PVDF) membranes (Millipore, USA) and were detected by affinity-purified anti-PhoP, anti-SigE or anti-SigH antibodies elicited in rabbit (Alpha Omega Sciences, India). Goat antirabbit secondary antibody (Abexome Biosciences, India) conjugated to horseradish peroxidase was used, and blots were developed with Luminata Forte Chemiluminescence reagent (Millipore, USA). RNA polymerase was used as a loading control and was detected with monoclonal antibody against β-subunit of RNA polymerase, RpoB (Abcam).
Acknowledgements
We are grateful to Prof. Arthur Landy (Brown University) for critical reading of the article. We thank Drs. G. Marcela Rodriguez and Issar Smith (The Public Health Research Institute, New Jersey Medical School – UMDNJ) for ΔphoP, complemented ΔphoP, ΔsigE and complemented ΔsigE M. tuberculosis strains, Riccardo Manganelli (University of Padova, Italy) for ΔsigH and complemented ΔsigH strains, Adrie Steyn (University of Alabama) and Ashwani Kumar for pUAB300/pUAB400 plasmids, Akesh Sinha and Rajni Goyal for cloning sigma factor overexpressing plasmids, Renu Sharma for technical assistance and for her help with the preparation of the article. This work received financial support from Supra Institutional Project on Infectious Disease (BSC210) from the Council of Scientific and Industrial Research (CSIR) and a research grant (to D.S.) from the Department of Biotechnology (DBT), Government of India. R.B. was supported by UGC; V.A.K and R.R.S were supported by CSIR and P.R.S was supported by DBT for their predoctoral fellowships.
Conflict of Interest
The authors declare no conflict of interest.
Author contributions
R.B., V.A.K., R.R.S. and D.S. designed the research. R.B., V.A.K., R.R.S. and P.R.S. performed the research. R.B., V.A.K. and D.S. analyzed the data. D.S. conceived and coordinated the study, wrote the article, and all authors contributed to writing the final version of the article.


