Effects of disturbance on macrofaunal biodiversity-ecosystem functioning relationships in seagrass habitats
Abstract
Seagrass beds support diverse macrofaunal communities, and collectively they influence carbon and nutrient cycles; however, we know little on how seagrass disturbance alters this relationship. In Newfoundland, Canada, the invasive European green crab Carcinus maenas threatens the seagrass Zostera marina by snipping and uprooting seagrasses while foraging and burrowing. In order to understand the effects of seagrass disturbance on macrofaunal diversity and ecosystem functioning within sediments, we experimentally uprooted small patches of seagrass and compared rates of oxygen and nutrient fluxes from sediment cores from uprooted (disturbed) patches, seagrasses, and unvegetated sediments nearby. In parallel, we assessed macrofaunal biodiversity (taxonomic and functional) and sedimentary (granulometric properties and organic matter content/freshness) variables in all three of these treatments over a three-month period. As expected, macrofaunal abundance, species richness and functional richness declined significantly initially in disturbed cores, although this decrease had little effect on benthic flux rates. Over 3 months, macrofaunal colonization of the disturbed sediments resulted in abundances similar to the natural seagrass and unvegetated treatments. We also observed a change in nutrient flux rates that we attribute to seasonal shifts in regeneration pathways rather than macrofaunal community recovery, suggesting a lesser role for macrofaunal diversity in carbon and nutrient cycling in dynamic nearshore habitats than in deeper water. Our results demonstrate the impacts of green crab-mediated seagrass disturbance on macrofaunal abundance and community structure while highlighting their potential capacity for rapid stabilization, and emphasize the strength of large-scale seasonal environmental changes on ecosystem processes.
1 INTRODUCTION
Anthropogenic impacts have resulted in significant shifts in ecosystem structure and global declines in biodiversity (Butchart et al., 2010). This biodiversity loss has led to numerous studies over the last several decades on the roles of biodiversity in supporting various ecosystem functions (Cardinale et al., 2012; Hooper et al., 2012; Strong et al., 2015) and the implications of biodiversity loss for ecosystem services (Paul et al., 2020; Worm et al., 2006). Through manipulative (Cardinale et al., 2006; Hooper et al., 2012) and observational (van der Plas 2019) studies across a range of ecosystems, these studies generally document positive relationships between biodiversity and ecosystem functioning, although the magnitude of these relationships depends greatly on the ecosystems and processes studied (Covich et al., 2004 ).
Marine scientists working in benthic environments were among the first to address relationships between biodiversity and ecosystem functioning (Duffy, 2003; Solan et al., 2004), noting significant challenges in manipulating species assemblages in sediments without simultaneously altering the very ecosystem processes (e.g. nutrient cycling) that benthic macrofauna potentially influence through their activities within sediments during physical manipulation. Infaunal feeding, movement, tube formation and burrow irrigation all influence organic carbon distribution and sedimentary redox states (Aller, 1994). Bioturbation and bioirrigation promote aerobic microbial decomposition, which drive carbon and nutrient cycles (Aller & Aller, 1998; Glud, 2008; Welsh, 2003); indeed, previous work links macrofaunal communities to carbon mineralization and nutrient regeneration (Snelgrove et al., 1997; Snelgrove et al., 2018; Stief, 2013). The functional characteristics of infaunal organisms also play a crucial role in how they affect ecosystem processes; deposit feeders may redistribute buried organic matter within oxygen-rich sediments or pump oxygen into their burrows, thereby influencing carbon cycling differently than suspension feeders that filter out organic particles drifting in the water column. Consequently, studies investigating the relationships between macrofaunal diversity and functioning often report a great influence of functional characteristics and diversity on ecosystem processes (Danovaro et al., 2008; Emmerson & Raffaelli, 2000; Waldbusser et al., 2004). However, fewer studies consider how macrofaunal diversity interacts with environmental variables in regulating these processes in natural ecosystems (Belley & Snelgrove, 2016; Gammal et al., 2019; Godbold & Solan, 2009).
Seagrass beds grow in shallow coastal waters globally and are among the most ecologically important marine habitats because of their ecosystem engineering capabilities and support of multiple ecosystem functions (Costanza et al., 1997, Orth et al., 2006). Seagrasses grow thick, above-ground canopies from dense below-ground rhizome networks, both of which provide critical habitat for many species (Duffy et al., 2015; Laurel et al., 2003). Rhizomes in particular often harbour diverse benthic macrofaunal communities (Boström & Bonsdorff, 1997; Heck & Orth, 1980; Orth et al., 1984). Seagrasses themselves also play important roles in carbon cycling (Duarte et al., 2005; Mcleod et al., 2011). Some species can act as significant carbon sinks (Duarte et al., 2005; Fourqurean et al., 2012) as a result of their high rates of primary production (Duarte & Chiscano, 1999), resulting in much of their fixed carbon being buried or exported to the deep sea (Duarte & Krause-Jensen, 2017). Seagrass canopies also attenuate water flow (Fonseca et al., 1982; Marin-Diaz et al., 2019), increasing particle sedimentation rates while decreasing resuspension (Kennedy et al., 2010). These attributes help stabilize sediments (Orth, 1977) and, along with direct organic inputs from rhizomes and litter from detached blades, provide microbes with a significant source of organic matter for remineralization (Mateo et al., 2006). Increased organic carbon, as well as oxygen and nutrients exuded from their rhizomes into the sediment (Marbà et al., 2007), also contribute to nutrient regeneration. Seagrasses have a particular influence on sulphur and nitrogen cycling, in that root exudates support sulphur oxidizing and reducing microbes (Martin et al., 2020; Tarquinio et al., 2019), and stimulate high rates of ammonium production through mineralization and nitrogen fixation processes (McGlathery et al., 1998; Risgaard-Petersen et al., 1998; Welsh, 2000).
Despite their importance as highly productive marine ecosystems, the coastal location of seagrass habitats results in myriad threats. Shoreline development, sediment loading and rising ocean temperatures have contributed to worldwide declines in seagrass cover (Short & Burdick, 1996, Orth et al., 2006, Unsworth et al., 2018). On the island of Newfoundland, Canada, the recent arrival of invasive European green crabs (Carcinus maenas, hereinafter referred to as green crab) contributes to the destruction of eelgrass (Zostera marina) beds. Green crab invasion on both the west (Howard et al., 2019) and east (Neckles, 2015) coasts of Canada have resulted in the loss of eelgrass, the most widespread seagrass species in Canada (Murphy et al., 2021). Green crab were first discovered in Newfoundland in 2007 (McKenzie et al., 2007), where established populations on the southern coast of the island suggested colonization several years earlier (Blakeslee et al., 2010). Studies since then have attributed significant eelgrass decline to their arrival (Matheson et al., 2016), given that green crab dig and uproot eelgrass rhizomes as they burrow and forage for infaunal prey (Garbary et al., 2014) and snip eelgrass shoots (Davis et al., 1998); juveniles also graze directly on the shoot tissue (Malyshev & Quijón, 2011). Large populations of foraging crabs can cause widespread habitat destruction, with serious consequences for the diverse fish (Matheson et al., 2016) and macrofaunal (Rossong, 2016) communities these eelgrass habitats support. The continuing spread of green crab across Newfoundland (Ens et al., 2022) increases the need to understand how their disruption of eelgrass habitat affects essential ecosystem functioning processes.
Because seagrasses and macrofauna both play important roles in ecosystem functioning, the destruction of seagrass habitat and alteration of their macrofaunal communities could potentially result in a substantial shift in ecosystem functioning pathways. In this study, we sought to determine how disturbance of a seagrass bed not yet invaded by green crab would impact sedimentary macrofauna and macrofaunal biodiversity-ecosystem functioning relationships. To investigate how seagrass disturbance caused by green crab invasion might impact carbon and nutrient cycling, we replicated green crab disturbance of natural seagrass beds by uprooting small patches and examined multivariate changes in oxygen, nitrate, ammonium, phosphate and silicate fluxes across the sediment–water interface. We also sought to assess changes in the macrofaunal community and diversity following disturbance and relate these changes to variation in benthic fluxes to assess the consequences on macrofaunal biodiversity-ecosystem functioning. We also try to relate benthic flux variation to changes in sedimentary conditions following disturbance to determine the relative influences of biodiversity and physical environment on ecosystem functioning. Finally, we aim to assess how biodiversity and functioning might stabilize in the months following disturbance. We hypothesized that seagrass disturbance would result in a decline in sedimentary macrofaunal biodiversity and a significant shift in sedimentary conditions, which would result in lower rates of carbon and nutrient fluxes.
2 MATERIALS AND METHODS
2.1 Study design and sampling
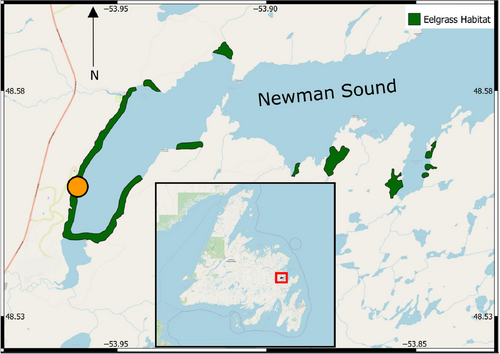
We conducted our study in Newman Sound, a fjord in Bonavista Bay, Newfoundland, Canada (Figure 1), with extensive seagrass cover where green crab have not yet invaded. The selected site was located within the inner sound, where seagrass grows in dense, continuous meadows starting from ~1 m depth. Winter ice scour prevents further seagrass growth towards shore; the substrate between the seagrass bed and shore consisted primarily of medium-coarse grain sand. We collected sediment push cores (diameter = 6.7 cm, length = 35.6 cm) by hand from natural seagrass habitat, adjacent unvegetated habitat, and from pits created within natural seagrass designed to simulate green crab disturbance. For this latter “disturbance” treatment, we uprooted seagrass by hand in small patches 0.5 m in diameter (0.196 m2), replicating the small-scale effects of green crab burrowing and feeding in seagrass. We sampled adjacent unvegetated sediments to determine if macrofaunal communities would shift to resemble those of unvegetated sediments once the seagrass was removed. Cores contained 10–15 cm of sediment and 15–20 cm of overlying water. For each site, we collected four replicate cores of each treatment for incubation experiments, and an additional core from each treatment for analysis of sedimentary environmental variables (36 cores in total for incubations, 9 cores for environmental variables). In order to evaluate macrofaunal community stabilization following disturbance, repeated sampling occurred over a 3-month period in 2020; immediately following disturbance on August 18th - 22nd (time-zero), 6 weeks post-disturbance on September 30th – October 4th, and 12 weeks post-disturbance on November 11th – 15th.
2.2 Incubations
Following collection, we acclimated intact sediment cores taken at each time period for 12–18 h to allow any sediment suspended during transport to settle. For the 6-week and 12-week post-disturbance incubations, aquarium air pumps gently aerated near-bottom water during acclimation to avoid anoxic conditions prior to the incubation. We then incubated cores in ambient conditions for 24 h at in situ temperatures by submerging them in a cold-water bath or placing them in a refrigerator. Incubations in complete darkness avoided any influence of seagrass photosynthesis, utilizing a green light when collecting samples during incubations, noting that green is the least photosynthetically active wavelength. Cores were fully sealed with caps fitted with airtight water sampling ports and magnetic stir bars that helped to homogenize the water contained within the cores.
2.3 Nutrient and oxygen fluxes
In order to determine rates of nutrient flux, we collected two 50 mL water samples from each core at the beginning (T0), midpoint (12 h, T12) and end of each incubation (24 h, T24) and replaced it with the equivalent volume of water taken from the site during core sampling. Water samples were removed through air-tight ports using acid-washed syringes and immediately frozen at −20°C for later analysis of ammonium (NH4+), nitrate (NO3−), phosphate (PO43−) and silicate (Si(OH)4) in a Seal Analytical AAIII Segmented Flow Analyzer. We also analysed nutrients in the replacement water taken from our site to correct for nutrient concentration changes during water replacement; measurements at T12 and T24 were adjusted to account for the nutrients removed from the cores during sampling and added during water replacement. Subsequent linear regressions of the different nutrient concentrations over time (T0, T12, T24) corrected for concentrations within the replacement bottom water (nutrient concentration as a linear function of time), enabled determination of average nutrient flux rates using regression slopes. In four individual T0 cores for which we lacked readings, we used treatment averages of initial nitrate, phosphate and silicate values.
A PreSens Fibox 4 optical oxygen meter, in tandem with oxygen optode patches attached to the inside of each core with clear silicone, provided measurements of dissolved oxygen concentrations. Oxygen concentration measurements every 4 h during the incubation enabled determination of oxygen consumption rates using linear regressions, accounting for the oxygen concentration of replacement bottom water following nutrient sampling. Collectively, we refer to oxygen and nutrient flux rates as benthic flux rates.
2.4 Macrofaunal Identification and Diversity Indices
Following the 24-h incubations, we immediately sectioned the cores into 0–2 cm, 2–5 cm and 5–10 cm layers and fixed the sections in 10% buffered formalin. Within a few weeks, samples were thoroughly rinsed over a 300-μm sieve, a mesh size chosen to collect all adult and juvenile macrofauna from within the sediments. We then transferred them into 70% ethanol for subsequent storage and identification of macrofauna to the lowest taxonomic level possible under a dissecting scope, generally to genus level. We did not retain above ground material. Using the “vegan” package within R (R Core Team, 2021), we then calculated multiple species indices based on the resulting community data; species richness, Simpson's diversity, Shannon diversity and Pielou's evenness index. To examine functional trait diversity, we assigned species to five different biological traits (Table 1) following trait data compiled from the literature (Antczak-Orlewska et al., 2021; Degen & Faulwetter, 2019; Jumars et al., 2015; Macdonald et al., 2010; MarLIN, 2006; Naylor & Haahtela, 1966; Pavia et al., 1999; Queirós et al., 2013). Fuzzy coding between 0 and 1 based on the tendency for an organism to express that particular trait level allowed species to express multiple levels of the same trait, with the total in each trait adding to 1. We then calculated functional diversity indices using the “FD” package within R (R Core Team, 2021). These indices included functional richness, functional evenness, functional divergence, functional dispersion and Rao's quadratic entropy (Laliberté & Legendre, 2010; Villéger et al., 2008). We also calculated and used the community-weighted mean values for each trait level in the analyses (Lavorel et al., 2008).
| Biological traits | Level |
|---|---|
| Feeding Mode | Carnivore |
| Detritus feeder | |
| Suspension feeder | |
| Funnel feeder | |
| Grazer | |
| Omnivore | |
| Parasite | |
| Scavenger | |
| Surface deposit feeder | |
| Sub-surface deposit feeder | |
| Reworking Mode | None/epifauna |
| Surficial modifier | |
| Up/down conveyor | |
| Biodiffusor | |
| Movement | None/fixed |
| Limited movement | |
| Slow movement through sediment | |
| Free movement in burrows | |
| Habitat | Infauna |
| Epifauna | |
| Pelagic | |
| Adult Size | Small (<1 cm) |
| Medium (1–5 cm) | |
| Large (>5 cm) |
2.5 Environmental variables
Analysis of sediment from the extra core taken for each treatment allowed us to evaluate the effects of seagrass removal on the sedimentary environment and potential subsequent effects on the sedimentary community. For this purpose, we initially homogenized the 0–2 cm layer of the cores prior to storage in the dark at −20°C until analysis, where we took sub-samples from this layer for separate analysis of grain size, carbon/nitrogen content, and phytopigment ratios.
We used overall mean grain size (phi) and mean of the sortable silt fraction (phi) using the Krumbein phi scale (phi = −log2(grain size in mm)), alongside percentages of gravel, sand and mud fractions (%) to assess impacts of disturbance on physical sedimentary dynamics. Sediment grain size samples were treated with 35% hydrogen peroxide to digest any organic material and then freeze-dried for analysis. We then removed the gravel fraction (>2 mm) via sieve and weighed at ¼ phi intervals to determine the percent gravel. Analysis of the remaining sediment (<2 mm) used a Beckman Coulter LS13-320 laser diffraction analyzer to determine the percent sand (2 mm – 62.5 μm) and mud (<62.5 μm) fractions. We then determined the overall mean grain size based on all fractions and calculated the mean sortable silt (>10 μm – <62.5 μm), with higher phi values representing a higher proportion of fine silt.
Total organic carbon (TOC, mg g−1), total nitrogen (TN, mg g−1), chlorophyll a concentration (μg g−1), phaeopigment concentration (μg g−1) and the chlorophyll a: phaeopigment ratio enabled assessment of the impacts on organic matter freshness and accumulation over different time scales. To determine the carbon and nitrogen content of the sediment, we weighed sub-samples, dried them at 60°C for 24 h and then treated them with HCl fumes for 24 h to acidify and remove any inorganic carbon. Re-drying at 60°C for another 24 h preceded transferring of 2 mg to a tin capsule and reanalysis using a Perkin-Elmer 2400 Series II CHN analyzer for total organic carbon (TOC) and total nitrogen (TN). We could not calculate carbon: nitrogen ratios because some total nitrogen values fell below our equipment's detection limits.
We assessed the quality of organic matter over the short-term, based on phytopigment concentrations determined using a spectrophotometric assay (Danovaro, 2009). Following addition of 90% acetone to weighed sediment sub-samples, we vortexed the samples for 30 s, sonicated them three times in an ultrasound bath in 1-minute intervals, and stored them in the dark for 24 h at 4°C for pigment extraction. After centrifuging samples (800 × g, 10 min), we measured absorbance to assess chlorophyll a concentration and then acidified samples using 0.1 N HCl prior to reanalysis to determine phaeopigment concentrations.
2.6 Statistical analyses
In order to determine whether total macrofaunal abundance and biodiversity indices differed among treatments and over time, we ran separate two-way ANOVAs with both “Treatment” and “Time” as fixed factors because we explicitly wanted to assess how the community would change among these treatments and over these specific time intervals, noting independent cores that we collected and analysed from each treatment replicate and during each time period. We assessed significant differences among treatments and over time using Tukey's tests. Q-Q plots and plots of residuals assessed assumptions of normality and homogeneous variance. Given some indication of non-normality in the residuals, we applied Kruskal–Wallis tests to functional richness comparisons over time, and separate Kruskal-Wallis tests for each time period separately using “Treatment” as a factor. We used Dunn's tests to assess differences among treatments and over time following Kruskal–Wallis tests. Application of a natural logarithmic transformation to total macrofaunal abundances and species and functional richness reduced the elevated variance at higher values. We omitted an extreme outlier of macrofaunal abundance in a single time-zero green crab disturbance core that suggested an unusually dense patch of individuals more than an order of magnitude greater than any other sample, and we used a type III ANOVA in this case.
Two separate two-way permutational multivariate analyses of variance (PERMANOVA, 9999 permutations) enabled comparison of variation in macrofaunal community composition and biodiversity indices across treatments and time, using the “adonis2” function in R. We also compared macrofaunal community composition among treatments within each time period with single factor PERMANOVAs due to limitations with post hoc testing in R. For community comparisons we used Bray–Curtis distances of species abundances, in contrast to Euclidean distances for standardized biodiversity indices. Following PERMANOVA, we verified homogeneity of dispersions using the “betadisper” function in “vegan”. Non-metric multidimensional scaling (NMDS) plots visualized biodiversity patterns across treatments. Similarity percentage (SIMPER) analysis on fourth-root transformed data determined the species driving community differences among treatments within each time period.
We used similar analyses to determine whether oxygen and nutrient flux rates differed among treatments and over time using separate two-way ANOVAs with “Treatment” and “Time” as fixed factors. We assessed significant differences among treatments and over time using Tukey's tests and used Q-Q plots and plots of residuals to assess assumptions of normality and homogeneous variance. We applied Kruskal–Wallis tests to oxygen and ammonium flux comparisons over time due to non-normality in the residuals, while using single factor ANOVAs to assess treatment differences given that data were normally distributed within each time period. We used Dunn's tests to assess differences among treatments and over time following the Kruskal–Wallis tests and Tukey's tests following the one-way ANOVAs. We also used a two-way PERMANOVA (9999 permutations) to assess variation in multivariate nutrient flux rates across treatments and over time, using the “adonis2” function in R. We used Euclidean distances between the standardized nutrient flux rates for the analysis. Following PERMANOVA, we verified homogeneity of dispersions using the “betadisper” function in “vegan” and used NMDS plots to visualize multivariate patterns in nutrient flux rates.
Two separate redundancy analyses determined the proportion of variation in rates of benthic flux explained by biodiversity metrics and environmental variables, respectively, and the explanatory variables contributing most to that variation. To avoid multicollinearity in the explanatory variables, variance inflation factor (VIF) tests removed variables with VIFs >3 stepwise. Furthermore, correlated variables were identified using Pearson's correlation coefficients, and highly correlated variables (r > .6) were removed. We then assessed the contributions of the remaining explanatory variables to flux variation using single variable RDAs. Furthermore, a stepwise selection process with a significance level of p < .05 determined those variables that contributed most to the explained variation. We analysed these datasets separately as they contribute to influencing benthic flux through different mechanisms. Separate analyses also permit a variation partitioning analysis, using both sets of explanatory variables to determine the relative amount of variation in benthic fluxes explained by biodiversity indices and sedimentary variables alone, and the overlap in explained variation by both sets of variables (Legendre & Legendre, 2012). We also attempted to analyse the biodiversity indices and the community weighted mean variables with separate RDAs; however, each model was left with just one explanatory variable following selection processes and we deemed combining the variables more useful for interpretation. We completed redundancy analyses and variation partitioning analyses in R using functions in the “vegan” package (R Core Team, 2021).
3 RESULTS
3.1 Macrofaunal abundance and biodiversity comparisons
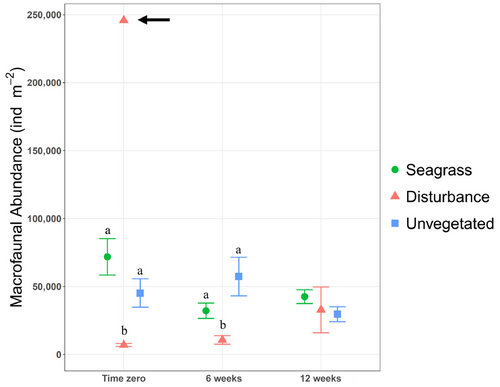
Macrofaunal abundance differed significantly among treatments (two-way ANOVA: F2,26 = 22.0, p < .001) but not over time, and we observed significant interaction between the two (two-way ANOVA: F4,26 = 4.5, p < .01). Tukey tests to discern treatment differences indicated significantly higher macrofaunal abundance in seagrass and unvegetated treatments than in disturbance treatments at time zero (Tukey's test: p < .001) and higher abundance in unvegetated than disturbance treatments after 6 weeks (Tukey's test: p < .01, Figure 2). No treatments differed at 12 weeks.
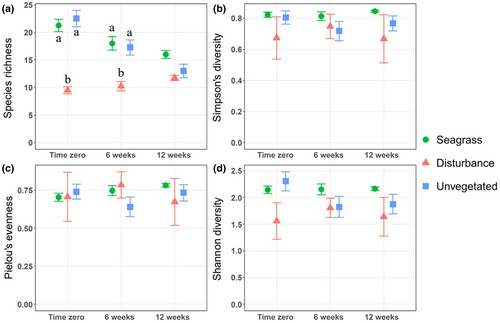
We observed a similar pattern in comparing species richness among treatments and over time, with significant treatment (two-way ANOVA: F2,27 = 57.4, p < .001) and time differences (two-way ANOVA: F2,27 = 6.7, p < .01); We also observed a significant interaction term (Two-way ANOVA: F4,27 = 7.9, p < .001, Figure 3a). Tukey's tests showed significantly greater species richness in seagrass and unvegetated cores than disturbance cores at time zero (Tukey's test: p < .001) and six weeks post-disturbance (Tukey's test: p < .001). By 12 weeks, Tukey's tests did not discern differences in species richness among treatments. Significantly higher functional richness in seagrass treatments than in disturbance treatments at time zero (Kruskal–Wallis: χ22 = 8, p < .05, Dunn's test: p < .01), contrasted no significant differences at 6 weeks, but significantly higher functional richness in seagrass treatments than in both disturbance treatments after 12 weeks (Kruskal–Wallis: χ22 = 7.4, p < .05, Dunn's test, p < .05, Figure 4a). For other comparisons of diversity, we observed significantly lower functional divergence in seagrass treatments than in unvegetated treatments, although Tukey's tests did not discern differences within any time period (two-way ANOVA: F2,27 = 3.5, p < .05).
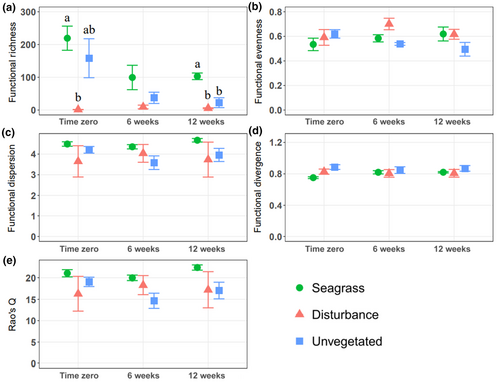
Standardized biodiversity indices differed significantly among treatments (PERMANOVA: F2,27 = 3.5, p < .001) when analysed together using PERMANOVA, noting non-homogenous multivariate dispersions across treatments (permutation test: F2,33 = 4.5, p < .05). A NMDS plot of the data separated unvegetated treatments from seagrass and disturbance treatments (Figure 5a).
3.2 Multivariate community comparisons
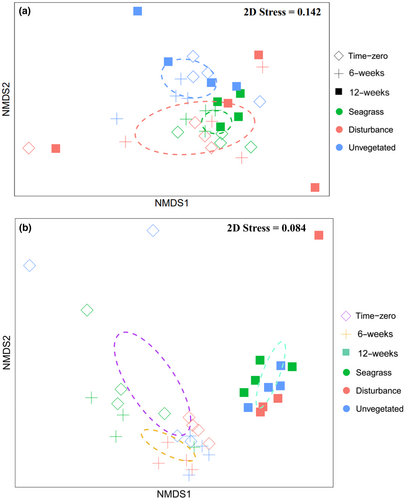
PERMANOVA of Bray–Curtis dissimilarities showed that macrofaunal community composition differed significantly among treatments (PERMANOVA: F2,27 = 6.2, p < .001) and times (PERMANOVA: F2,27 = 1.6, p < .05, Figure 6), noting non-homogenous multivariate dispersion among treatments (permutation test: F2,33 = 8.9, p < .001). Given evidence that non-homogenous variance under balanced designs has little affect on PERMANOVA (Anderson & Walsh, 2013), we accept this interpretation of the results. Separate analysis within each time period showed significant differences among communities for each time period (PERMANOVA: time-zero: F2,11 = 4.6, p < .001, 6 weeks: F2,11 = 2.9, p < .001, 1 weeks: F2,11 = 1.6, p < .05). Once again, we observed significantly non-homogeneous multivariate dispersion after six (permutation test: F2,9 = 4.4, p < .05) and 12 weeks (permutation test: F2,9 = 4.8, p < .05). SIMPER analysis on fourth-root transformed Bray–Curtis dissimilarities identified Pholoe minuta and Mediomastus sp. as contributing strongly to seagrass communities, along with the tube-dwelling amphipod Monocorophium sp. and the small gastropod Skeneopsis planorbis. Lottiids, the carnivorous nereid Alitta succinea, and the bivalves Mya arenaria and Macoma balthica, contributed strongly to unvegetated communities, along with P. elegans and Naididae Indet. 2. Microphthalmus sp. contributed strongly to disturbance treatments. Examining overall dissimilarity among treatments over time revealed increasing similarity of the disturbance treatment to the other treatments, but especially to the seagrass treatment (Appendix 1: Tables A1 and A2).
3.3 Benthic flux rate comparisons
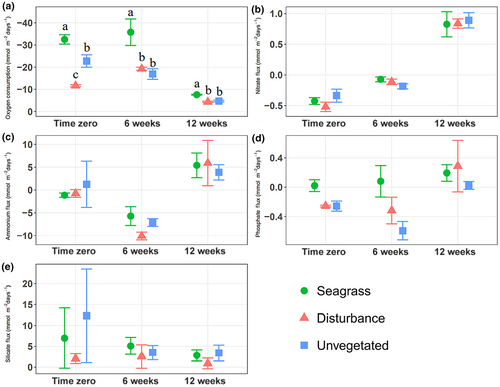
Rates of oxygen flux differed significantly over time (Kruskal–Wallis: χ22 = 23.4, p < .001); with Dunn's tests identifying significantly lower rates of oxygen consumption at 12 weeks than other time periods (Dunn's test: p < .001). Analyses within each time period indicated significant differences among treatments for each time period (ANOVA: time zero: F2,9 = 21.3, p < .001, 6 weeks: F2,9 = 8.9, p < .01, 12 weeks: F2,9, = 12.5, p < .01), with significantly higher oxygen consumption in seagrass treatments than in unvegetated and disturbed cores for all three time periods (Tukey's test: p < .05), and significantly higher oxygen consumption in unvegetated treatments than disturbance treatments at time zero (Tukey's test: p < .05), noting that non-seagrass treatments became increasingly similar over time (Figure 7a). When comparing nutrient fluxes, nitrate, ammonium and phosphate differed significantly over time (two-way ANOVA: Nitrate: F2,23 = 126.9, p < .001, Phosphate: F2,23 = 4.5, p < .05, Kruskal–Wallis: Ammonium: χ22 = 26.1, p < .001), but none differed among treatments.
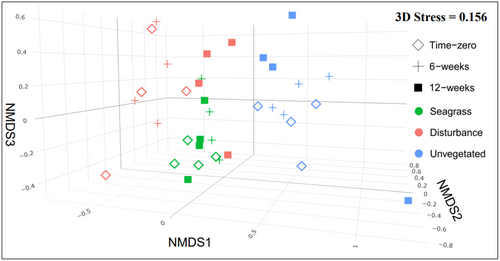
Multivariate benthic flux rates assessed via PERMANOVA differed significantly among treatments (PERMANOVA: F2,27 = 2.9, p < .01) and times (PERMANOVA: F2,27 = 15.0, p < .001), noting homogenous multivariate dispersion across both treatment and time. A NMDS plot of core benthic flux rates showed a distinct separation in benthic fluxes at 12 weeks relative to time zero and 6 weeks (Figure 5b).
3.4 Variation in multivariate benthic flux explained by biodiversity
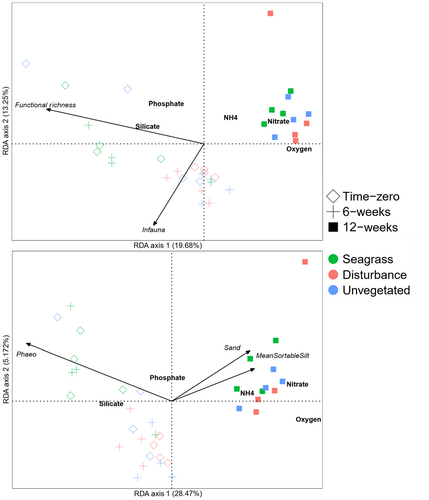
After removing collinear variables or those with VIF values >3, the biodiversity RDA model explained 48.8% of the variation in benthic flux rates (adjusted R2 = .253) and included functional richness, functional evenness, functional divergence and community weighted means of carnivores, detritus feeders, funnel feeders, omnivores, biodiffusors, infauna, pelagic and medium-sized organisms (1–5 cm). Functional richness (18.6%) and community weighted means for infauna (13.8%) and carnivores (7.5%) explained the most variation. However, following stepwise selection, the most parsimonious set of variables chosen included just functional richness and community weighted means for infauna, and explained 32.9% of the variation in benthic flux rates (adjusted R2 = .289). The first RDA axis explained 19.7% of the variation in flux rates and related to both variables, whereas the second axis explained 13.25% of the variation and related mainly to community-weighted means of infauna (Figure 8a).
3.5 Variation in multivariate benthic flux explained by environmental factors
The initial RDA model with collinear and VIF >3 variables removed explained 36.2% of the variation (adjusted R2 = .280) and included percent sand, mean sortable silt fraction, chlorophyll a concentration and phaeopigment concentration. Phaeopigment concentration (17.2%) explained the most variation, whereas the explained variation from other variables fell between 5%–7%. Following stepwise selection of variables, the final model explained 34.2% of the variation in benthic flux rates (adjusted R2 = .280) and included percent sand (6.4%), mean sortable silt (5.9%) and phaeopigment concentrations (17.2%). The first RDA axis accounted for most of the explained variation (28.5%) and linked to all variables, whereas the second RDA axis explained just 5.2% of the variation (Figure 8b).
3.6 Variation partitioning analysis
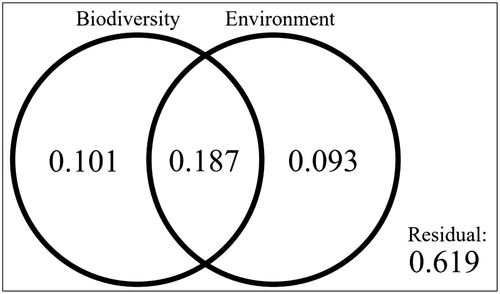
Variation partition analysis of benthic flux rates across biodiversity indices and environmental variables revealed that both sets of explanatory variables collectively explained 47.0% of the variation (adjusted R2 = .382, Figure 9). Biodiversity indices alone explained 10% of that variation whereas environmental variables accounted for 9% of the explained variation, with 19% explained by both sets of variables. Our analyses left 62% of the variation in benthic flux rates unexplained.
4 DISCUSSION
By experimentally manipulating seagrass habitat, we determined that small-scale nearshore disturbances significantly altered macrofaunal abundance and community structure, although nutrient flux rates remained mostly unaffected, varying more over time. This finding suggests that macrofaunal activity may play a lesser role in nutrient regeneration and carbon mineralization in dynamic nearshore habitats with coarse sandy sediments than in offshore environments characterized by finer sediments (Braeckman et al., 2014). We acknowledge, however, that we cannot conclusively draw inferences without manipulating or measuring biodiversity. We also acknowledge that macrofaunal abundance does not equate to macrofaunal biomass, which would likely influence benthic fluxes during the incubations. By the end of the experimental period (12 weeks), we observed some recovery of the communities and abundances of disturbed patches, suggesting the potential for relatively rapid stabilization by macrofauna to the seagrass disturbance (Silberberger et al., 2016). We also found similar amounts of variation explained independently by biodiversity metrics and environmental variables (Belley & Snelgrove, 2016), emphasizing the importance of both the macrofaunal community and environmental factors for ecosystem functioning.
4.1 Macrofaunal community in seagrass and unvegetated sediments
Initially, natural seagrass and unvegetated sediments had similar macrofaunal abundances and species richness, despite differences in macrofaunal community composition. These differences were driven primarily by differences in relative abundance, although some species were unique among treatments. Fresh organic matter input potentially contributed to high abundances of deposit feeding polychaetes in seagrass treatments, as indicated by high chlorophyll a: phaeopigment ratios (Boon & Duineveld, 1996; Morata et al., 2011). Potentially, the seagrass canopy trapped Mytilus edulis larvae drifting past and provided a primary settlement surface (Bayne, 1964; Newell et al., 1991) that resulted in high juvenile numbers. Abundant suspension feeders in adjacent unvegetated sediments may reflect greater flow rates and suspended particle turnover associated with skimming flow around and over the seagrass bed (Koch et al., 2006), as well as direct organic matter contributions from the seagrass bed (Duarte & Krause-Jensen, 2017).
Numerous studies report higher diversity and macrofaunal abundances in seagrass beds compared to adjacent unvegetated habitats (Boström & Bonsdorff, 1997; Heck & Orth, 1980; Orth, 1977). Seagrasses provide protection from predators (Orth et al., 1984; Reynolds et al., 2018), create complex three-dimensional habitats (Heck & Wetstone, 1977; Lannin & Hovel, 2011) and increase settlement of drifting organic matter and pelagic larvae (Eckman, 1983, 1987; Fonseca et al., 1982). Similar numbers of species and abundances in both seagrass and unvegetated habitats in our study may result from our collecting unvegetated cores just 1–2 m away from the seagrass patch edge. However, some studies report a sharp transition in diversity and abundance over smaller spatial scales (Barnes & Hamylton, 2013; Tanner, 2005), and a parallel experiment elsewhere in Newman's Sound (T. J. Colvin & P. V. R. Snelgrove, unpublished data) documented clear between-habitats differences in macrofaunal abundance at similar scales.
4.2 Macrofaunal community changes following disturbance
As expected, we observed significantly lower macrofaunal abundances, species and functional richness, and altered macrofaunal communities in disturbance treatments resulting from seagrass and sediment removal, which persisted to 6 weeks post-disturbance. Other seagrass removal studies reported macrofaunal decline and community shifts over similarly short timescales (Connolly, 1995; Eklöf et al., 2015; Githaiga et al., 2019). An abundance of small, deposit feeding polychaetes characterized the disturbed treatment community. Similar chlorophyll a: phaeopigment ratios in disturbed and unvegetated habitats and much reduced TOC levels in disturbed pits over the entire duration of the experimental period suggest that we cannot attribute this community shift to deposit feeders actively responding to organic matter accumulation in pits, though we cannot exclude the possibility of passive accumulation of colonizers (sensu Snelgrove, 1994). Alternatively, disturbance may have altered the microbial community within the seagrass bed; although our study did not measure microbial abundance, microbes provide an essential food source for deposit feeding invertebrates (Livingston, 1979).
At 12 weeks post-disturbance, macrofaunal abundances increased in disturbance treatments but simultaneously decreased in natural seagrass and unvegetated habitats, resulting in similar abundances in all treatments. The decline in seagrass and unvegetated treatments likely reflected seasonal variation in macrofaunal abundances, which reach a peak in summer following their recruitment, and decline in the fall in northern latitudes (Butman, 1987; Reiss & Kröncke, 2005). Other studies on long-term recovery of macrofauna in disturbed seagrass beds yielded conflicting results, with some reporting reduced abundances upwards of 13 months (Githaiga et al., 2019), whereas others reported faunal recovery within 2 (Reed & Hovel, 2006) and 10 months (Silberberger et al., 2016). Seagrass removal by Githaiga et al. (2019) resulted in a shift in the functional composition of communities to large-bodied bioturbators, which likely helped maintain the disturbance community. We did not observe such a response; rather, after 12 weeks the disturbance community resembled the natural seagrass community more closely than the unvegetated community.
Infaunal colonization occurs primarily through pelagic larval recruitment and post-larval dispersion (Levin, 1984; Smith & Brumsickle, 1989). Pelagic larval stages in many infaunal species can spend considerable time in the water column and disperse great distances (Levin, 1984). Pelagic larval recruitment varies seasonally with infaunal reproductive events, which depend on the life history characteristics of the species present (Levin, 1984); many, but not all, species reproduce over the summer months (Whitlatch, 1977). Post-larval dispersion by juveniles and adults plays a particularly important role in small-scale disturbances, lessening as patch size increases because of their limited mobility (Smith & Brumsickle, 1989). Given that our study took place from late August – mid-November, we likely missed much of the peak summer recruitment from pelagic larvae, noting that adult stages dominated our samples. Given the shift in the disturbance community to resemble the seagrass community, post-larval horizontal dispersion from the adjacent seagrass bed likely provided the primary source of immigrating infauna. This scenario would also explain the low abundances six weeks post-disturbance; if settling larvae provided the main source of colonizers then we would have likely observed higher abundances earlier in the experiment.
Along with the dramatic shifts in the macrofaunal community and abundances, parallel changes in species and functional richness followed disturbance. This result aligns with the positive correlation between species richness and total numbers of individuals sampled (Bock et al., 2007; Gotelli & Colwell, 2001; Storch et al., 2018), noting that the capacity of a habitat to support more individuals enables more species to co-exist at stable population levels (Gaston, 2000). Species accumulation curves for each treatment within each time period supported these results, showing similar patterns as mean species richness. Functional richness, the multivariate functional space taken up by each community (Villéger et al., 2008), was highest in seagrass cores, followed by unvegetated cores and disturbance cores. Again, we anticipated this result given the strong positive correlation between functional richness and species richness (Villéger et al., 2008), and we typically observed the most species in seagrass cores and the fewest in disturbance cores. However, seagrass habitats supported greater functional richness than unvegetated habitats, despite harbouring similar numbers of species throughout the experiment. This pattern suggests that the beneficial habitat-forming attributes of seagrass go beyond supporting high abundances and numbers of species, given that they also supported disproportionately greater richness of biological functions. We also observed significantly lower functional divergence in seagrass habitats than unvegetated and disturbance sediments, potentially an artifact of a higher proportion of zero values for other trait levels in those species with just one trait level, resulting in lower functional divergence in these communities.
4.3 Benthic flux rates following disturbance
Oxygen consumption rates provide a proxy for carbon mineralization (Glud, 2008; Snelgrove et al., 2018; Song et al., 2016); however, this proxy overlooks contributions from anaerobic decomposition (Canfield et al., 1993; Mateo et al., 2006), an important contributor to seagrass organic matter mineralization (Jensen et al., 2007). Given similar macrofaunal abundances in seagrass and unvegetated sediments and previous studies that documented high rates of Zostera marina respiration (Duarte et al., 2010), we attribute the higher rates of mineralization in seagrass cores to respiration by seagrass components during incubation, noting that we incubated our cores in darkness to avoid the confounding effect of adding oxygen via photosynthesis. Highly productive seagrasses represent net carbon sinks (Duarte et al., 2010); consequently, many studies document the carbon sequestration potential of seagrass beds and highlight their important contributions to long-term blue carbon storage (Duarte et al., 2010; Fourqurean et al., 2012; Röhr et al., 2018). We also observed seasonal changes in mineralization, with declining oxygen consumption in all treatments by mid-November. We attribute this decline to decreasing water temperature over the experimental period (time-zero = 17°C, 6 weeks = 12°C, 12 weeks = 6°C), noting many studies that demonstrate strong variation in seagrass respiration rates with temperature (Biebl & McRoy, 1971; Marsh et al., 1986; Ouisse et al., 2010).
Surprisingly, we observed no significant differences in nitrogen flux among treatments, noting previous studies that document strong influences of seagrass beds on nitrogen dynamics (Caffrey & Kemp, 1990; McGlathery et al., 1998; Ottosen et al., 1999). However, nitrogen assimilation during photosynthesis often outweighs other contributions to nitrogen flux in these habitats (Hansen et al., 2000; Risgaard-Petersen et al., 1998; Risgaard-Petersen & Ottosen, 2000). Completing our incubations in darkness minimized seagrass nitrogen uptake for photosynthesis, potentially explaining the similarities in both nitrate and ammonium across our treatments. The absence of any clear link between nutrient cycling and macrofaunal abundance and species richness over the duration of the experiment suggests a lesser role for macrofaunal bioturbation in nutrient dynamics in this system than in other marine systems. Braeckman et al. (2014) demonstrated the variable influence of macrofaunal diversity on nutrient cycling, with a lesser role for macrofaunal bioturbation in coarse sandy sediments and overall lower rates of benthic flux than in finer sandy sediments. Mean grain sizes (MGS) in our cores ranged from fine-sand sediment in seagrass to medium-sand in unvegetated sediments, with intermediate values in disturbance cores. Coarse sediments and the collection of cores from a high-energy shallow subtidal zone (<1.5 m depth) could explain the negligible impact of macrofaunal diversity on benthic fluxes; greater reworking by constant wave action may overshadow macrofaunal bioturbation effects on nutrient dynamics in these permeable sediments (Koch et al., 2006).
Despite minimal effects of seagrass disturbance on benthic nutrient flux rates, seasonal changes nonetheless occurred in nitrate, ammonium and phosphate fluxes. Nitrate flux changed from mean influx into sediments at time-zero in August to mean efflux at 12 weeks post-disturbance. This pattern parallels observations by Risgaard-Petersen and Ottosen (2000) that seagrass sediments act as a sink for dissolved inorganic nitrogen in the spring and summer before becoming a net source in the fall. They attributed this change to reduced nitrate uptake with a decline in biological activity with decreasing temperatures, until nitrate release from decomposition eventually outweighed consumption (Risgaard-Petersen & Ottosen, 2000); a similar process likely occurred here. Ammonium flux changed to mean influx into the sediments at 6 weeks post-disturbance, then shifted to mean efflux at 12 weeks post-disturbance. Similarly, disturbance and unvegetated phosphate flux rates shifted from net influx at time zero and 6 weeks post-disturbance to efflux rates similar to vegetated sediments. Previous studies that reported seasonal variation in marine ammonium and phosphate fluxes in both vegetated and unvegetated habitats (Clavero et al., 2000; Holmer et al., 2006; Jensen et al., 1995; Seitzinger, 1987) related changes to higher organic matter inputs and mineralization rates during summer, a trend we did not observe.
4.4 Biodiversity indices and benthic flux variation
Redundancy analysis of taxonomic and functional biodiversity indices revealed that, of the variables we measured, functional richness explained the most variation in benthic flux rates, despite no significant change in benthic flux following the large decline in functional richness after disturbance. We attribute this link to seasonal change in functional richness rather than the decline following disturbance, noting that seasonal changes were responsible for much of the variation in benthic flux rates. Previous studies often report a greater influence of macrofaunal functional characteristics of species on rates of benthic flux than taxonomic diversity metrics (Ieno et al., 2006). Although our final biodiversity RDA model did not include metrics of taxonomic diversity, functional richness and species richness nonetheless explained similar proportions of benthic flux variation; however, overlap in this variation due to collinearity and inflated variance resulted in removal during model selection.
4.5 Environmental factors and benthic flux variation
Of the environmental variables examined, phaeopigment concentrations explained the most variation in benthic flux, along with percent sand and sortable silt. Other studies also report phaeopigment concentrations as key drivers of benthic flux (Link et al., 2013); however, given the importance of seasonal change in benthic fluxes, seasonal shifts in these variables clearly played a role. The higher phaeopigment concentrations in seagrass cores than in unvegetated and disturbance cores throughout the experiment did not influence flux rates among treatments, suggesting that phaeopigments did not drive flux rates and instead coincided with seasonal changes in benthic flux rates (Bianchi et al., 2002), as did percent sand and mean sortable silt.
4.6 Variation partitioning
When analysed together using variation partitioning analysis, biodiversity metrics and environmental factors contributed equally to explain 38.2% of the variation in benthic flux rates, indicating similar impacts on ecosystem functioning, with the high overlap representing much of the seasonal variation explained by both. Other studies comparing biodiversity and environmental influences on ecosystem functioning sometimes reported similar contributions of each (Belley & Snelgrove, 2016), whereas others reported a greater influence of either biological (Godbold & Solan, 2009; Miatta & Snelgrove, 2021) or environmental (Grace et al., 2007; Healy et al., 2008) variables. The degree to which biodiversity or the environment influences functioning thus depends greatly on the ecosystem studied, as well as the environmental variables, traits and species considered. Our analyses left 61.8% of the variation in benthic flux unexplained, pointing to potentially important roles for unmeasured variables such as microbial abundance and diversity (Abell et al., 2013; Belley & Snelgrove, 2016), noting the critical role of microbial action in organic matter breakdown and nutrient regeneration. Similarly, the comparatively few studies to date on meiofaunal contributions to ecosystem functioning indicate significant roles (Danovaro et al., 2008; Piot et al., 2014; Schratzberger & Ingels, 2018), particularly through their influence on the microbial community.
4.7 Green crab
Our study sought to determine the potential impacts of green crab invasion on the macrofaunal community and ecosystem functioning of undisturbed seagrass habitat by replicating green crab disturbance effects rather than the direct impacts of crabs themselves. Green crab both snip and tear seagrass shoots and uproot rhizomes while foraging (Davis et al., 1998; Garbary et al., 2014; Malyshev & Quijón, 2011), often creating barren pits and causing significant declines in seagrass habitat (Garbary et al., 2014; Matheson et al., 2016; Neckles, 2015). We emulated the physical uprooting effects of green crab invasion in the absence of green crab predation on macrofauna, which can target specific macrofaunal groups, such as suspension feeding polychaetes in Newfoundland seagrass beds (Rossong, 2016) and juvenile soft-shell clams (Mya arenaria) in Maine (Tan & Beal, 2015). Given that foraging causes the primary seagrass disturbance, additional disturbance through predation would presumably have further reduced abundances in the disturbed habitat and hampered recovery, but predation impacts were not the focus of our study. However, predation by the native rock crab (Cancer irroratus) also strongly affects infaunal richness and community structure in field and laboratory experiments (Quijón & Snelgrove, 2005). Seagrass removal in our disturbance treatment potentially allowed increased rock crab foraging much as green crab might have, if present. We did not attempt to separate the effects of seagrass removal and sedimentary disturbance in our experimental design because of their co-occurrence in nature, and with green crab invasion in particular.
5 CONCLUSIONS
Seagrass disturbance similar to that associated with green crab invasion significantly impacted macrofaunal abundance, species and functional richness, and macrofaunal community composition; however, these changes did not translate into clear effects on nutrient cycling. Despite similar benthic fluxes in disturbance and non-disturbance treatments, significant declines in macrofaunal abundance and richness likely have major consequences for other aspects of ecosystem functioning, including secondary production and food-web support for higher trophic levels (Clare et al., 2022). Disturbed communities also recovered in total abundance, but not species richness, within 12 weeks of disturbance. This pattern suggests that removal of seagrass disturbance could lead to macrofaunal community stabilization and potential recovery, noting the significant challenge of eradicating green crab once established (Gehrels, 2016). Measures to prevent green crab invasion and control their populations, once established, would therefore help to protect seagrass habitats and the diverse ecosystems and functions they support.
ACKNOWLEDGMENTS
Funding for this project was provided by a National Sciences and Engineering Research Council of Canada (NSERC) Discovery Grant to P.V.R.S., an NSERC Postgraduate Scholarship to T.J.C., and by the School of Graduate Studies at Memorial University. We thank Dr. Robert Gregory (DFO) and his group for their assistance with field logistics, and his constructive inputs on an earlier version of the manuscript along with Dr. Suzanne Dufour (MUN), Dr. Mary O'Connor (UBC) and Dr. Cynthia McKenzie (DFO). We thank Mary Clinton and Alessia Ciraolo (MUN) for their assistance in the field, and Vanessa Byrne, Laura Lilly, Brooklin Caines, and Devon Bath for their assistance in the lab. We also thank Jeanette Wells (MUN), Owen Brown (Natural Resources Canada), and Gary Maillet and Gina Doyle (DFO) for their help with analysing sediment organic matter, grain size analyses and bottom water nutrient concentrations, respectively.
FUNDING INFORMATION
Funding for this project was provided by a National Sciences and Engineering Research Council of Canada (NSERC) Discovery Grant to P.V.R.S., an NSERC Postgraduate Scholarship to T.J.C., and by the School of Graduate Studies at Memorial University.
CONFLICTS OF INTEREST STATEMENT
No conflict of interest to declare.
APPENDIX 1
| Time-zero | Six weeks | Twelve weeks | |
|---|---|---|---|
| Seagrass versus unvegetated | |||
| Overall dissimilarity | 48.3% | 47.9% | 59.0% |
| Main contributors |
Pholoe minuta – 5.8% Lottidae Indet. – 5.0% Mediomastus sp. – 4.3% Paranais litoralis – 3.9% |
Mediomastus sp. – 7.1% Monocorophium sp. – 6.5% Macoma balthica – 6.2% Mya arenaria – 5.7% |
Mediomastus sp. – 7.6% Monocorophium sp. – 7.4% Naididae Indet. 2–5.3% Pholoe minuta – 5.2% |
| Seagrass versus disturbance | |||
| Overall dissimilarity | 56.5% | 45.1% | 48.3% |
| Main contributors |
Pholoe minuta – 7.5% Monocorophium sp. – 5.7% Skeneopsis planorbis – 5.6% Microphthalmus sp. – 5.5% |
Microphthalmus sp. – 8.2% Monocorophium sp. – 6.0% Mediomastus sp. – 5.7% Skeneopsis planorbis – 5.2% |
Monocorophium sp. – 7.8% Microphthalmus sp. – 7.5% Skeneopsis planorbis – 5.8% Chironomidae Indet. – 5.4% |
| Unvegetated versus disturbance | |||
| Overall dissimilarity | 62.7% | 60.3% | 57.4% |
| Main contributors |
Alitta succinea – 6.0% Polydora cornuta – 5.6% Lottidae Indet. – 5.5% Bivalvia Indet. 1–5.0% |
Naididae Indet. 2–7.3% Microphthalmus sp. – 7.3% Macoma balthica – 6.5% Mya arenaria – 6.0% |
Naididae Indet. 2–7.5% Microphthalmus sp. – 7.2% Mediomastus sp. – 5.7% Macoma balthica – 5.5% |
| Treatment | MGS (phi) | MSS (phi) | % Gravel | % Sand | % Mud | % Silt | TOC mg g−1 | TN mg g−1 | Chlorophyll a (μg g−1) | Phaeopigment (μg g−1) | Chla: Phaeo Ratio | |
|---|---|---|---|---|---|---|---|---|---|---|---|---|
| Time-zero |
Seagrass |
2.951 |
4.787 |
0 |
81.3 |
18.7 |
15.8 |
3.999 |
0.092 |
28.947 |
58.774 |
0.493 |
|
Disturbance |
1.839 |
4.667 |
8.2 |
87.4 |
4.4 |
3.9 |
1.613 |
0.199 |
4.384 |
27.239 |
0.161 |
|
|
Unvegetated |
1.818 |
4.637 |
11.3 |
80.4 |
8.3 |
8.2 |
9.349 |
0.410 |
3.616 |
34.191 |
0.106 |
|
| Six weeks |
Seagrass |
2.494 |
4.629 |
0 |
90.5 |
9.5 |
9.1 |
7.137 |
0.437 |
9.272 |
59.017 |
0.157 |
|
Disturbance |
2.258 |
4.636 |
0 |
93.8 |
6.2 |
5.9 |
1.977 |
0.000 |
3.389 |
42.671 |
0.0794 |
|
|
Unvegetated |
1.243 |
4.693 |
23.2 |
69.4 |
7.4 |
6.5 |
16.305 |
0.765 |
2.022 |
26.673 |
0.0758 |
|
| Twelve weeks |
Seagrass |
2.342 |
4.707 |
0.3 |
91.3 |
8.4 |
7.3 |
4.366 |
0.000 |
20.669 |
33.744 |
0.613 |
|
Disturbance |
2.229 |
4.67 |
0 |
94.3 |
5.7 |
5.1 |
1.348 |
0.000 |
3.691 |
36.199 |
0.102 |
|
|
Unvegetated |
1.568 |
4.853 |
7.4 |
86.3 |
6.3 |
4.8 |
11.710 |
1.021 |
2.477 |
24.769 |
0.100 |
- Note: % Mud consists of % Silt plus the clay fraction.
- Abbreviations: MGS, mean grain size; MSS, mean sortable silt (>10 μm, <63 μm) size; TN, total nitrogen; TOC, total organic carbon.
Open Research
DATA AVAILABILITY STATEMENT
The data that support the findings of this study are available from the corresponding author upon reasonable request.


